
 ?Mathematical formulae have been encoded as MathML and are displayed in this HTML version using MathJax in order to improve their display. Uncheck the box to turn MathJax off. This feature requires Javascript. Click on a formula to zoom.
Abstract
Graphene, a two-dimensional carbon allotrope, exhibits excellent optoelectronic properties. The assembly of graphene into films provides a platform to deepen the study of its interaction with varying surfaces, to engineer devices, and to develop functional materials. A general approach to produce graphene films consists of preparing a dispersion and laying it on a substrate of choice, followed by solvent evaporation. Here, we report the preparation of stable suspensions of new types of graphene nanomaterials namely, graphene nanoflowers (GNFs) and multi-layer graphene (MLG) flakes, in ethanol, N,N-dimethylformamide (DMF), and N-methyl-2-pyrrolidone (NMP). Sprayable suspensions of both GNFs and MLG were prepared in DMF/ethanol, which showed high stability, without addition of any surfactant. The stable suspensions were used to deposit micrometer-thick MLG/GNF films on glass substrates. Calculations of initial droplet size and of timescale of droplet evaporation are performed and possible thermophoretic effects on droplet deposition discussed as well. Coating glass substrates with a methacrylic acid–methyl methacrylate (MA) copolymer prior to the deposition significantly improved the adhesion of the nanomaterials to the substrate. With the MA coating, a substrate coverage of nearly 100% was achieved at 14-min spraying time for 0.05 wt% GNF and 0.1 wt% MLG suspensions. Raman spectra of the GNF and MLG films reveal that the films were made of MLG in which the individual graphene layers rotated from each other as in turbostratic graphene. This work provides a general approach to prepare graphene nanomaterial suspensions and to create films for a variety of applications. The spraying process applied in the current work is highly scalable and allows control of film characteristics through process parameters.
Copyright 2015 American Association for Aerosol Research
1. INTRODUCTION
Graphene, a one-atom-thick layer of carbon also known as single layer graphene (SLG), exhibits remarkably high specific surface area, thermal conductivity, charge carrier mobility, transparency, and impermeability to gases (Novoselov et al. Citation2004; Balandin et al. Citation2008; Geim Citation2009; Mayorov et al. Citation2011; Nair et al. Citation2012). Other formats of this material include few-layer graphene (FLG, ∼2–5 monolayers), multi-layer graphene (MLG, ∼2–10 monolayers), or multilayered intricate structures. The superior properties of graphene nanomaterials provide them with an extraordinary technological value. Graphene-based materials find use in catalyst supports, membranes, and composites, and also in high-end applications such as energy generation and storage devices, gas sensors, printable electronics, and advanced electromagnetic materials (Nguyen et al. Citation2011; Wei and Kivioja Citation2013). In those applications, graphene is typically layered on substrates as a thin film or coating.
Several methods of graphene film fabrication have been developed. The most common approaches include direct CVD and liquid-based deposition of exfoliated graphite. CVD generally produces SLG of high quality. It is, however, an expensive process that requires special substrates for synthesis with subsequent transferal to a second material for practical applications, and currently only samples of a few mm2 are affordable. Liquid-based approaches produce predominantly stacks of graphene consisting of >2 monolayers. The process is significantly cheaper than CVD but the final material typically contains defects and impurities, and the process faces difficulties for scaling up (Wei and Kivioja Citation2013; Wolf Citation2014). From a technological perspective, a cost-effective, high-throughput, and industrially scalable process is attractive.
Spray-based methods combine those advantageous factors and also offer a relatively good control of film thickness and morphology, targeted or large-area deposition, and versatility of solvents through adjustment of process parameters. The literature on direct spray-deposition of graphene nanomaterials is limited. Blake et al. (Citation2008) spray-deposited a DMF-based graphene suspension onto a preheated glass slide. They obtained ∼1.5 nm-thick films over centimeter sized areas. However, Blake et al. (Citation2008) did not report the spray-deposition parameters and conditions, i.e., deposition area, deposition time, suspension concentration, liquid feeding rate. Jang et al. (Citation2012) electrosprayed suspensions of graphene nanosheets (0.16 mg/mL in deionized (DI) water/ethanol 6/4 v/v) onto a transparent conductive oxide (TCO)-coated glass to prepare cathodes for dye-sensitized solar cells (DSCs). Ju et al. (Citation2013) also electrosprayed N-doped graphene nanoplatelets (0.1 wt% in 2-propanol) for organic DSCs’ counter electrodes. The film exhibited a relatively low optical transmittance of 31% at 550 nm. Nevertheless, as the authors claimed, the optical transparency is not critical as light would penetrate through the opposite side of the cell. Modesto-López et al. (Citation2012, Citation2013) used an electrospray coupled with an ion-emitting source to deposit graphene nanosheets onto dielectric substrates to develop ultrafast pulse laser technology. The electrospray method produces uniform films with high deposition efficiency; however, it is more appropriate for layering of small-scale samples (e.g., micro-patterning and design of prototypes) due to a throughput of a few μL/min (Jang et al. Citation2012; Modesto-López et al. Citation2009, 2012, Citation2013; Ju et al. Citation2013). Others have used a multistep approach that consists of spraying graphene oxide nanoplatelets followed by reduction of the resulting film (Gilje et al. Citation2007; Nair et al. Citation2012, Kauppila et al. Citation2014). Film formation by spraying suspensions on substrates generally involves multiple simultaneous steps: in-flight droplet evaporation, droplet impaction and spreading on the substrate, followed by solvent evaporation from it, and finally formation of dried relics or patterns. Despite the current efforts to fabricate graphene-based films by spraying, the parameters that govern the formation films remain largely unknown and substantial work is required to investigate its phenomenology. Aspects such as timescale of droplet evaporation, droplet spreading on substrates (Majumder et al. Citation2010), and the affinity of graphene with the substrate (Lee et al. Citation2009; Ou et al. Citation2010) should be considered.
A critical step in the spraying of graphene films is the preparation of stable dispersions, which is beneficial to prevent concentration gradients, sedimentation, and significant agglomeration. The challenge resides in suspending a sufficiently high concentration of graphene nanomaterials for at least the spray deposition timescale. Generally, graphene nanomaterials are functionalized or surfactants are added to the dispersions. However, unless they add value to the resulting film, no additives should ideally be used in the dispersion as they may generate extra, complex steps. Once in the films the nanomaterials must be physically connected, that is, they must be percolated, to create pathways for continuous transfer of charge and/or material. Another key aspect of nanostructured films is the adhesion between nanomaterials and the substrate. Good adhesion provides mechanical and thermal stability to the film, thus enhancing its performance. It is known that graphene has poor adhesion to glass (Lee et al. Citation2009; Ou et al. Citation2010), a common substrate found in many literature reports; however, discussion on their contact remains elusive.
Recently, our group reported the synthesis of new types of graphene layers, assembled into nanoflower-like structures and in flakes of MLG. They are produced from silicon-carbon (Si-C) nanoparticle precursors using industrially scalable processes (Miettinen et al. Citation2014). Preliminary tests showed that both materials readily disperse in ethanol, by applying mild ultrasonication, and remain stable for several days, without the addition of surfactants, which opens possibilities for applications through their deposition on substrates. In this work, we developed a method to prepare stable dispersions of the graphene nanomaterials in organic solvents and present an approach to form films using ultrasonic atomization combined with mild heating. The phenomenology of deposition of droplets of those suspensions is discussed, including possible thermophoretic effects.
2. EXPERIMENTAL PROCEDURE
2.1. Materials
Graphene nanomaterials were synthesized by inductively annealing silicon-carbon (Si-C) nanoparticles at 2600°C as described in Miettinen et al. (Citation2011, Citation2014). The powder consisted of graphene nanoflowers (GNFs) and multi-layer graphene (MLG) flakes. and b show transmission electron microscopy (TEM) images of typical GNFs and MLG flakes, respectively. Ethanol (99.5%), N,N-dimethylformamide (DMF, ACS reagent, ≥ (99.8% [GC]), and N-methyl-2-pyrrolidone (NMP, anhydrous, 99.5%) were purchased from Sigma-Aldrich and used as received. Methacrylic acid–methyl methacrylate (MA) copolymer (1:1, EUDRAGIT L 100) was obtained from Degussa (Germany) and used as received. Glass slides (8 × 8 cm, 1-mm thick, 100 OTG 45°) were purchased from Thermo Scientific (Germany) and cut into 4-cm × 4-cm pieces for film deposition experiments.
FIG. 1. TEM images of typical graphene nanomaterials. (a) GNF; the inset shows several GNFs on a TEM grid. (b) A MLG flake with some GNFs attached to its surface.
2.2. Preparation of Dispersions
A protocol to separate the GNFs and MLG flakes in the three solvents (ethanol, DMF, and NMP) was developed and is described in details in the online supplemental information (SI). The procedure is based on a series of centrifugation-ultrasonication steps and allows the preparation of dispersions of nearly 100% GNFs with high size monodispersity. Conversely, the MLG dispersions consist of a mixture of graphene flakes, of a few micrometers in lateral size, and agglomerates of GNFs. TEM images of the graphene nanomaterials are shown in .
For spraying, MLG and GNF dispersions were diluted in ethanol to yield required concentrations, typically 0.05 wt%, 0.1 wt%, and 0.2 wt%. Dilution in ethanol also facilitates solvent evaporation, reduces the toxicity of otherwise pure DMF, and prevents damage to the atomizer components. The concentrations were calculated using the nanomaterial's absorption coefficient, which we determined to be 1488 L g−1 m−1 in DMF (details in the SI).
Ancillary ultrasonication of the MLG flakes was carried out with a probe ultrasonicator (Hielscher ultrasonics UIS250v with 5 mm sonotrode) operated at 90% of its full power (see the SI for experimental results).
2.3. Preparation of Films by Spraying
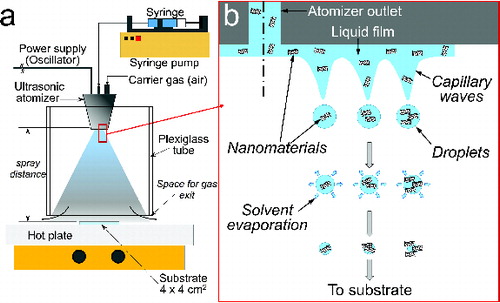
The schematic of the film deposition setup is depicted in . It consists of an ultrasonic atomizer (Lechler, Type US 1) connected to a continuous suspension feeding system (syringe pump, Kd Scientific, KDS100) and equipped with a high-frequency oscillator that operates at 100 kHz and with an inlet for carrier gas. Piezoceramic elements in the atomizer produce mechanical oscillations, which induce capillary waves in a liquid film that develops on the atomizer outlet (). Droplets detach from the peaks of those waves and are ejected into parabolic trajectories. A typical droplet size for aqueous solutions is specified by the manufacturer to be 22 μm (standard deviation 1.7 μm and liquid flow rate of 60–1500 mL/h). As the droplets move downwards the solvent partially evaporates in-flight and droplets impinge on a substrate resting on a hot plate, and placed perpendicularly to the direction of the spray. The hot plate temperature is set to 150°C (with an actual value, as measured with a FLIR Systems infrared camera, of 111°C, which correlates well with a calculated temperature of 119°C, see Section 3.2 and the SI). The mean droplet velocity at a gas flow rate of 88 L/min is 2.97 m/s (specified by the manufacturer). An air flow rate of 9 L/min (mean droplet velocity ∼ 0.3 m/s) was supplied into the atomizer to transport the droplets onto the substrate. A typical spray distance (i.e., the distance from the tip of the atomizer outlet to the substrate surface) and suspension feeding rate are 10 cm and 200 mL/h, respectively. The estimated droplet residence time (tr) is 0.3 s (i.e., time to reach the substrate surface from the spray source). The spray is enclosed in a plexiglass tube of 10-cm inner diameter and 0.5 cm-thick wall to prevent perturbations by external air currents. A 1-cm separation between the bottom edge of the plexiglass tube and the hotplate surface allowed the carrier gas to flow out of the substrate zone. The center of the 4-cm × 4-cm substrates were aligned along the centerline of atomizer and plexiglass tube so as to fit in the center of the spray plume and avoid possible edge effects on the substrate (). The spraying time, ts, is varied between 7 min and 14 min, and in some cases films were collected only for 30 s to investigate the footprints at early stages of the deposition. Slides of glass and MA-coated glass (hereafter MA-glass) were used as substrates. Details of the substrate preparation procedure are described in the SI. A digital image of a typical graphene nanomaterial film is shown in Figure S4.
FIG. 2. (a) Ultrasonic spraying system used for film deposition experiments (front view) and (b) description of droplet formation on the surface of the ultrasonic atomizer.
The average initial droplet diameter of ultrasonically sprayed droplets was calculated with:
[1]
[1] where dp,1 is the droplet diameter (cm), σ the liquid surface tension (dyne/cm), ρ the liquid density (g/mL), and f the ultrasonic frequency (Hz) (Lang Citation1962; Taylor and McCallion 1997). EquationEquation (1)
[1]
[1] does not account either for the liquid flow rate (Q) or viscosity (η), both of which are known to influence droplet size (Rajan and Pandit Citation2001). For comparison, the following empirical formula was used (Rajan and Pandit Citation2001):
[2]
[2]
In EquationEquation (2)[2]
[2] the values are given in SI units, and in this work the power/area ratio is 101,859 W/m2, the surface tension (0.0221 N/m), viscosity (1.0195 × 10⁻³ sN/m2), and density (789 kg/m3) of ethanol at 25°C (Dean Citation1999) were used. Equations (1) and (2) give mean droplet sizes of 14 μm and 9 μm, respectively.
Droplets’ evaporation timescales were calculated with the d2-law of vaporization (Law Citation2006). The droplet vapor pressure and surface temperature were obtained iteratively using the well-known Clausius-Clapeyron equation. The heat of vaporization and heat capacity as a function of temperature of each solvent were estimated from correlations proposed by Haggenmacher (Citation1946) and by Zábranský and Růžička (Citation2004), respectively.
Details of characterization of suspensions and films by dynamic/electrophoretic light scattering (DLS/ELS), transmission/scanning electron microscopy (TEM/SEM), and UV-vis and Raman spectroscopy are provided as SI. For determining the percentage of substrate coverage by the nanomaterials at least five SEM images per film were analyzed with a freeware image processing software (ImageJ). The images were recorded at varying locations on the films, and each image covered an area of approximately 10 μm × 8 μm.
3. RESULTS AND DISCUSSION
3.1. Stability of Graphene Suspensions
The stability of graphene nanomaterials in liquids is of paramount importance for film deposition by spraying as it will influence particle agglomeration, sedimentation, and material distribution on substrates.
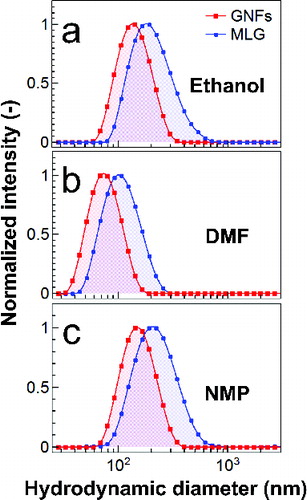
The size distribution of graphene nanomaterials, measured by DLS, in three different organic solvents, ethanol, DMF, and NMP is shown in . In DMF, GNFs and MLG flakes show mean diameters of 74 nm and 100 nm, respectively, and in ethanol those values increase up to 135 nm and 180 nm. In NMP, the mean diameters are 148 nm for GNFs and 206 nm for MLG flakes, nearly twice their size in DMF. The polydispersity of both materials also increases in the order DMF < ethanol < NMP. The size of dried samples of GNFs from quantitative analyses of TEM images (i.e., TEM size) is 48 nm ± 9 nm (see the SI) showing a good correlation with their size in DMF measured by DLS.
FIG. 3. Size distribution of GNFs and MLG flakes suspended in (a) DMF, (b) ethanol, and (c) NMP.
In a separation by centrifugation, the viscosity of the medium influences the sedimentation speed. The room temperature viscosity of NMP is as twice higher as that of DMF and ethanol (viscosity data in the SI). In solvents with relatively high viscosity large particles with large aspect ratios experience higher frictional force, thus reducing their sedimentation coefficient and slowing down their settling compared to small particles. Therefore, the fraction of dispersed materials is expected to be higher in NMP than in DMF or ethanol. Indeed, UV-visible light absorption measurements indicate that the material fraction suspended in NMP is approximately 2.7 times and 1.2 times higher than in DMF for GNFs and MLG flakes, respectively. In ethanol, however, such fractions decreased 50 times for GNFs and 77 times for MLG flakes, compared to those in NMP. It appears as though the larger mean diameters and size polydispersity observed in NMP originate from a higher fraction of suspended nanomaterials, thus forming large but stable agglomerates. It is noteworthy to mention that DMF- and NMP-based dispersions remain stable with no signs of sedimentation for several weeks. Conversely, ethanol-based dispersions of MLG flakes show sedimentation after a few days. Our observations and the data of Table S1 suggest that NMP is the most suitable solvent to disperse the new type of graphene nanomaterials, among the solvents used in this work, in line with results for SLG graphene reported by others (O’Neill et al. Citation2011). Nevertheless, NMP has a high boiling point (Table S1), which would require sufficiently high temperatures to vaporize it during a spraying process within a timescale of, typically, milliseconds. Furthermore, O’Neill and co-workers (Citation2011) have also observed that the fraction of graphene that can be dispersed in NMP and DMF does not vary significantly and that there is a tendency for graphene agglomeration in high boiling point solvents compared those with low boiling point. In a spray-based film formation, large agglomerates may cause non-uniform patterns, affecting the material distribution on substrates. Thus, for the present work DMF or DMF/ethanol mixtures are more advantageous than NMP.
In an ancillary experiment, we attempted to decrease the lateral size of MLG flakes aiming at minimizing the steric hindering associated with their intricate shape. A 0.005 wt% MLG suspension in DMF was probe ultrasonicated for several hours, but its size distribution did not vary significantly with time (Figure S3). Changes in flake morphology, if any, are subtle and their identification by visual inspection results complex, partially because of the flake shape.
3.1.1. Zeta Potential and Electrical Conductivity of Graphene Suspensions
To gain further insight on the stability of suspensions for spraying, DMF-based dispersions were diluted at a volume ratio of 1:19 in ethanol and their zeta potential was measured; NMP-based suspensions were also investigated for comparison. summarizes zeta potential and electrical conductivity data. All suspensions show a negative zeta potential smaller than −30 mV, the threshold value under which a suspension may be considered stable (as recommended by the ELS instrument manufacturer). The data suggest that the GNFs and MLG flakes have a negatively charged surface and are sufficiently stable to avoid sedimentation during spraying. Their light absorption patterns (Figure S3k) are typical of graphene with a maximum at ∼270 nm, thus suggesting that dilution in ethanol did not change their physicochemical properties.
TABLE 1 Zeta potential of GNFs and MLG flakes in sprayable suspensions
Note that the electrical conductivity of all suspensions was higher than reported conductivities of the pure solvents (DMF ∼2.5 μS/cm [Macfie et al. Citation2001], ∼6.5 μS/cm [Theron et al. Citation2004]; NMP < 0.02 μS/cm [Chen et al. Citation2012]; and ethanol ∼0. 1 μS/cm [Modesto-López and Biswas Citation2010]). In all cases, the addition of GNFs and MLG flakes enhance the electrical conductivity by at least 88% with respect to pure solvents. Our findings are in agreement with others (Baby and Ramaprabhu Citation2010; Dang et al. Citation2012). The addition of these new types of graphene nanomaterials may be beneficial to increase the conductivity of liquids simultaneously adding material functionality in certain applications.
3.2. Phenomenology of Droplet Impaction and Spreading on Substrate
Spray-based deposition of droplets onto heated substrates could be divided into two stages: droplet generation with in-flight evaporation and droplet impaction on substrates. In the first stage, if the droplet evaporation time in-flight (tev) > the residence time (tr) droplets reach the substrate and impact, otherwise agglomerates are formed. In the second stage, assuming tev > tr, parameters such as droplet impact velocity, droplet viscosity, liquid wettability of substrate (i.e., contact angle), and substrate temperature become important to assess the droplet spreading and drying on substrates (Deegan et al. Citation1997; Moreira et al. Citation2010). Once a droplet has landed on a heated substrate, multiple phenomena occur simultaneously; all with varying kinetics. Upon spreading, a droplet forms a so-called pinning line that delimits its perimeter and maintain its diameter constant (Deegan et al. Citation1997). The extent of droplet spreading depends as well on the substrate surface’ physicochemical properties. The surface roughness has been identified to exert a strong effect on the morphology of spreading droplets (Bussmann et al. Citation2000; Neagu et al. Citation2005). As evaporation proceeds, and as a result of droplet volume reduction, a capillary motion in the horizontal direction towards the pinning line arises from the center of the droplet to replenish the volume lost by evaporation, thus driving material contained in the droplets towards that line. The ring formed at the pinning line can concentrate virtually all dispersed material in a droplet (Deegan et al. Citation1997). Since the substrate is heated, a temperature gradient arises between the base of the droplet and its top, in contact with air. Such temperature difference causes a surface tension gradient and a second motion of particles originates from the pinning line along the curved liquid–air interface towards the inner part of the droplet, as reported by Zhang et al. (Citation2013). They observed that compared to evaporation at room temperature, at relatively mild substrate temperatures (130°C) the periphery of the ring becomes thinner due to a significantly less amount of material in it (less than 50% of the total mass compared to the 90% at room temperature), while the rest is distributed within the ring. In that case, the droplet evaporation time on the heated substrate (tev_subs) < the droplet coalescence time (tcoal_subs) on it. If the substrate temperature is not sufficiently high to evaporate the impacting droplets, liquid may accumulate on it and disturb droplet capillary motions, thus modifying the final relic shape (Majumder et al. Citation2010), in such case tev_subs > tcoal_subs.
Note that although the hot plate temperature (Thot) was set to 150°C, the actual substrate temperature is lower due to heat dissipation to the surroundings, impingement of relatively cool carrier gas, and solvent's evaporative cooling (Perednis Citation2003; Neagu et al. Citation2005; Filipovic et al. Citation2013). We have calculated the substrate temperature (Tsubs), by fitting the data of Neagu et al. (Citation2005) who used a similar heating setup configuration as ours, with: Tsubs [°C] = 0.6674 Thot + 18.919. A hot plate temperature of 150°C results in an actual substrate surface temperature of ∼119°C. The estimation correlates well with a measured value of 111°C obtained with an infrared camera (with an ethanol spray and using the plexiglass tube, see the SI). Furthermore, temperature profiles on substrates heated in the range 300°C–200°C have been measured to reach values of 70°C–50°C at a distance as close as 0.005 m from the substrate surface and remain nearly constant up to a distance of 0.07 m above it (Perednis Citation2003; Muecke et al. Citation2009; Filipovic et al. Citation2013). Our measurements with the infrared camera indicates a temperature of ∼32°C at the tip of the ultrasonic sprayer (with an ethanol spray and without the plexiglass tube). Such temperature variability may have an effect on droplet evaporation dynamics.
We have estimated, using the d2-law of vaporization (Law Citation2006), that at 50°C the tev of 10-μm pure ethanol and DMF droplets are ∼11 ms and ∼23 ms, respectively. At 119°C, tev would be 4.5 ms and 5 ms for ethanol and DMF droplets, respectively. Note that the mean droplet sizes calculated with Equations (1) and (2) are 14 μm and 9 μm, respectively. For comparison, we have also estimated the tev of 40-μm droplets, at 50°C, such values correspond to 173 ms and 383 ms, and at 119°C they are 71 ms and 81 ms, for ethanol and DMF, respectively. It follows that as the droplets contain approximately 50% in volume of each solvent, the evaporation time would be roughly an intermediate of our estimations for pure droplets. Therefore, droplets with initial sizes ≥ approximately 40 μm are expected to land on the substrate and form ring patterns (considering that tr is ∼300 ms). Furthermore, as others authors have pointed out (Perednis Citation2003; Muecke et al. Citation2009; Filipovic et al. Citation2013) the temperature rises sharply within a few millimeters closer to the substrate (typically 0.005 m) causing a strong thermal gradient. In that region, thermophoretic effects on droplets may play a key role and take over gravitational or drag forces, depending on droplet size. We have calculated that for a 10-μm ethanol droplet the gravitational (4.05 × 10⁻¹² N) and drag (5.09 × 10⁻¹² N) forces are approximately two orders of magnitude greater than the thermophoretic force (8.81 × 10⁻¹⁴ N) for a distance range of 0.01 m–0.005 m from the substrate surface (that is, a temperature range of 50°C–70°C and a gradient of 210°C/m). In the 0.005-m region closer to the substrate surface, however, the magnitude of the thermophoretic force (4.10 × 10⁻¹² N) produced by a gradient of 9800°C/m (from 70°C to 119°C) is of the same order as both, the gravitational and drag forces. Thermophoretic effects may retard or impede the deposition of relatively small droplets (≤10 μm). Nevertheless, in the vicinity of the substrate surface, relatively small droplets evaporate quickly due to the sharp temperature rise and produce an evaporative cooling. Although, thermophoretic effects are complex to estimate (Muecke et al. Citation2009), they would be relevant only for droplets with sizes below 10 μm.
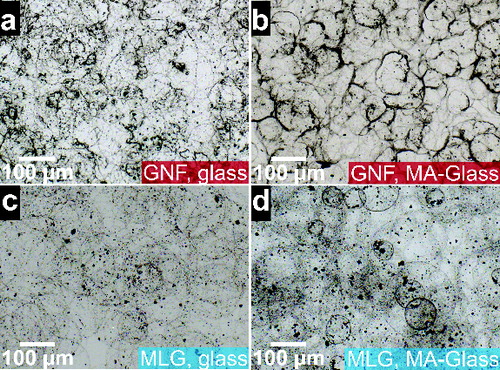
To investigate film ring patterns at an early stage of the deposition, optical microscopy images of films sprayed during 30 s were collected on glass and MA-glass slides and analyzed with microscopic methods. and b display images of droplet footprints from a 0.05 wt% GNF suspension on glass and MA-glass, respectively. Note that in the latter case the footprints appear clearly marked, with dark edges. The average footprint diameters are 81.5 μm and 80 μm with standard deviations of 17 μm and 12 μm for glass and MA-glass, respectively. and d show footprints from MLG suspensions on glass (0.05 wt%) and MA-glass (0.1 wt%), respectively. The average diameters and standard deviations of the footprints are ∼152 μm and 35 μm for glass and 67 μm and 11 μm for MA-glass. In general, footprints on MA-glass are smaller and more monodisperse than their glass counterparts. Droplet impaction and spreading accounts for the significantly larger diameter of the ring patterns compared to those of the initial droplets (with sizes ≥ approximately 40-μm) implying that tev > tr and also that tev_subs ≤ tcoal_subs. The smaller fingerprints on MA-glass are most likely related to a local viscosity rise as droplets may dissolve some of the copolymer when they land. We observed that ethanol and DMF easily spread on both substrates, so wettability differences between them are not significant. The observation is in agreement with measurements reported by others (Janssen et al. Citation2006). Solvent vapor in the surroundings of the substrate surface may also contribute to some degree to copolymer dissolution, at least at the copolymer-air interface.
FIG. 4. Optical microscopy images of droplet footprints from GNF suspensions (a, on glass; b, on MA-glass) and MLG suspensions (c, on glass; d, on MA-glass).
3.3. Nanostructured Graphene Nanoflower (GNF) and Multi-Layer Graphene (MLG) Flake Films by Spraying
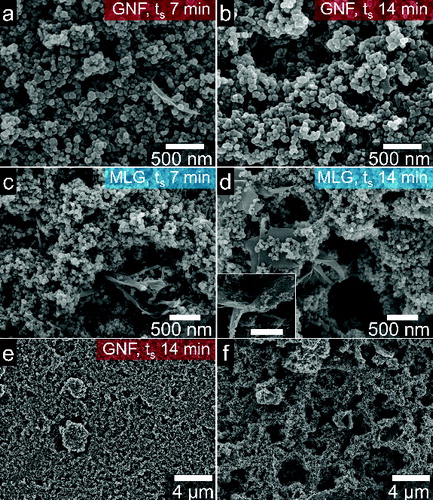
GNF suspensions with concentration of 0.05 wt% were ultrasonically sprayed onto glass for 7 min () and 14 min (). The area of substrate covered by GNFs is 70% and 79% for 7-min and 14-min depositions, respectively. The morphology of MLG films on glass was also investigated. MLG dispersions with concentrations of 0.05 wt%, 0.1 wt%, and 0.2 wt% were ultrasonically sprayed for 7 min onto glass substrates. –f show SEM images of such films. The film made from the 0.2 wt% MLG suspension was composed of compact agglomerates (). MLG flakes are scattered and spotted on the entire substrate but the material distribution is not uniform, resulting in largely uncovered substrate areas. Analyses of their SEM images reveal that the substrate coverage is approximately 79%. With suspensions of 0.1 wt% () and 0.05 wt% () the presence of spherical agglomerates with a diameter of over 4 μm is less frequent; however, they result in substrate coverage values of ∼73% and ∼64%, respectively. All the films are percolated and large MLG flakes are observed too. In many cases, the flakes appear entirely coated by nanoflowers and their agglomerates. As depicted in , increasing the spraying time from 7 min to 14 min for a 0.1 wt% MLG suspension resulted only in formation of larger deposits with no significant variation in substrate coverage, being ∼74% for ts of 14 min. Despite the uncovered areas, the concentrations used in the current work were sufficient to achieve percolated films in a spraying time on the order of minutes. Both, GNFs and MLG flakes are attached to the glass substrates by weak van der Waals forces; and they do not prevent film degradation by material removal. We observed that the films on glass show poor adhesion and are easily removed by scratches or weak air currents. It is known that graphitic materials have poor affinity with glass due to lack of functional groups on their surface, particularly graphene (Lee et al. Citation2009; Ou et al. Citation2010). The relatively poor substrate coverage on glass is attributed to that lack of affinity between graphene and glass.
FIG. 5. SEM images of graphene nanomaterial films on glass. GNF films at spraying time, ts, of (a) 7 min and (b) 14 min. MLG films at ts of 7 min for varying suspension concentrations of (c) 0.2 wt%, (d) 0.1 wt%, and (e) 0.05 wt%. (f) Image of a 0.1 wt% MLG suspension sprayed for 14 min.
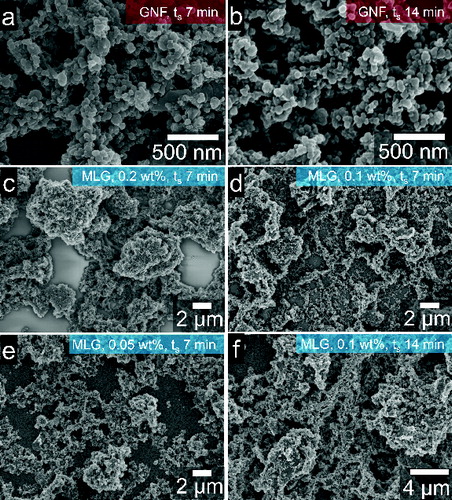
Conversely, functional groups in the MA polymeric chain are expected to improve the attachment of graphene nanomaterials to the substrate. To investigate the improved nanomaterial adhesion to substrates and thus its surface coverage, GNF and MLG suspensions were sprayed onto MA-glasses. The GNFs were sprayed for 7 min () and 14 min (). Indeed, an enhancement on the nanoflowers’ adhesion is obtained in MA-glasses compared to glass slides, resulting in substrate coverages of ∼80% and ∼96% for spraying times of 7 min and 14 min, respectively. Further, MLG suspensions of 0.1 wt% were sprayed on MA-glass for 7 min () and 14 min (). In those cases, the MLG flakes cover 93% and nearly 100% of the area, for 7-min and 14-min spraying time, respectively. The inset of d depicts an MLG flake buried in the film and covered by GNFs; MLG flakes were found in all areas of the films. As discussed earlier, the advantage of the copolymer coating can also be observed in the SEM images of and f, where a large-area, percolated films of GNFs and MLG are displayed (ts = 14 min, MLG 0.1 wt%).
FIG. 6. SEM images of graphene nanomaterial films on MA-glass. GNFs at ts of (a) 7 min and (b) 14 min. MLG flakes at ts of (c) 7 min and (d) 14 min; inset scale bar indicates is 1 μm. Low-magnification images of (e) GNFs and (f) MLGs sprayed for 14 min.
The film height was measured from cross-sectional SEM images of the films as depicted in . On glass, for a spraying time of 14 min, the surface of MLG films appears irregular and particles of varying sizes are observed (); the film height varies significantly up to a maximum of ∼ 6 μm. For the same ts on MA-glass (), the film height is also irregular from 2 μm to 7 μm in some areas heights of up to 13 μm are measured too. The height difference observed in glass and MA-glass substrates indicates that a higher mass was deposited on the latter. The inset of shows an image of a MLG flake buried in the film. Partially, the wide variation in film height may be attributed to flakes with irregular shape, which generates voids and creates and embossing effect on the surface. Conversely, compared to the14-min sprayed films on MA-glass, at ts = 7 min the film is more uniform and compact with an average height of 6.5 μm. Flakes are observed in this case too (inset of ). In the case of the GNFs, at 14-min spraying on glass (), the film height is irregular and varies from uncoated areas up to an average of 550 nm. Conversely, for the same ts on MA-glass (), the film height is more uniform and compact with and average value of ∼600 nm. Reduction in the spraying time to 7 min resulted in a thinner film of an average height of ∼350 nm (); the film height also appears uniform. In all the samples, the films show a rough surface as a result of the inherently irregular shape of the graphene nanomaterials.
FIG. 7. Cross-sectional SEM images of MLG on glass (a, 14 min) and MA-glass (b, 14 min; c, 7 min); and GNF on glass (d, 14 min) and MA-glass (e, 14 min; f, 7 min). Insets show MLG flakes buried in the films; scale bar: 200 nm.
Clearly, modification of glass substrates with the polymer coating improves the adhesion of the nanomaterials. Functional groups (OH or COO) in the polymeric chain of MA possibly interact with the surface and form weak electrostatic bonds, for instance hydrogen bonds. Additionally, solvent vapor nearby the substrate surface combined with softening of MA (glass transition temperature of 130°C) contribute to dissolution of some copolymer, at least at the MA-air interface. The dissolved copolymer may then entrain arriving nanomaterials and glue them to the substrate, thus preventing their removal by air flow from the atomizer or convection from the hot plate.
The compositions of GNF and MLG films were investigated by Raman spectroscopy (see the SI for details). The spectra show the characteristic Raman bands of graphene at 1351 cm−1 (D band), 1584 cm−1 (G band), 1620 cm−1 (shoulder, D’ band), and 2697 cm−1 (2D band) and agree with reported data (Ferrari Citation2007). The spectra reveal that both types of films are composed of so-called turbostratic graphene (Malard et al. Citation2009), in which the layers are randomly rotated from each other.
4. CONCLUSIONS
We reported a protocol to prepare stable suspensions of a new type of graphene nanomaterials namely, graphene nanoflowers and multi-layer graphene flakes, in three organic solvents: ethanol, DMF, and NMP. NMP was able to suspend a larger fraction of nanomaterials than ethanol or DMF. However, the nanomaterials showed the smallest particle sizes in DMF. Furthermore, the relatively high boiling point and toxicity of NMP undermine its suitability for spray deposition. A mixture of DMF/ethanol was used as solvent to ultrasonically spray the nanomaterials due to the lower boiling point of both compared to that of NMP. GNFs and MLG flakes in DMF/ethanol and NMP/ethanol suspensions exhibit a negative surface charge as found from zeta potential measurements. Diluted suspensions containing GNFs and MLG in DMF:ethanol and NMP:ethanol showed electrical conductivities one order of magnitude higher than the pure solvents. The energy induced by probe ultrasonication did not break up MLG flakes in DMF but rather modified their colloidal stability, thus resulting in significant sedimentation.
We find that for glass and MA-glass substrates heated at 150°C (actual temperature is ∼111°C), the substrate surface characteristics do not significantly influence the droplet spreading and evaporation upon impaction. They, however, seem to affect the adhesion of the graphene nanomaterials to the substrates and therefore the substrate coverage. Nearly 100% substrate coverage was achieved with 0.05 wt% GNF and 0.1 wt% MLG suspensions on MA-glass slides, for a spraying time of 14 min. At sufficiently long spraying time so-called coffee-ring patterns disappear and uniform films are observed. The Raman spectra of GNF and MLG films reveal that the films were made of MLG in which the individual graphene layers were rotated with respect to each other, which inherently origins from their synthesis process.
Funding
This work was financially supported by the Finnish Funding Agency for Technology and Innovation (TEKES) grant #70043/13 (Scale-G project). The Strategic Funding from the University of Eastern Finland through the NAMBER spearhead project and a post-doctoral fellowship to LBML is also acknowledged. Luis B. Modesto-López is grateful for partial financial support from the research group of Physics of Fluids and Microfluidics of the University of Seville through grant #DPI2013-46485-C3-1-R from the Ministry of Economy and Competitiveness of Spain.
SUPPLEMENTAL MATERIAL
Supplemental data for this article can be accessed on the publisher's website.
991438_Supplemental_Material.zip
Download Zip (1.2 MB)Related Research Data
REFERENCES
- Baby, T. T., and Ramaprabhu, S. (2010). Investigation of Thermal and Electrical Conductivity of Graphene Based Nanofluids. J. Appl. Phys., 108:124308 (6 pp).
- Balandin, A. A., Ghosh, S., Bao, W., Calizo, I., Teweldebrhan, D., Miao, F., et al. (2008). Superior Thermal Conductivity of Single-Layer Graphene. Nano Lett., 8(3):902–907.
- Blake, P., Brimicombe, P. D., Nair, R. R., Booth, T. J., Jiang, D., Schedin, F., et al. (2008). Graphene-Based Liquid Crystal Device. Nano Lett., 8(6):1704–1708.
- Bussmann, M., Chandra, S., and Mostaghimi, J. (2000). Modeling the Splash of a Droplet Impacting a Solid Surface. Phys. Fluids, 12:3121–3132.
- Chen, C., LaRue, J. C., Nelson, R. D., Kulinsky, L., and Madou, M. J. (2012). Electrical Conductivity of Polymer Blends of Poly(3,4-ethylenedioxythiophene):Poly(styrenesulfonate):N-Methyl-2-pyrrolidinone and Polyvinyl Alcohol. J. Appl. Polym. Sci., 125(4):3134–3141.
- Dang, T. T., Pham, V. H., Hur, S. H., Kim, E. J., Kong, B. S., and Chung, J. S. (2012). Superior Dispersion of Highly Reduced Graphene Oxide in N,N-dimethylformamide. J. Colloid Interf. Sci., 376:91–96.
- Dean, J. A. (1999). Lange's Handbook of Chemistry, 15th ed. McGraw-Hill, Inc., United States of America.
- Deegan, R. D., Bakajin, O., Dupont, T. F., Huber, G., Nagel, S. R., and Witten, T. A. (1997). Capillary Flow as the Cause of Ring Stains from Dried Liquid Drops. Nature, 389:827–829.
- Donnelly, T. D., Hogan, J., Mugler, A., Schumbmehl, M., Schommer, N., Bernoff, A. J., et al. (2005). Using Ultrasonic Atomization to Produce an Aerosol of Micron-Scale Particles. Rev. Sci. Instrum., 76:113301.
- Ferrari, A. (2007). Raman Spectroscopy of Graphene and Graphite: Disorder, Electron–Phonon Coupling, Doping and Nonadiabatic Effects. Solid State Commun., 143:47–57.
- Filipovic, L., Selberherr, S., Mutinati, G. C., Brunet, E., Steinhauer, S., Köck, A., et al. (2013). Modeling Spray Pyrolisis Deposition. Proceedings of the World Congress on Engineering 2013, London, U. K., ISSN:2078-0966.
- Geim, A. K. (2009). Graphene: Status and Prospects. Science, 324:1530–1539.
- Gilje, S., Han, S., Wang, M., Wang, K. L., and Kaner, R. B. (2007). A Chemical Route to Graphene for Device Applications. Nano Lett., 7(11):3394–3398.
- Haggenmacher, J. E. (1946). The Heat of Vaporization as a Function of Pressure and Temperature. J. Am. Chem. Soc., 68(8):1633–1634.
- Jang, S.-Y., Kim, Y.-G., Kim, D. Y., Kim, H.-G., and Jo, S. M. (2012). Electrodynamically Sprayed Thin Films of Aqueous Dispersible Graphene Nanosheets: Highly Efficient Cathodes for Dye-Sensitized Solar Cells. Appl. Mater. Inter., 4:3500–3507.
- Janssen, D., De Palma, R., Verlaak, S., Heremans, P., and Dehaen, W. (2006). Static Solvent Contact Angle Measurements, Surface Free Energy and Wettability Determination of Various Self-assembled Monolayers on Silicon Dioxide. Thin Solid Films, 515:1433–1438.
- Ju, M. J., Kim, J. C., Choi, H.-J., Choi, I. T., Kim, S. G., Lim, K., et al. (2013). N‑Doped Graphene Nanoplatelets as Superior Metal-Free Counter Electrodes for OrganicDye-SensitizedSolarCells. ACS Nano, 7(6):5243–5250.
- Kauppila, J., Lund, L., Laiho, T., Salomäki, M., Kankare, J., and Lukkari, J. (2014). Effective Low Temperature Reduction of Graphene Oxide with Vanadium(III). J. Mater. Chem. C, 2:3602–3609.
- Lang, R. J. (1962). Ultrasonic Atomization of Liquids. J. Acoust. Soc. Am., 34:6.
- Law, C. K. (2006). Combustion Physics. Cambridge University Press, New York, United States of America.
- Lee, H., Rajagopalan, R., Robinson, J., and Pantano, C. G. (2009). Processing and Characterization of Ultrathin Carbon Coatings on Glass. Appl. Mater. Interf., 1(4):927–933.
- Macfie, G., Compton, R. G., and Corti, H. R. (2001). Electrical Conductivity and Solubility of KF in N,N-Dimethylformamide up to 125°C. J. Chem. Eng. Data, 46:1300–1304.
- Majumder, M., Rendall, C., Li, M., Behabtu, N., Eukel, J. A., Hauge, R. H., et al. (2010). Insights into the Physics of Spray Coating of SWNT Films. Chem. Eng. Sci., 65:2000–2008.
- Malard, L. M., Pimenta, M. A., Dresselhaus, G., and Dresselhaus, M. S. (2009). Raman Spectroscopy in Graphene. Phys. Rep., 473:51–87.
- Mayorov, A. S., Gorbachev, R. V., Morozov, S. V., Britnell, L., Jalil, R., Ponomarenko, L. A., et al. (2011). Micrometer-Scale Ballistic Transport in Encapsulated Graphene at Room Temperature. Nano Lett., 11:2396–2399.
- Miettinen, M., Hokkinen, J., Karhunen, T., Torvela, T., Pfüller, C., Ramsteiner, M., et al. (2014). Synthesis of Novel Carbon Nanostructures by Annealing of Silicon-Carbon Nanoparticles at Atmospheric Pressure. J. Nanopart. Res., 16:2168 (11 pp).
- Miettinen, M., Johansson, M., Suvanto, S., Riikonen, J., Tapper, U., Pakkanen, T. T., et al. (2011). Atmospheric Pressure Chemical Vapour Synthesis of Silicon–Carbon Nanoceramics from Hexamethyldisilane in High Temperature Aerosol Reactor. J. Nanopart Res., 13:4631–4645.
- Modesto-López, L. B., Bilousov, O. V., Carvajal, J. J., Díaz, F., and Rosell-Llompart, J. (2012). Electrospray Deposition of Graphene Nanosheets, in European Aerosol Conference EAC-2012(Granada, Spain, September 2012).
- Modesto-López, L. B., Bilousov, O. V., Serres, J. M., Carvajal, J. J., Díaz, F., and Rosell-Llompart, J. (2013). Towards Deposition of Single Layer Graphene by an Electrospray Ion-Assisted Method, in European Aerosol Conference EAC-2013(Prague, Czech Republic, September 2013).
- Modesto-López, L. B., and Biswas, P. (2010). Role of the Effective Electrical Conductivity of Nanosuspensions in the Generation of TiO2 Agglomerates with Electrospray. J. Aerosol. Sci., 41(8):790–834.
- Modesto-López, L. B., Pasteris, J. D., and Biswas, P. (2009). Sensitivity of Micro-Raman Spectrum to Crystallite Size of Electrospray-Deposited and Post-Annealed Films of Iron-Oxide Nanoparticle Suspensions. Appl. Spectrosc., 63(6):627–635.
- Moreira, A. L. N., Moita, A. S., and Panao, M. R. (2010). Advances and Challenges in Explaining Fuel Spray Impingement: How Much of Single Droplet Impact Research is Useful? Prog. Energy Comb. Sci., 36(5):554–580.
- Muecke, U. P., Messing, G. L., and Gauckler, L. J. (2009). The Leidenfrost Effect during Spray Pyrolysis of Nickel Oxide-Gadolinia Doped Ceria Composite Thin Films. Thin Solid Films, 517:1515–1521.
- Nair, R. R., Wu, H. A., Jayaram, P. N., Grigorieva, I. V., and Geim, A. K. (2012). Unimpeded Permeation of Water Through Helium-Leak–Tight Graphene-Based Membranes. Science, 335:442–444.
- Neagu, R., Perednis, D., Princivalle, A., and Djurado, E. (2005). Initial Stages in Zirconia Coatings Using ESD. Chem. Mater., 17:902–910.
- Nguyen, D. D., Tai, N. H., Chueh, Y. L., Chen, S. Y., Chen, Y. J., Kuo, W. S., et al. (2011). Synthesis of Ethanol-Soluble Few-Layer Graphene Nanosheets for Flexible and Transparent Conducting Composite Films. Nanotechnology, 22:295606 (8pp).
- Novoselov, K. S., Geim, A. K., Morozov, S. V., Jiang, D., Zhang, Y., Dubonos, S. V., et al. (2004). Electric Field Effect in Atomically Thin Carbon Films. Science, 306:666–669.
- Ou, J., Wang, J., Liu, S., Mu, B., Ren, J., Wang, H., et al. (2010). Tribology Study of Reduced Graphene Oxide Sheets on Silicon Substrate Synthesized via Covalent Assembly. Langmuir, 26:15830–15836.
- O’Neill, A., Khan, U., Nirmalraj, P. N., Boland, J., and Coleman, J. N. (2011). Graphene Dispersion and Exfoliation in Low Boiling Point Solvents. J. Phys. Chem. C, 115:5422–5428.
- Perednis, D. (2003). Thin Film Deposition by Spray Pyrolysis and the Application in Solid Oxide Fuel Cells. Ph.D. Thesis (Diss. No. 15190), Swiss Federal Institute of Technology, Zürich, Switzerland.
- Rajan, A., and Pandit, A. B. (2001). Correlations to Predict Droplet Size in Ultrasonic Atomisation. Ultrasonics, 39:235–255.
- Taylor, K. M. G., and McCallion, O. N. M. (1997). Ultrasonic Nebulisers for Pulmonary Drug Delivery. Int. J. Pharm., 153:93–104.
- Theron, S. A., Zussman, E., and Yarin, A. L. (2004). Experimental Investigation of the Governing Parameters in the Electrospinning of Polymer Solutions. Polymer, 45:2017–2030.
- Wei, D., and Kivioja, J. (2013). Graphene for Energy Solutions and its Industrialization. Nanoscale, 5:10108–10126.
- Wolf, E. L. (2014). Applications of Graphene: An overview (Springer International Publishing AG).
- Zábranský, M., and Růžička, V. Jr. (2004). Estimation of the Heat Capacities of Organic Liquids as a Function of Temperature Using Group Additivity: An Amendment. J. Phys. Chem. Ref. Data, 33(4):1071–1081.
- Zhang, W., Yu, T., Liao, L., and Cao, Z. (2013). Ring Formation from a Drying Sessile Colloidal Droplet. AIP Adv., 3:102109.