
Abstract
This study reports the first of a kind data on aircraft engine non-volatile particulate matter (nvPM) number- and mass-based emissions using standardized systems. Two compliant sampling and measurement systems operated by Missouri University of Science and Technology (Missouri S&T) and Empa were evaluated during the Aviation - Particle Regulatory Instrumentation Demonstration Experiment (A-PRIDE) 4 campaign at the SR Technics facilities in Zürich, Switzerland, in November 2012. The Missouri S&T and Empa systems were compared during a series of dedicated engine tests using a CFM56-5B4/2P engine source, and maintenance engine testing using CFM56-7B24/3 and PW4168A engine sources at a range of engine operating conditions. These two compliant systems were found to agree within 6% of each other in terms of nvPM number-based emissions, and within 15% for nvPM mass-based emissions. For the three engine sources studied, at several engine power conditions the mass instruments approached their limit of detection, resulting in high measurement uncertainties. Ancillary instrumentation was used to determine PM size distributions, chemical composition, and effective density from mass-mobility experiments. Particle geometric mean mobility diameter ranged 20–45 nm, and geometric standard deviation varied from 1.55 to 1.9 for the three engine types studied. The fraction of PM organic content measured in the emissions from the CFM56-5B4/2P engine was ∼4% while the size-dependent particle effective density was parameterized with a mass-mobility exponent of 2.57 and a pre-factor of 0.606. Results of this study will contribute to the development of the new nvPM emissions certification standard and emissions inventories from commercial aviation operations.
1. INTRODUCTION
Aviation's impact on climate has received significant attention as demand for air travel increases (Lee et al. Citation2009, Citation2010). Aircraft operations in the vicinity of airports have raised other concerns about local air quality and health-related impacts (Levy et al. Citation2012). Emissions of nitrogen oxides (NOx), carbon monoxide (CO), unburnt hydrocarbons (UHC), and smoke number (SN; plume visibility) from aircraft engines have been regulated by the International Civil Aviation Organization (ICAO). Gaseous emissions and SN certification data for various aircraft engine types at engine power conditions corresponding to the Landing Take-Off (LTO) Cycle are recorded in the ICAO Aircraft Engine Emissions Databank (EASA Citation2015). The LTO cycle encompasses emissions released below an altitude of 3000 ft, which have an impact on local air quality. Environmental and health impact assessments of aircraft engine emissions rely on particulate matter (PM) characteristics such as number, size, and composition, which are not readily obtained from SN. Recent epidemiological studies have demonstrated a link between ultrafine PM emissions and adverse health effects (Rückerl et al. Citation2011). Most modern commercial aircraft engines have SN values that are smaller than the uncertainty in the SN measurement method (±3 SN; ICAO Citation2008), at some engine power conditions for several engine types. A database of PM emissions characteristics for various aircraft engines certified for commercial aviation is not currently available.
Several studies have reported the physical PM emissions characteristics for a wide range of engine types at various operational states (Herndon et al. Citation2005; Lobo et al. Citation2007; Mazaheri et al. Citation2009; Kinsey et al. Citation2010; Timko et al. Citation2010; Mazaheri et al. Citation2011; Lobo et al. Citation2012a,Citationb; Lobo et al. Citation2015). However, the reported PM emissions data vary because these studies employed different sampling methodologies and different measurement instruments. For emissions certification purposes, the sampling protocol and methodology for PM emissions characterization must be standardized as it has been for gaseous emissions and smoke.
A regulatory standard for non-volatile PM (nvPM) number and mass-based emissions from civil aviation aircraft engines is being developed by ICAO's Committee on Aviation Environmental Protection (CAEP). The standardized sampling and measurement methodology that will be used for future nvPM certification measurements has been defined in the Aerospace Information Report (AIR) 6241 developed by the Society of Automotive Engineers (SAE) Aircraft Exhaust Emissions Measurement Committee (E-31; SAE Citation2013). This standard methodology will become normative once it is converted into a certification document, which will then be used by engine manufacturers in the certification of aircraft engines for nvPM emissions. The system defined in AIR6241 is designed to operate in parallel with existing sampling systems for gaseous emissions and smoke certification defined in ICAO Annex 16 (ICAO Citation2008). The system specifications in AIR6241 build upon the work conducted in previous studies to evaluate sampling and measurement methodologies for aircraft engine nvPM emissions measurements (Petzold et al. Citation2011; Crayford et al. Citation2012).
In this study, two AIR6241 compliant systems—the North American mobile reference system operated by Missouri University of Science and Technology (Missouri S&T), and the Swiss fixed reference system operated by Empa—were deployed at the SR Technics maintenance facility in Zürich, Switzerland, in November 2012 as part of the Aviation - Particle Regulatory Instrumentation Demonstration Experiment 4 (A-PRIDE 4) campaign. The objectives of the study were to ascertain whether the AIR6241 compliant systems as defined were suitable and adequate for the measurement of aircraft engine nvPM emissions and to compare the performance and repeatability of the two compliant systems. The performance of the two systems was compared during dedicated engine testing on a CFM56-5B4/2P engine and maintenance engine testing using CFM56-7B24/3 and PW4168A engines at a range of engine operating conditions. AIR6241 specifies only nvPM number- and mass-based emissions measurements. However, these two parameters alone are insufficient to assess the environmental and health impacts of aircraft nvPM. Hence, ancillary instruments in both systems were used to provide additional characterization of PM in terms of size distributions, effective density, and chemical composition.
2. EXPERIMENTAL METHODOLOGY
2.1. Sampling System
The exhaust sampling probe assembly was installed in the engine test cell at SR Technics. The probe was designed to vertically traverse the exit plane of different engine types that are run in the test cell. A single point probe (8 mm ID) made of Inconel 600 alloy was used to extract emission samples within 1 m downstream of the engine exit plane. The location of the probe in the exhaust exit plane was fixed by experimentally determining the optimal sampling point for each model of the engines tested by matching the chemical air-fuel-ratio (from measured gases) and the one determined from engine parameters.
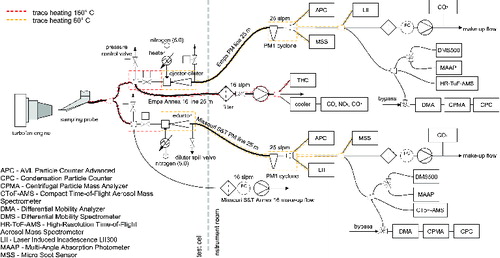
The probe was connected to a Y-splitter using a 7.5 m long, 8 mm ID thin walled stainless steel tubing, which was heat traced to maintain a temperature of 160°C ± 15°C in the sample line (). The Y-splitter provided exhaust samples to the Missouri S&T and Empa systems. Although both the Missouri S&T and Empa systems were AIR6241 compliant, each system was independently constructed with various components sourced from different vendors. Each system had a three-way splitter to distribute sample among the nvPM, pressure control, and Annex 16 lines. The Annex16 line was used to measure undiluted gaseous emissions such as NOx, CO, UHC, and CO2. The sample in the nvPM line was diluted by particle-free dry nitrogen (ultra-high purity 5.0 grade) via a Dekati DI-1000 ejector diluter to suppress the potential for water condensation, particle coagulation, gas-to-particle conversion, and volatile particle formation in the sampling lines. The dilution factor for the nvPM sample was determined by calculating the ratio of the CO2 concentration in the undiluted Annex 16 line to that measured in the nvPM line. Dilution factors for both systems were maintained in the range 8–13, as specified by AIR6241, by regulating the inlet pressure to the ejector diluter to be slightly sub-atmospheric using a control valve in the pressure control line. The diluted sample was then conveyed to the measurement suite by a 25 m long, carbon-loaded, electrically grounded polytetrafluoroethylene (PTFE) tube (Missouri S&T line: 7.87 mm ID, Dekoron Unitherm, Cape Coral, FL, USA; Empa line: 8 mm ID, Hillesheim GmbH, Waghäusel, Germany) maintained at 60°C ± 15°C. The sample flow rate in this line was maintained within the AIR6241 stipulated 25 slpm ± 2 slpm. The construction of the two systems was very similar and the sample lines from the splitter to the individual instruments were of similar length and inner diameter.
FIG. 1. Experimental setup used in the A-PRIDE 4 campaign.
2.2. Instrumentation
The primary instruments in the AIR6241 systems report nvPM number and mass-based emissions. The nvPM number was measured using an AVL Particle Counter (APC) Advanced. The APC includes a volatile particle remover (VPR) consisting of a two-stage dilution with a rotary diluter and a catalytic stripper, and an n-butanol-based condensation particle counter (CPC) TSI 3790E, which has a 50% cut-off diameter, D50, at 10 nm. The smaller D50 is different from the Particle Measurement Program (PMP) compliant APC with a required D50 of 23 nm intended for automotive emissions measurements (Giechaskiel et al. Citation2012). For nvPM mass measurements, two real-time, high-resolution instruments that satisfied the performance specifications were used—an Artium Laser Induced Incandescence LII-300 (LII; Snelling et al. Citation2005) and an AVL Micro Soot Sensor (MSS; Schindler et al. Citation2004). Both of these instruments measure nvPM by perturbing the emissions sample with near-infrared radiation (which is absorbed by both graphitic carbon and metals in the nvPM) and observing different physical responses. The LII-300 uses a laser-induced incandescence technique in which light absorbing particles are heated by a pulsed 1064 nm Nd: YAG laser to temperatures in the 2500–4500 K range. The resulting near blackbody radiation from these particles is detected by photomultipliers at two wavelength bands. The measured signals are converted to absolute intensities by calibration with a spectral radiance standard. The time-resolved particle temperature is determined from two-color pyrometry, and the temperature is coupled with the absolute intensity to obtain nvPM mass concentrations. In contrast, the MSS utilizes a photoacoustic method to quantify nvPM mass. Light-absorbing aerosol particles are briefly heated by a continuous wave laser operated at 808 ± 5 nm and cycled on and off at 4 kHz. This rapid heating creates a pressure wave in the air surrounding each heated particle, which is detected by a highly sensitive microphone calibrated for black carbon mass concentration in the sample stream. Both the LII and MSS have a limit of detection of ∼1 µg/m3. The results from the LII-300 on the Empa system are not reported since the instrument was damaged in transit. The CO2 concentrations in the diluted nvPM lines were measured using a LiCor 840A and Thermo Scientific 410i NDIR detectors on the Missouri S&T and Empa systems, respectively.
Additional ancillary instruments that are not prescribed by AIR6241 were deployed to further characterize the physical and chemical properties of the nvPM emissions. Particle size distributions were measured using the Cambustion DMS500 (Reavell et al. Citation2002). A compact time of flight aerosol mass spectrometer (CToF-AMS) (Drewnick et al. Citation2005) and a high resolution time of flight aerosol mass spectrometer (HRToF-AMS; DeCarlo et al. Citation2006) were used to evaluate semi-volatile PM emissions. Tandem mass-mobility measurements using a differential mobility analyzer (DMA; TSI 3081A), a centrifugal particle mass analyzer (CPMA; Cambustion), and a CPC (TSI 3776) in series were taken to determine particle effective density and the mass-mobility exponent (Olfert and Collings Citation2005). Two multi angle absorption photometers (MAAP) were also used in the campaign, but the data from these instruments are not reported since they were not able to be referenced to the mass instrument calibration protocol.
The Annex 16 line on the Empa system was used for the measurement of undiluted gaseous emissions (). A Horiba PG-250 gas analyzer measured NOx, CO, and CO2 downstream of a cooler. A flame ionization detector (FID) Horiba MEXA-1170HFID measured UHCs (carbon equivalent). The Missouri S&T system did not have any gaseous emissions measurement instruments on the Annex 16 line. A mass flow controller and a pump on this line were used to match the flow rate of the Empa system Annex 16 line.
2.3. Engine Test Details
The Missouri S&T and Empa systems were compared and their performance was evaluated during a series of dedicated engine tests with a CFM56-5B4/2P aircraft engine and also during routine testing after an engine maintenance cycle at SR Technics with CFM56-7B24/3 and PW4168A engines. A summary of the engine tests conducted during the A-PRIDE 4 campaign is presented in , along with the ambient conditions recorded for each test period.
TABLE 1 Summary of the engine tests conducted during the A-PRIDE 4 campaign
The dedicated engine CFM56-5B4/2P, designed for Airbus A320 aircraft, had a dual annular combustor (DAC) with two fuel injection systems, a rich pilot zone optimized for altitude relight, low UHC and CO emissions at idle, and the lean main stage optimized for low NOx and PM emissions at high power (Lieuwen and Yang Citation2013). Emissions of nvPM from this engine type increase with thrust up to a point when the main stage starts to be fueled (∼30% of rated thrust). After the main stage is engaged, the equivalence ratio decreases and the PM mass emissions decrease to detection limit of the current instrumentation (Crayford et al. Citation2012). Emissions characteristics of the DAC engines are not representative of the emissions from the prevailing single annular combustor (SAC) engines with a single fuel injection system, which reach maximum PM emissions at high thrust settings.
The operating condition set points during the dedicated engine tests were selected to optimize the range of PM emissions levels over which the comparisons between the two systems could be accomplished. The designation for the four chosen set points was: Low PM, Med PM, High PM, and Lean Low PM. The repeatability of the four set points was achieved using the combustor inlet temperature (T3), with a defined temperature assigned to each of the points. The engine operators were able to achieve the set points to within 2°C. presents a typical cycle for a dedicated engine test with the CFM56-5B4/2P engine. In addition to these four set points, data were also acquired during a performance run where the engine was cycled through a series of operating conditions from ground idle to take-off. For the maintenance engine testing, a range of engine thrust conditions from idle to take-off was achieved depending on the engine being tested.
FIG. 2. Typical dedicated engine test cycle (15 November 2012).
2.4. Test Fuel Properties
A single delivery of Jet A-1 fuel provided by SR Technics was used during all engine tests of the campaign. A test fuel sample was collected and analyzed for various fuel properties () and consistency with specifications for the fuel to be used for emissions certification in ICAO Annex 16 (ICAO Citation2008). The test fuel met all the specifications with the exception of the naphthalenes content, which was below the lower limit requirement.
TABLE 2 Properties of the jet fuelFootnote used during the campaign
2.5. Data Processing and Analysis
Data from all the measurement instrumentation was acquired in real-time, which was subsequently averaged over a stable engine operating condition. The nvPM number and mass concentrations were converted to their respective emission indices to calculate the emissions per kilogram of fuel burned using the equations specified in AIR6241. The calculation for number-based emission index (EIn) is provided in EquationEquation (1)[1] , while that for mass-based emission index (EIm) is provided in EquationEquation (2)
[2] . These equations assume that all of the carbon in the fuel is converted into CO2, which is reasonable since combustion efficiencies of modern aircraft engines are above 98%.
[1]
[2]
PMn is the measured PM number concentration (particles/cm3) corrected for secondary dilution in the APC, while PMm is the mass concentration (mg/m3). Tn and Pn, and Tm and Pm are the absolute temperature and pressure at which the measurements were made, for nvPM number and mass, respectively. [CO2] is the concentration of CO2 (volume mixing ratio), MC and MH are the molar masses of carbon and hydrogen, respectively, and α is the hydrogen-to-carbon ratio of the fuel (1.91, based on analysis of fuel used during the study). The nvPM number- and mass-based emission indices are reported at AIR6241 standard temperature (273.15 K) and pressure (101.325 kPa) and were corrected for thermophoretic loss in the sample extraction system. No other corrections were applied to the datasets.
AIR6241 compliant nvPM sampling systems are subject to line losses due to the long sampling lines employed. Durdina et al. Citation(2014) have estimated PM mass correction factors for an entire AIR6241 compliant sampling system based on measured size and effective density distributions. However, a standardized methodology for accounting for nvPM sampling losses is currently still under development. The particle number losses due to diffusion in the sampling train at 15 nm and 50 nm were estimated to be ∼60% and ∼20%, respectively. Losses in the measurement instruments will also contribute to the overall loss. These losses are negligible for the mass instruments, whereas the losses in the APC VPR were experimentally determined by the manufacturer to be ∼60% at 15 nm and ∼30% at 50 nm. While total nvPM mass and number losses are important for an accurate assessment of emission impacts, only losses due to thermophoresis are taken into account here. Thermophoretic losses are expected to show the highest engine-to-engine variability since the sampling system and residence time are standardized according to AIR6241 (SAE Citation2013) and ICAO Annex 16 (ICAO Citation2008), respectively. Losses due to thermophoresis need to be considered since different engine sources were used in this study to compare the performance of the AIR6241 compliant systems. Also, future engine certification will likely require reporting of the nvPM number and mass emissions corrected for thermophoretic loss. Particle mass and number losses due to thermophoresis in the sample extraction system were calculated according to EquationEquation (3)[3] . This equation is specified in AIR6241 and is based on the thermophoretic parameterizations from Romay et al. Citation(1998) and Tsai et al. Citation(2004).
[3]
The sampling line wall temperature (TLine) in EquationEquation (3)[3] corresponded to 433.15 K and the exhaust gas temperature determined at the engine exit plane (TEGT, proprietary value) ranged from 600 K to 850 K, at minimum idle and maximum engine power conditions, respectively. The resulting thermophoretic loss correction factor ranged from 1.13 at minimum idle to 1.29 at take-off.
3. RESULTS AND DISCUSSION
3.1. Pre- and Post-Engine Test Instrument Comparisons
Prior to and following the aircraft engine emissions test, the nvPM number and mass instruments were compared using a Jing miniCAST 5201C soot generator as the emissions source. The miniCAST was operated at burner set point 1 (propane: 0.06 lpm, mixing gas N2: 0 lpm, oxidation air: 1.55 lpm, quench air N2: 7 lpm, dilution air: 20 lpm) to achieve a high elemental carbon (EC) fraction in the produced exhaust stream (∼0.78–0.9 according to thermal-optical analysis). The reference conditions for the mass flow controllers in the miniCAST were 1 atm and 20°C. The miniCAST exhaust had a geometric mean diameter (GMD) of ∼180 nm and a geometric standard deviation (GSD) of ∼1.6. The exhaust was diluted in a mixing tube with compressed air and the sample was passed through a perforated HEPA filter with an inserted capillary tube to achieve target mass concentrations of 250, 500, 750, and 1000 µg/m3. The diluted miniCAST exhaust sample was delivered through a Y-splitter to the Empa and Missouri S&T systems at the inlet to the PM1 cyclone (). The configuration downstream of the cyclone remained unchanged. Two comparison tests were performed prior to starting the sequence of engine tests and one immediately after all engine testing was complete.
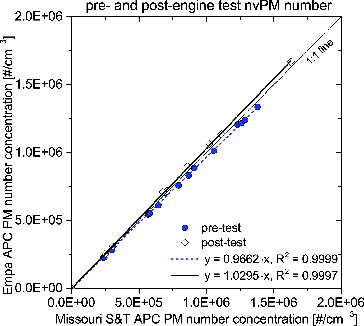
The results of the comparison tests between the APCs are presented in . The two nvPM number counting instruments during the pre- and post-engine test comparisons agreed within ±3%, with a very strong correlation. The average standard error of fit for the slope in the linear regressions shown below was 0.6% of the slope value.
FIG. 3. Pre- and post-engine test comparison of the nvPM number instruments using the miniCAST 5201C.
The AIR6241 methodology for measuring nvPM mass-based emissions states that the mass instruments must be calibrated to EC mass determined using a thermal-optical analysis method (NIOSH 5040 protocol; NIOSH Citation2003) prior to being used for aircraft engine exhaust measurements (SAE Citation2013). The NIOSH method has a stated accuracy of ±16.7% at a filter loading of 23 µg/m3 (NIOSH Citation2003). This is the lower limit of acceptable loading, and at recommended loading of ∼200 µg/m3, the accuracy is anticipated to improve but this has not been quantified. In the case of the mass instruments used, only the Missouri S&T LII was calibrated with the thermal-optical analysis method prior to the campaign. The first pre-engine test comparison was performed to compare the differences between the various mass measurement instruments as well as to develop a normalization factor to be applied to the mass instruments that were not calibrated to NIOSH 5040, i.e., the Missouri S&T and Empa MSS instruments. As can be seen in , before the normalization the MSSs registered ∼10% higher values, well correlated with the LII. After the normalization factor was applied to the MSSs, all the mass instruments were within ∼3% of each other (). The average standard error of fit for the slopes was 0.6% of the slope value.
FIG. 4. (a) Pre-engine test comparisons of the MSSs before and after normalization to LII; (b) post-engine test comparison of the MSSs.
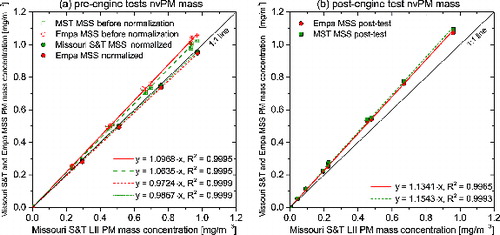
Following the engine tests, the mass instruments comparison experiment was repeated with no further adjustments to the instruments (the MSS instruments retained the normalization factor). presents the comparison of the MSSs with the LII. While the correlation is still high, the MSS concentrations were approximately 15% higher than those reported by the LII. However, for the range of nvPM mass-based emissions measured during the engine tests (<0.2 mg/m3), the instruments were in good agreement, <2% difference.
3.2. Dedicated and Maintenance Engine Tests
3.2.1. nvPM Number- and Mass-Based Emissions
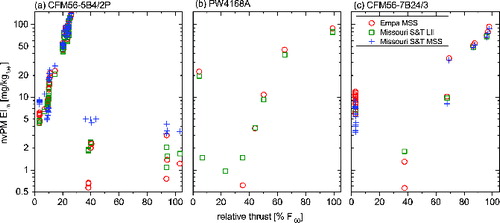
presents the nvPM number-based emissions profile and the nvPM mass-based emissions profile for the CFM56-5B4/2P, PW4168A, and CFM56-7B24/3 engine sources. The emissions profile for the CFM56-5B4/2P engine is distinctly different from the two other engines measured during this study as well as those reported for other aircraft engines (Lobo et al. Citation2007; Timko et al. Citation2010; Lobo et al. Citation2015). It can be seen that the CFM56-5B4/2P engine emits an order of magnitude less PM in terms of nvPM number and two orders of magnitude less in terms of nvPM mass at high thrust (take-off, climbout, and cruise settings) than the two other engine types measured. Although this engine type is discontinued, the newest low-emission lean burn combustors have emissions characteristics similar to the DAC engines when SN is taken as a surrogate for the nvPM (EASA Citation2015). It should be noted that the presented absolute values may not be fully representative, as they are based on a single point measurement in the engine exit plane; however, the data from individual instruments were highly repeatable: standard deviation of diluted CO2 measurements from the repeated test cycles from was on average 6%, whereas standard deviations of EIn and EIm were on average 7% and 25%, respectively. A negative correlation between the nvPM mass emissions and ambient temperature was observed; however, this effect was not observed for nvPM number emissions. Effects of ambient conditions on nvPM emissions need to be better understood for developing correction equations similar to those for gaseous emissions certification (ICAO Citation2008). Another source or variability arises from the hardware differences between individual systems.
FIG. 5. nvPM number-based emission index as a function of engine operating condition for the (a) CFM56-5B4/2P, (b) PW4168A, and (c) CFM56-7B24/3 engines.
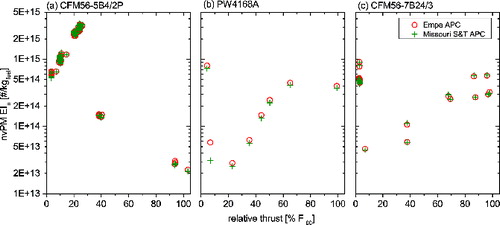
FIG. 6. nvPM mass-based emission index as a function of engine operating condition for the (a) CFM56-5B4/2P, (b) PW4168A, and (c) CFM56-7B24/3 engines.
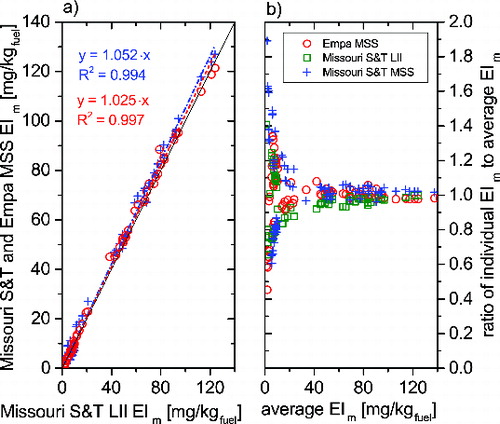
and present the comparison of the nvPM number- and mass-based emissions, respectively, between the two systems to assess their relative differences. An overall difference of 3% was observed for nvPM number-based emissions (). The overall differences in nvPM mass-based emissions reported by the MSS were within 5% of the Missouri S&T LII (). The data plotted in this manner do not allow an accurate assessment of the difference at very low emission indices. To accomplish this, average EIs were computed for both the mass and number emissions. The values obtained from each individual instrument were then compared against this average by computing a ratio of the individual emission index to the average. The resulting comparison plots are presented in and for nvPM number and mass, respectively, from all the engine tests. There was very good agreement in terms of nvPM number, with ±6% difference across the range of EIn values measured by the two systems. In the case of nvPM mass, differences between the individual instruments were high for emission indices below 20 mg/kg fuel burned, and then bound within ±15% from 20 to 140 mg/kg fuel burned. The differences between the various mass instruments at low EIm values can be attributed to the higher measurement uncertainties at low mass concentrations (<0.025 mg/m3) approaching the detection limits of the instruments (0.001 mg/m3). The nvPM number concentrations were well above the detection limits of the APCs. The typical concentrations recorded at the instruments during this study for PM number were 100 − 3×10⁵ particles/cm3, and for PM mass were 0.001–0.22 mg/m3. The measurement uncertainty based on error analysis (Dieck Citation2007) was calculated for both nvPM number- and mass-based emission indices. It was based on the root-sum-square method that took systematic and random errors (±10%) for the number and mass instruments into account along with uncertainties associated with temperature, pressure, CO2 concentration, and dilution factor measurements. The measurement uncertainty for nvPM number- and mass-based emissions was calculated to be ∼25%. This uncertainty is greater than the difference observed between these two systems.
FIG. 7. Comparison of the nvPM number-based emission index between the two systems.
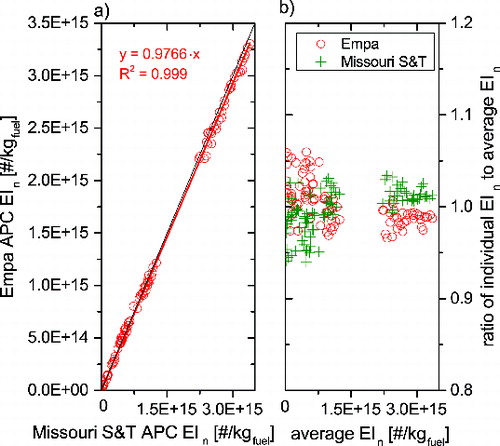
FIG. 8. Comparison of the nvPM mass-based emission index between the two systems.
3.2.2. PM Size Distributions
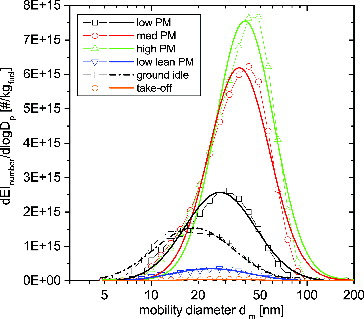
Typical PM size distributions as a function of engine operating conditions for the CFM56-5B4/2P engine () measured with the DMS500 are presented in . The measured data are presented with symbols and the curves are lognormal fits to the data. The size distributions varied with engine operating conditions. The GMD of the size distribution increased with engine thrust up to 30% in the pilot zone and then decreased in the lean burn stage. It should be noted that the DMS500 is not selective to only nvPM; however, the AIR6241 compliant sampling systems have been designed to suppress the formation of volatile PM by dry gas dilution and heating the sample to 60°C. Thus, the mono-modal size distributions represent the nvPM emissions measured by the AIR6241 compliant systems.
FIG. 9. Typical nvPM size distributions as a function of engine operating conditions for the CFM56-5B4/2P engine.
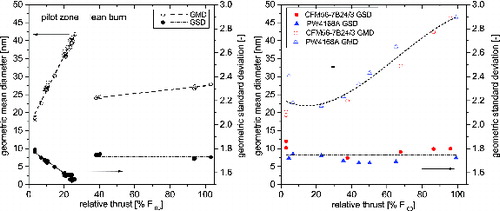
GMD and GSD as a function of engine thrust are presented in for the CFM56-5B4/2P engine and for the CFM56-7B24/3 and PW4168A engines. For the three engine types studied, GMD ranged between 20 nm and 45 nm, and GSD varied from 1.55 to 1.9, which is typical of modern aircraft engines (Lobo et al. Citation2007; Kinsey et al. Citation2010; Lobo et al. Citation2015).
FIG. 10. GMD and GSD as a function of engine operating conditions for (a) CFM56-5B4/2P engine and (b) CFM56-7B24/3 and PW4168A engines.
Petzold et al. Citation(2011) compared the PM number concentration obtained by integrating the DMS500 size distribution to that measured with a CPC and observed that they were well correlated. In this study, an average ∼45% higher total PM number concentrations were measured with the DMS500 than the dilution-corrected concentration measured by the APC. This is primarily due to the additional thermophoretic and diffusional losses in the VPR (∼40% penetration for 15 nm and ∼70% for 50 nm particles) and the CPC cut-off diameter of 10 nm.
3.2.3. PM Composition
The composition of PM in terms of semi-volatile organic content was investigated simultaneously with other measurements using a CToF-AMS (Missouri S&T line) and a HRToF-AMS (Empa line). The difference between the instruments can be attributed to the resolving power and sensitivity of the two mass spectrometers. To facilitate comparability of the two datasets, only standard AMS data in unit mass resolution for both instruments are reported. Furthermore, measurements performed exclusively in the mass spectrometric (MS) mode of operation during the dedicated engine test on 18 November 2012 were considered. Both instruments were able to sample for relatively long periods at each test point and a significant fraction of the data was above the detection limit (defined as three times of the standard deviation [3σ] of the measurements), enhancing the overall AMS data quality. Particles in the vacuum aerodynamic diameter range ∼60–600 nm are transmitted with a high efficiency into the AMS. The mass concentration data from each instrument were converted into an emission index using the same procedure used for nvPM number- and mass-based emissions. The reported emission factors are lower limits due to the decreasing transmission efficiency for the particles less than 60 nm. illustrates the comparison of the PM organic EI between the CToF-AMS and the HRToF-AMS. The range of PM organic emissions observed for this engine is similar in magnitude to that measured for other aircraft engines (Onasch et al. Citation2009; Timko et al. Citation2010).
FIG. 11. Comparison of the PM organic-based emission index measured by the CToF-AMS and HRToF-AMS for the CFM56-5B4/2P engine.
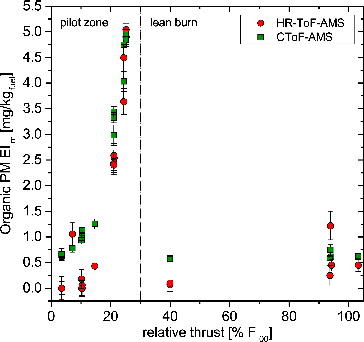
For PM organic EIs, good agreement was observed between the two instruments when organic mass concentrations were above the detection limit. This is a clear indication that the different measurement approaches with the HRToF-AMS and the CToF-AMS yield similar results. The overall fraction of PM organic content measured in the emissions from the CFM56-5B4/2P engine was small, on the order of ∼4% (lower limit).
3.2.4. PM Effective Density
The PM effective density in this study was determined using two techniques: the particle mobility-size dependent effective density was parameterized from mass-mobility measurements (DMA-CPMA), and a mean effective density was determined from the parallel DMS500-AMS measurements. Whereas the mobility-size dependent effective density can be used to directly convert mobility-size measurements to mass, the mean effective density cannot (DeCarlo et al. Citation2004) but is useful to directly compare the results presented here with those from other studies (Williams et al. Citation2012). The size-dependent effective densities from the dedicated engine test on 18 November 2012 were averaged over the test points—low PM, med PM, and high PM. Similar to other combustion sources, the PM effective density decreased with increasing particle size, indicating that the particles were aspherical (Maricq and Xu Citation2004). The size-dependent effective density distribution () was parameterized using the mass-mobility relationship (Park et al. Citation2003) with the standard error of the mean measured mass for fit weighting given by
FIG. 12. PM mass-mobility effective density distribution determined for the CFM56-5B4/2P engine.
The differences could be attributed to the different methods used, engine source variability, and the different ambient conditions between the studies. Also, an important aspect for effective density measurement is the sample conditioning. When measuring an undiluted sample, effective density can be higher because of volatile material condensed on soot (Johnson et al. Citation2015). This contribution is in general highest at engine idle conditions where the UHC emissions are highest. The DAC engine may be more sensitive to this effect in the operating range employed in this study because in the rich pilot zone operation it emits up to an order of magnitude more UHC than an SAC engine at the same thrust level. For the SAC engine, Durdina et al. (Citation2014) found no statistically significant difference between the effective densities measured on the diluted line and the undiluted line after a Nafion dryer at high thrust. Durdina et al. Citation(2014) also reported increasing effective density and mass-mobility exponent with engine thrust, which was not observed in this study because the data were collected over a narrow thrust range since there was no measurable PM in the lean burn engine operation at the high engine thrust conditions. The size-dependent effective densities reported here are in the range of the previously determined estimates independent of particle size (see references in Durdina et al. Citation2014).
The DMS500-AMS effective density for the CFM56-5B4/2P engine was determined for the two test points with the highest PM concentrations that yielded reliable particle size information in dva space. The calculated effective density values were 890 kg/m3 ± 20 kg/m3 and 970 kg/m3± 40 kg/m3 for the med PM and high PM test points, respectively. Since the AMS fundamentally measures mass, this effective density is compared with the volume-weighted mean of the mass-mobility effective density discussed above. The DMS500 particle size distribution data was converted to PM mass using EquationEquation (4)[4] and dividing by the equivalent particle volume to yield a volume-weighted mean density of 847 kg/m3 ± 7.2 kg/m3. Although the two effective densities are similar, only the mass-mobility effective density directly estimates PM mass from mobility-size measurements. Moreover, the size-resolved mass-mobility effective density parameterization (EquationEquation (4)
[4] ) provides superior accuracy, since each engine generates different PM size distributions that change with engine power conditions and thereby have different mean effective densities. The size-resolved parameterization provides the means for the most accurate estimation of PM mass losses in the sample line (Durdina et al. Citation2014). Since only two engine types have been characterized in terms of size-dependent effective density, more data is required to develop a robust parameterization applicable to a wide range of engine types.
4. CONCLUSIONS
The performance of two independently constructed—Missouri S&T and Empa—AIR6241 compliant systems was successfully compared during the A-PRIDE 4 campaign via dedicated engine testing on a CFM56-5B4/2P engine source and maintenance engine testing using CFM56-7B24/3 and PW4168A engine sources at a range of engine operating conditions. This study reports the first of a kind data on aircraft engine nvPM number- and mass-based emissions using standardized AIR6241 systems. Overall, these two compliant systems were found to be within 6% of each other in terms of nvPM number-based emissions and within 15% for nvPM mass-based emissions. System-to-system variability was low since both systems were constructed to the same requirements within the tolerances specified. This study successfully demonstrated that the systems built to the AIR6241 specifications are suitable for the measurement of aircraft engine nvPM emissions. However, for the three engine sources studied, at several engine power conditions the mass instruments approached their limit of detection, resulting in high measurement uncertainties. As with SN, for modern cleaner burning and fuel efficient engines, accurately measuring nvPM mass at certain engine power conditions will continue to be a challenge with current instrumentation. This will have to be taken into consideration by ICAO/CAEP when the regulatory limit for nvPM mass is defined. The nvPM number measurements were well above the instrument detection limits and are not expected to encounter the same issues as the mass measurements. The results of this study will contribute to the development of a certification document that details a normative standard sampling protocol and methodology for PM emissions characterization. It will also assist ICAO/CAEP to establish the regulatory limit for nvPM number- and mass-based emissions.
Ancillary instruments, which are not part of the prescribed standard methodology for nvPM emissions measurements, provided further characterization in terms of size, composition, and effective density. Particle GMD calculated from DMS500 measurements ranged between 20 nm and 45 nm and GSD varied from 1.55 to 1.9 for the three engine types studied. PM organic emissions observed for CFM56-5B4/2P engine were similar in magnitude to that measured for other aircraft engines. The overall fraction of PM organic content measured in the emissions from the CFM56-5B4/2P engine was small, on the order of ∼4% (lower limit). The size-dependent particle effective density was parameterized from mass-mobility measurements using the DMA-CPMA technique with a mass-mobility exponent of 2.57 and a pre-factor of 0.606. A robust parameterization of the effective density for the modern commercial fleet, both particle size-dependent and as a mean value, is essential for developing a standardized procedure for assessing nvPM mass losses in the standardized sampling systems. All these parameters together with nvPM number and mass provide the means to develop more accurate inventories of emissions from aviation operations that are essential to assessing the impact of aircraft engine nvPM emissions on air quality, health, and climate.
ACKNOWLEDGMENTS
The authors thank the test cell team at SR Technics for technical and logistical support during the campaign and Alice Suri (FOCA) for her assistance in merging the engine and emissions datasets. Any opinions, findings, and conclusions or recommendations expressed in this article are those of the authors and do not necessarily reflect the views of the sponsoring organizations.
Funding
This work was separately funded by the US Federal Aviation Administration (FAA), the Swiss Federal Office of Civil Aviation (FOCA), and Transport Canada (TC). FAA funding was provided through the Partnership for AiR Transportation for Noise and Emissions Reduction (PARTNER) – a FAA-NASA-Transport Canada-US DoD-US EPA-sponsored Center of Excellence under Grant No. 09-C-NE-MST Amendments 008 and 015 (Carl Ma, project manager). FOCA funding was provided through the project “Particulate Matter and Gas Phase Emission Measurement of Aircraft Engine Exhaust.” TC funding was provided through the Clean Transportation Initiative. In-kind cost contribution for this project was provided by the European Aviation Safety Agency.
REFERENCES
- Crayford, A., Johnson, M. P., Marsh, R., Sevcenco, Y., Walters, D., Williams, P., Petzold, A., Bowen, P., Wang, J., and Lister, D. (2012). Studying, Sampling and Measuring of Aircraft Particulate Emissions III - Specific Contract 02: SAMPLE III - SC.02. Taylor & Francis, Cologne, Germany.
- DeCarlo, P. F., Slowik, J. G., Worsnop, D. R., Davidovits, P., and Jimenez, J. L. (2004). Particle Morphology and Density Characterization by Combined Mobility and Aerodynamic Diameter Measurements. Part 1: Theory. Aerosol Sci. Technol., 38:1185–1205.
- DeCarlo, P. F., Kimmel, J. R., Trimborn, A., Northway, M. J., Jayne, J. T., Aiken, A. C., Gonin, M., Fuhrer, K., Horvath, T., Docherty, K. S., Worsnop, D. R., and Jimenez, J. L. (2006). Field-Deployable, High-Resolution, Time-of-Flight Aerosol Mass Spectrometer. Anal. Chem., 78:8281–8289.
- Dieck, R. H. (2007). Measurement Uncertainty: Methods and Applications. 4th ed. Taylor & Francis, Research Triangle Park, NC.
- Drewnick, F., Hings, S. S., DeCarlo, P., Jayne, J. T., Gonin, M., Fuhrer, K., Weimer, S., Jimenez, J. L., Demerjian, K. L., Borrmann, S., and Worsnop, D. R. (2005). A New Time-of-Flight Aerosol Mass Spectrometer (TOF-AMS) - Instrument Description and First Field Deployment. Aerosol Sci. Technol., 39:637–658.
- Durdina, L., Brem, B. T., Abegglen, M., Lobo, P., Rindlisbacher, T., Thomson, K. A., Smallwood, G. J., Hagen, D. E., Sierau, B., and Wang, J. (2014). Determination of PM Mass Emissions from an Aircraft Turbine Engine Using Particle Effective Density. Atmos. Environ., 99:500–507.
- (EASA) European Aviation Safety Agency. (2015). International Civil Aviation Organization Aircraft Engine Emissions DataBank. Taylor & Francis, Cologne, Germany. https://easa.europa.eu/document-library/icao-aircraft-engine-emissions-databank
- Giechaskiel, B., Mamakos, A., Andersson, J., Dilara, P., Martini, G., Schindler, W., and Bergmann, A. (2012). Measurement of Automotive Nonvolatile Particle Number Emissions within the European Legislative Framework: A Review. Aerosol Sci. Technol., 46:719–749.
- Herndon, S. C., Onasch, T. B., Frank, B. P., Marr, L. C., Jayne, J. T., Canagaratna, M. R., Grygas, J., Lanni, T., Anderson, B. E., Worsnop, D. R., and Miake–Lye, R. C. (2005). Particulate Emissions from in-use Commercial Aircraft. Aerosol Sci. Technol., 39:799–809.
- International Civil Aviation Organization. (2008). Environmental Protection: International Standards and Recommended Practices – Annex 16 to the Convention on International Civil Aviation, 3rd ed., Vol.II, Taylor & Francis, Montreal, QC, Canada.
- Johnson, T. J., Olfert, J. S., Symonds, J. P. R., Johnson, M., Rindlisbacher, T., Swanson, J. J.,. Boies, A. M., Thomson, K., Smallwood, G., Walters, D., Sevcenco, Y., Crayford, A., Dastanpour, R., Rogak, S. N., Durdina, L., Bahk, Y. K., Brem, B., and Wang, J. (2015). Effective Density and Mass-Mobility Exponent of Aircraft Turbine Particulate Matter. J. Propul. Power, 31:573–582.
- Kinsey, J. S., Dong, Y., Williams, D. C., and Logan, R. (2010). Physical Characterization of the Fine Particle Emissions from Commercial Aircraft Engines during the Aircraft Particle Emissions eXperiment (APEX) 1–3. Atmos. Environ., 44:2147–2156.
- Lee, D. S., Fahey, D. W., Forster, P. M., Newton, P. J., Wit, R. C. N., Lim, L. L., Owen, B., and Sausen, R. (2009). Aviation and Global Climate Change in the 21st Century. Atmos. Environ., 43:3520–3537.
- Lee, D. S., Pitari, G., Grewe, V., Gierens, K., Penner, J. E., Petzold, A., Prather, M. J., Schumann, U., Bais, A., Berntsen, T., Iachetti, D., Lim, L. L., and Sausen, R. (2010). Transport Impacts on Atmosphere and Climate: Aviation. Atmos. Environ., 44:4678–4734.
- Levy, J. I., Woody, M., Baek, B. H., Shankar, U., and Arunachalam, S. (2012). Current and Future Particulate-Matter-Related Mortality Risks in the United States from Aviation Emissions during Landing and Takeoff. Risk Anal., 32:237–249.
- Lieuwen, T. C., and Yang, V. (2013). Gas Turbine Emissions. Taylor & Francis, Cambridge, UK.
- Lobo, P., Hagen, D. E., Whitefield, P. D., and Alofs, D. J. (2007). Physical Characterization of Aerosol Emissions from a Commercial Gas Turbine Engine. J. Propul. Power, 23:919–929.
- Lobo, P., Hagen, D. E., Whitefield, P. D., and Raper, D. (2015). PM Emissions Measurements of In-Service Commercial Aircraft Engines during the Delta-Atlanta Hartsfield Study. Atmos. Environ., 104:237–245.
- Lobo, P., Rye, L., Williams, P. I., Christie, S., Uryga-Bugajska, I., Wilson, C. W., Hagen, D. E., Whitefield, P. D., Blakey, S., Coe, H., Raper, D., and Pourkashanian, M. (2012a). Impact of Alternative Fuels on Emissions Characteristics of a Gas Turbine Engine - Part 1: Gaseous and Particulate Matter Emissions. Environ. Sci. Technol., 46:10805–10811.
- Lobo, P., Hagen, D. E., and Whitefield, P. D. (2012b). Measurement and Analysis of Aircraft Engine PM Emissions Downwind of an Active Runway at the Oakland International Airport. Atmos. Environ., 61:114–123.
- Maricq, M. M., and Xu, N. (2004). The Effective Density and Fractal Dimension of Soot Particles from Premixed Flames and Motor Vehicle Exhaust. J. Aerosol Sci., 35:1251–1274.
- Mazaheri, M., Johnson, G. R., and Morawska, L. (2009). Particle and Gaseous Emissions from Commercial Aircraft at Each Stage of the Landing and Takeoff Cycle. Environ. Sci. Technol., 43:441–446.
- Mazaheri, M., Johnson, G. R., and Morawska, L. (2011). An Inventory of Particle and Gaseous Emissions from Large Aircraft Thrust Engine Operations at an Airport. Atmos. Environ., 45:3500–3507.
- NIOSH. (2003). Method 5040 in the NIOSH Manual of Analytical Methods (NMAM): Elemental Carbon (Diesel Particulate). Taylor & Francis, Atlanta, GA.
- Olfert, J. S., and Collings, N. (2005). New Method for Particle Mass Classification—The Couette Centrifugal Particle Mass Analyzer. J. Aerosol Sci., 36:1338–1352.
- Onasch, T. B., Jayne, J. T., Herndon, S., Worsnop, D. R., Miake-Lye, R. C., Mortimer, I. P., and Anderson, B. E. (2009). Chemical Properties of Aircraft Engine Particulate Exhaust Emissions. J. Propul. Power, 25:1121–1137.
- Park, K., Cao, F., Kittelson, D. B., and McMurry, P. H. (2003). Relationship between Particle Mass and Mobility for Diesel Exhaust Particles. Environ. Sci. Technol., 37:577–583.
- Petzold, A., Marsh, R., Johnson, M., Miller, M., Sevcenco, Y., Delhaye, D.,. Ibrahim, A., Williams, P., Bauer, H., Crayford, A., Bachalo, W. D., and Raper, D. (2011). Evaluation of Methods for Measuring Particulate Matter Emissions from Gas Turbines. Environ. Sci. Technol., 45:3562–3568.
- Reavell, K., Hands, T., and Collings, N. (2002). A Fast Response Particulate Spectrometer for Combustion Aerosols. SAE Technical Paper, 2002-01-2714. Taylor & Francis, Warrendale, PA.
- Romay, F. J., Takagaki, S. S., Pui, D. Y. H., and Liu, B. Y. H. (1998). Thermophoretic Deposition of Aerosol Particles in Turbulent Pipe Flow. J. Aerosol Sci., 29:943–959.
- Rückerl, R., Schneider, A., Breitner, S., Cyrys, J., and Peters, A. (2011). Health Effects of Particulate Air Pollution: A Review of Epidemiological Evidence. Inhal. Toxicol., 23: 555–592.
- SAE Aerospace Information Report (AIR) 6241. (2013). Procedure for the Continuous Sampling and Measurement of Non-Volatile Particle Emissions from Aircraft Turbine Engines. Taylor & Francis, Warrendale, PA.
- Schindler, W., Haisch, C., Beck, H. A., Niessner, R., Jacob, E., and Rothe, D. (2004). A Photoacoustic Sensor System for Time Resolved Quantification of Diesel Soot Emissions. SAE Technical Paper, 2004-01-0968. Taylor & Francis, Warrendale, PA.
- Snelling, D. R., Smallwood, G. J., Liu, F., Gülder, Ö. L., and Bachalo, W. D. (2005). A Calibration-Independent Laser-Induced Incandescence Technique for Soot Measurement by Detecting Absolute Light Intensity. Applied Optics, 44:6773–6785.
- Timko, M. T., Onasch, T. B., Northway, M. J., Jayne, J. T., Canagaratna, M. R., Herndon, S. C., et al. (2010). Gas Turbine Engine Emissions—Part II: Chemical Properties of Particulate Matter. J. Eng. Gas Turbines Power, 132:061505.
- Tsai, C.-J., Lin, J.-S., Aggarwal, S. G., and Chen, D.-R. (2004). Thermophoretic Deposition of Particles in Laminar and Turbulent Tube Flows. Aerosol Sci. Technol., 38:131–139.
- Williams, P. I., Allan, J. D., Lobo, P., Coe, H., Christie, S., Wilson, C., Hagen, D., Whitefield, P., Raper, D., and Rye, L. (2012). Impact of Alternative Fuels on Emissions Characteristics of a Gas Turbine Engine - Part 2: Volatile and Semivolatile Particulate Matter Emissions. Environ. Sci. Technol., 46:10812–10819.