
Abstract
We describe a new open-path aerosol extinction cavity ringdown spectrometer (CRDS), which measures extinction coefficients as aerosol is drawn transversely through the optical cavity. With no inlet tubing, particle losses in the open-path CRDS due to impaction of coarse particles or evaporation of highly humidified particles in transfer lines are minimized, improving aerosol extinction measurements in dusty and humid environments. This report presents the key elements of the new open-path CRDS design as well as comparisons with a conventional closed-path CRDS and data obtained during a field study at NOAA's instrumented 300 m tower in Erie, Colorado. The open-path CRDS's 1σ detection limit for one second averaged data was 0.05 Mm−1, comparable to the limit of our closed-path CRDS.
Copyright 2015 American Association for Aerosol Research
1. INTRODUCTION
Aerosols, both natural (e.g., dust, sea salt, volcanic ash) and anthropogenic (e.g., particulate matter from fossil fuel combustion), profoundly perturb the earth's climate through direct effects (scattering or absorbing solar radiation) and indirectly by modifying cloud properties (Ramanathan et al. Citation2001). However, the uncertainty in aerosol radiative forcing is nearly as great as current best estimates of its magnitude, and the ability to frame effective climate change policies depends on reducing this uncertainty by a factor of 3 to 10 (Baynard et al. Citation2007; Solomon et al. Citation2007). Achieving this goal will require significant additional progress in measuring the scattering and absorption properties of aerosols, especially in regions that are difficult to characterize with existing instruments (e.g., in clouds and coarse particle-dominated regions).
Light scattering due to aerosols increases very rapidly at humidities above 90% (Covert et al. Citation1972), and while robust measurements of humidified scattering have been made with wet nephelometers at relative humidities of up to 85% (Zieger et al. Citation2011), measuring scattering at higher relative humidity (RH) has proven technically challenging (Heintzenberg et al. Citation2006; Howell et al. Citation2006). Cavity ringdown spectrometers (CRDSs) have been used to quantify aerosol extinction (= scattering + absorption). CRDS has been employed in humidities up to RH ≈ 90% (Michel Flores et al. Citation2012), but at very high humidities (as found in and near clouds), however, existing CRDSs perform poorly, diverging significantly from theoretically predicted extinction coefficients. For example, note the uncertainty bounds in figure 4 of Langridge et al. (Citation2011). It is difficult to maintain humidities greater than 90–95% without condensation or significant loss of larger particles. Furthermore, Koren et al. showed that humidity may be enhanced for tens of kilometers around clouds, and 30–60% of the global area currently considered cloud-free may in fact include regions of high humidity. Since most satellite retrievals tend to be biased toward data that is far from clouds, some fraction of these “twilight zones” may not be included in existing satellite retrievals, which may degrade the accuracy of aerosol direct forcing estimates (Yu et al. Citation2006; Koren et al. Citation2007).
In situ measurements of aerosol extinction obtained during atmospheric profiles could help constrain ground- and satellite-derived aerosol optical depth (AOD) retrievals, and the need for such calibration points is acute not only in and near clouds but also in regions with high coarse dust burdens (e.g., continental-scale regions downwind of north African dust plumes [Deuzé et al. Citation1999]). Such regions constitute an additional, important source of uncertainty in estimates of radiative effects. While broad patterns are discernible from satellite data, more detailed extinction data are needed to constrain the satellite observations, as existing in situ data have been plagued with a range of problems. For example, in previous field efforts, sample inlet cutoff sizes were often too small and particle losses in inlet tubing were too high for existing instruments to provide robust data; thus, it is unclear whether the very different descriptions of the optical properties of the coarse mode that were reported are due to instrumental artifacts or due to true differences in the dust events (Ryder et al. Citation2013). For these reasons, there is a need for an instrument capable of making in situ aerosol extinction measurements in dusty and humid environments. The instrument design described in this report could be adapted for airborne deployment, where it could be used to validate remote measurements of AOD.
1.1. Cavity Ringdown Spectroscopy
Cavity ringdown spectroscopy (CRDS) is a highly sensitive in situ technique for measuring the extinction of light due to trace concentrations of gas and/or aerosol species. We refer the reader to any of a number of reviews in the literature (Berden and Engeln Citation2009; Gagliardi and Loock Citation2014) for a detailed treatment of the technique and provide here only a cursory sketch in order to contextualize our contribution to the field.
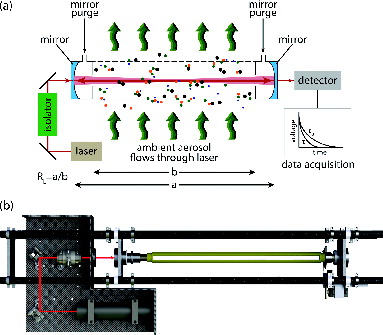
In continuous-wave CRDS a laser beam is directed into a high finesse optical cavity, the beam is switched off, and the decay of the light intensity is recorded as a fraction of the light reflecting in the cavity is transmitted through the back mirror of the optical cavity to a photomultiplier tube (PMT). If some fraction of the beam is absorbed or scattered by gas molecules and/or particles in the optical cavity, the light transmission decreases more rapidly. The aerosol extinction coefficient α is a function of the exponential decay time with and without particles in the cavity (τ and τ0, respectively) and is expressed by[1]
where c is the speed of light and RL is the ratio of the cavity length, a, to the sample length, b (see ).
FIG. 1. Depiction of the OPCRDS design: (a) schematic, and (b) photorealistically rendered CAD model.
Numerous studies have employed CRDS in quantifying aerosol extinction since this technique was introduced in 2001 by Smith and Atkinson (Smith and Atkinson Citation2001). However, to our knowledge there are no published reports addressing the challenges involved in measuring aerosol extinction coefficients with a CRDS under either high coarse particle loadings or in saturated conditions. Langridge et al. (Langridge et al. Citation2011) show that their CRDS agrees closely with theoretical extinction coefficients for RH <90%, but the agreement reduces substantially above that, limiting this instrument's ability to characterize extinction in the twilight zones around clouds.
Here we report the application of CRDS in an open-path configuration (OPCRDS) and demonstrate its utility in characterizing aerosol extinction in high humidity conditions. In subsequent sections we describe the details of the instrument design; compare the stability, precision, and detection limit with a conventional, closed-path CRDS; compare the measurement-derived Rayleigh scattering cross-sections of pure CO2 and He with the theoretical values; and present data from the OPCRDS's initial deployment during the summer 2014 FRAPPE field campaign in Erie, Colorado.
2. INSTRUMENT DESCRIPTION
One approach to characterizing the extinction of highly humidified and/or coarse aerosol is to allow aerosol to flow freely through the optical cavity without an inlet or tubing at all as is done in differential optical absorption spectrometry (DOAS). In contrast to DOAS, however, an open-path CRDS avoids the confounding effect of possible concentration gradients between the DOAS light source and its distant target; a more localized (and therefore well-defined) sample is analyzed in OPCRDS compared to DOAS. Another important advantage of the OPCRDS compared to DOAS (or lidar techniques) is that background signal can be easily minimized by zeroing the instrument. OPCRDS has been used (rarely) to characterize ambient trace gas concentrations (Wada et al. Citation2007). Wada et al. (Citation2007) report, however, that their instrument's performance was degraded by turbulence in the optical cavity due to wind gusts. In addition, a more robust OPCRDS was recently deployed by He et al. (Citation2014) for measuring ammonia; this system used a near-IR diode laser operated in a swept frequency mode. The CRDS we describe was designed to isolate the optical cavity from wind and rain while still providing an open path for the aerosol through the optical cavity.
2.1. Optical System
A multi-mode continuous-wave diode laser (Power Technology, Little Rock, AR, USA) centered at 674.22 nm was chosen to minimize interference in the aerosol extinction signal due to absorption from common atmospheric constituents. Water, in particular, has a local minimum in its absorption at 674 nm. At this wavelength the sum of the absorption due to water (at 21°C dewpoint), O3 (100 ppb), and NO2 (8 ppb) is less than 0.75 Mm−1.
The key features of the OPCRDS are shown in . After passing through a Faraday isolator (model IO-5-670-VLP, Thorlabs, Newton, NJ, USA) to eliminate laser feedback from back reflections, the beam is coupled directly into the optical cavity with no mode-matching optics. The optical cavity utilizes two concave dielectric mirrors with a 1-m radius of curvature. The custom dielectric coating on the mirrors (Advanced Thin Films, Boulder, CO, USA) was optimized for maximum reflectivity (≥99.999%) at the laser wavelength.
A fiber collimator located behind the output mirror collects light escaping the cavity through the far mirror and focuses it into a fiber optic cable. The cable transmits light to a photomultiplier module (HC120-05-MOD, Hamamatsu, Hamamatsu City, Shizuoka Pref., Japan), which is protected from ambient light by a narrow bandpass (10 nm full width at half maximum) filter centered at 676 nm (Edmund Optics, Barrington, NJ, USA).
2.2. Flow System
2.2.1. Purge Flow
While measuring ambient extinction coefficients, filtered (99.99% at 0.01 μm, Balston BQ, Haverhill, MA, USA) ultrazero air (Scott-Marin, Riverside, CA, USA), regulated at 0.1 L min−1 by a mass flow controller (Alicat MC-1SLPM-D-24V, Tucson, AZ, USA), flows continuously in front of each mirror to prevent contamination of the highly reflective surfaces. As with some closed-path CRDS, this purge air flows from the mirror chamber directly into the laser cell (a). Thus, in closed-path CRDS, the purge flow is typically included in the extinction calculation in two ways: (1) the purge flow reduces the fraction of the laser beam's path that is exposed to aerosol, and (2) the purge flow slightly dilutes the aerosol concentration in the laser cell. For example, in the instrument described by Langridge et al. (Langridge et al. Citation2011) the purge flow (0.01 L min−1) is about 1% of the total flow through each cell. Although the OPCRDS purge flow is an order of magnitude greater than the closed-path CRDS purge flow, it constitutes only 0.06% of the flow through the cell; therefore, no corrections are made for the dilution of the ambient aerosol concentration in the OPCRDS. The purge flow does reduce the path length exposed to aerosol, and this effect is included in the OPCRDS extinction coefficient calculation (RL, Equation (1)).
2.2.2. Air Intake and Instrument Zeroing
The optical cell is housed in a custom-built aluminum duct of rectangular cross-section (0.364 m × 0.040 m × 0.51 m high). Nine 12 VDC axial fans rated at 170 L min−1 each positioned at the upper end of the duct draw ambient air from the open bottom end of the duct through the vertically oriented slot (0.0089 m × 0.3493 m) in the housing of the optical cell when the OPCRDS is in the sampling mode. A 0.057-m long flow straightener (aluminum honeycomb with 0.064 m cells) is installed at the bottom entrance of the duct to reduce turbulence in the measurement cell. The particle-free ringdown τ0 is measured by (1) covering this slot so that the optical cell is isolated from ambient air flow (2) turning off the nine 12 VDC axial fans and (3) increasing the purge flow rate to 0.8 L min−1. The positive particle-free air pressure thus induced in the small (∼0.1 L) optical cell purges the particles within 1 min. Valid τ0 are then recorded during the second minute of the 2-min zeroing cycle.
RH is measured using a thermo-hygrometer (HMP110, Vaisala, Vantaa, Finland) placed in the duct ∼0.25 m above the optical cell. The manufacturer's stated accuracy for the hygrometer is ±1.5% for 0% ≤ RH ≤ 90% and ±2.5% for RH >90%. The hygrometer was calibrated in our laboratory at 22°C using saturated salt solutions (covering the RH range from 32.9% to 97.4%). A hot wire anemometer, positioned at approximately the same height above the optical cell as the hygrometer, measures air velocity.
2.3. Data Acquisition
The open path cavity ringdown data acquisition system is built around a National Instruments (Austin, TX, USA) single board computer (sbRIO-9636). The sbRIO consists of a 400 MHz processor hosting a real-time operating system and a field programmable gate array (FPGA, Xilinx Sparan-6 LX45, San Jose, CA, USA). A custom circuit board distributes the IO for instrument control and data acquisition while another circuit board provides all required DC voltages to the system. Low-frequency signals are generated and acquired through the analog and digital IO channels on the sbRIO. Because exponential decay times are 10–200 μs, digitization of the PMT signal requires significantly more bandwidth (∼2 MHz) than that provided by the built in analog inputs. Thus, a custom circuit board containing a high-speed digitizer (LTC2203, Linear Technology, Milpitas, CA, USA) was used. It can acquire a 16-bit analog input signal at up to 25 × 106 samples s−1. The acquired PMT signal is synchronized with the laser (typically operated at 1 kHz)—when the laser is switched off, the sbRIO begins to acquire data from the PMT. The signal is acquired for a user-defined period generally not exceeding half of the time between pulses (500 μs for a 1 kHz laser repetition rate). The acquired signal is averaged over 1 s and then each individual ringdown is processed as in Langridge et al. (Citation2011). When necessary, individual traces were co-added to reduce the load on the small processor. All signals are aggregated, analyzed, and written to file and displayed at 1 Hz.
2.4. Mechanical System
During measurements of the particle-free ringdown time a hollow cylindrical cover concentric with the housing of the optical cell is rotated 90 degrees by a computer-controlled servo motor and linkage such that the vertically oriented slot in the housing is covered, thereby isolating the optical cell from ambient aerosol. The cavity is then overflowed with dry zero air. The cover is automatically closed for 2 min every 20 min and then opened again for ambient sampling.
The optics, duct, control electronics, and data acquisition system were protected from exposure to the weather on all sides by a custom white polycarbonate enclosure. The duct protruded slightly through a cutout in the bottom of the enclosure to admit ambient air.
3. INSTRUMENT PERFORMANCE
3.1. Stability, Precision, and Detection Limit
Due to random variations in the extinction coefficient measured with particle-free ultrazero air, a more precise estimate of the extinction coefficient may be achieved by averaging a number of ringdowns from the OPCRDS's 1 kHz laser shots. However, this increase in precision is counterbalanced by longer timescale drifts in extinction due to minor fluctuations in temperature, pressure, and other parameters that affect the instrument's stability (e.g., minute changes to mirror alignment and laser emission with temperature). In general, if a set of measurements is divided into N subsets and the individual measurements in each subset are averaged together, the sum of the squared differences between adjacent subsets is indicative of the variability of the data. Formally, the two-sample variance (aka Allan variance) between adjacent subsets of measurements, yp (p = 1 to N), has been defined as
where t is the averaging period. The Allan deviation σ is the square root of the Allan variance.
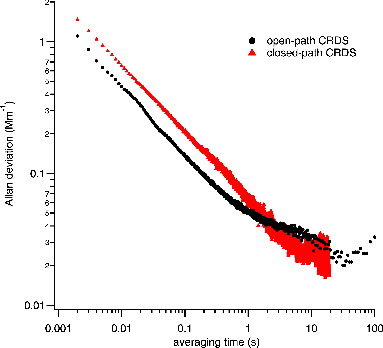
Instrument detection limits are commonly defined in terms of the standard deviation of the mean (e.g., 1σs or 3σs), but for white-noise dominated systems the Allan deviation is equivalent to the standard deviation of the mean (Werle et al. Citation1993). Therefore, the 1σ detection limit may be estimated by calculating the Allan deviation. compares the Allan deviation of the OPCRDS with a conventional, closed-path CRDS (Langridge et al. Citation2011). For both instruments, the Allan deviation decreases with increasing averaging time (i.e., decreasing N). The stability of the two instruments is similar, and the plots indicate that the OPCRDS's detection limit can be improved by averaging individual ringdowns for as much as 20–30 s. For longer averaging periods, systematic instrumental drift, rather than random shot-to-shot variation, dominates and the deviation increases.
FIG. 2. Allan deviation of extinction coefficient in zero air for the OPCRDS and conventional closed-path CRDS. Both systems are stable (minimum deviation) and converge to similar minimum detection limits when ringdowns are averaged for up to 20 s. The closed-path CRDS trace (red triangles) is from Langridge et al. (Citation2011).
The standard deviations of ringdown times measured in ambient air with particles (from different air masses) by the OPCRDS and by the conventional closed-path CRDS (Langridge et al. Citation2011) are plotted as a function of averaging time (a). As noted by Langridge et al. the precision of the closed-path CRDS does not change much for averaging times <1 s because with 0.001 s between laser shots and a 2-s aerosol residence time in the laser cell, successive ringdown measurements are correlated (i.e., some of the same particles are in the beam during multiple laser shots). For averaging times >1 s, the improvement in precision for the closed-path CRDS follows the slope for a Poisson process, which scales with the reciprocal of the square root of averaging time.
FIG. 3. (a) Measured standard deviation of ringdown time in ambient air for the OPCRDS and conventional closed-path CRDS as a function of signal averaging time. Modeled standard deviation of ringdown time for the (b) closed-path CRDS and (c) OPCRDS. The standard deviation and the relative magnitude (insets) of the three simulated noise sources are also shown in (b) and (c). Laser firing rate in measured and modeled signals is 1 kHz. The (red) closed-path CRDS trace in (a) is from Langridge et al. (Citation2011).
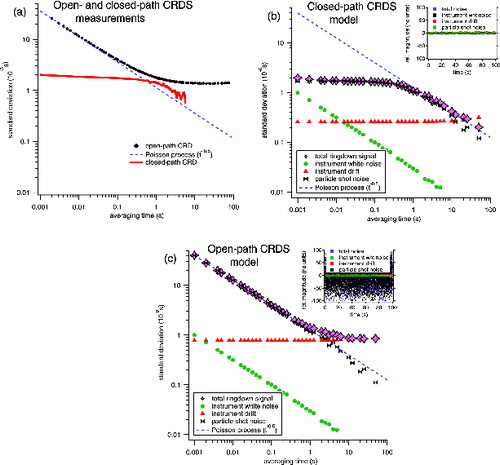
In contrast to the conventional CRDS, aerosol in the OPCRDS travels perpendicular to the beam (∼1 mm beam diameter at the entrance mirror, see ) at 1.75 m s–1 (estimated by dividing the rated volumetric air flow rate of the fans by the cross-sectional area of the duct), ensuring an extremely rapid turnover in particle populations intersecting the laser beam. As a result, the improvement in precision with the OPCRDS closely approximates a Poisson process until leveling off for averaging times >1 s ((black) filled circles in a), presumably due to instrument drift. Ultimately, the precision of the two instruments is very similar when individual ringdowns are averaged for 1 s; however, for short averaging times the closed-path CRDS appears to outperform the OPCRDS by providing a more precise extinction coefficient estimate. We hypothesized that the lower standard deviation of the closed-path CRDS when averaged over shorter periods is due to the lower turnover in particle populations intersecting the beam (correlated taus) during multiple laser shots rather than an ability to more precisely characterize a given aerosol population. We tested this hypothesis by building a simple model that linearly combines three different sources of noise in the CRDSs.
The standard deviation and the relative magnitude (insets) of the three simulated noise sources are shown in b and c for the closed- and open-path CRDSs, respectively. First, white noise in both instruments was modeled by random values from a Gaussian distribution whose standard deviation (for an infinite number of values) was 1 μs. The (green) filled circles in b and c show that white noise decreases with averaging time as t−0.5 as predicted for a Poisson process. Second, particle shot noise (denoted by (black) bowtie markers) in both instruments (assumed to be much larger than instrument white noise) was modeled by a second set of Gaussian values (uncorrelated with the white noise) with a standard deviation of 39.99 μs. The correlation in ringdowns between successive laser shots in the closed-path CRDS was modeled by applying a 500-point moving average (derived based on a 0.5 s residence time for particles sampled at the 1 kHz laser firing rate) smoothing algorithm to the particle shot noise values. The OPCRDS shot noise was not smoothed. Smoothing produces a much tighter distribution of noise magnitudes in the closed-path CRDS model (inset of b) compared to the OPCRDS (inset of c). The third noise source was a 9 (27)-ppm positive linear drift imposed in the closed-path (open-path) model. A greater drift for the OPCRDS was assumed because the slope of the OPCRDS's Allan deviation () is reduced (i.e., flattens somewhat) for t > 0.5 s and actually increases for t > 20 s, whereas the Allan deviation for the closed-path CRDS decreases at a more constant rate. b and c illustrate the expectation that for short to medium duration averaging periods, white noise and instrument noise dominate over drift. The values for the standard deviations of the white noise and particle shot noise (1 μs and 39.99 μs) non-uniquely satisfy the constraints that: (1) the sum of the unaveraged (0.001 s averaging period)variances (not the standard deviations) equals the measured variance of the OPCRDS (i.e., 12 μs + 39.992 μs ≈ 402 μs, the extrapolated y-intercept of the OPCRDS trace in a), and (2) the sum of the unaveraged variances of the white noise and smoothed particle noise equals the measured variance of the closed-path CRDS (i.e., 12 μs + 1.732 μs ≈ 22 μs, the leftmost point of the closed-path CRDS trace in a).
The modeled total ringdown signals ((pink) diamonds in b and c) qualitatively reproduce the measured signals for both the closed- and open-path CRDSs in a. This model-measurement correlation suggests that particle shot noise limits the precision of both the closed- and open-path CRDSs and that the longer particle residence time in the closed-path CRDS leads to correlated taus and relatively little improvement in precision as a function of averaging time until about 1 s. Furthermore, although the closed-path CRDS appears to provide a more precise measurement relative to the OPCRDS for short averaging times (i.e., the standard deviation of the closed-path CRDS signal is lower), this interpretation is misleading; while the measurement of the closed-path CRDS is indeed more precise, this is likely an artifact of the closed-path CRDS's inability to sample unique particle populations at 1 kHz. If the same sample is measured multiple times (as in the closed-path CRDS), it follows that the standard deviation will be lower than when independent samples are measured (as in the OPCRDS).
3.2. Sources of Uncertainty and Comparison of Open- and Closed-Path CRDSs
The dominant source of uncertainty in the reported extinction coefficients is the uncertainty in the length of the aerosol sample in the cavity. This length was not verified experimentally or through simulation. Given the geometric constraints of the cavity design, the value of 1.033 chosen for RL (the ratio of the cavity length to the aerosol sample length) is expected to be a lower limit. If the purge volume is 50% greater (RL = 1.050), the extinction coefficients reported here would be 1.7% lower than the true values.
Theoretically, the production of multi-exponential rather than single exponential ringdowns is capable of introducing uncertainty in the extinction coefficients; however, in practice such effects appear to be insignificant, even when multi-mode lasers are used (as with the OPCRDS; Langridge et al. Citation2011). Frequent zeroing ensures that fluctuations in ambient pressure and temperature, which change the Rayleigh scattering and the mirror alignment, are accounted for.
Measurements of ambient (outdoor) aerosol by the co-located, open-, and closed-path CRDSs plotted in show excellent agreement between the two instruments. The data (n = 17741) in were recorded during the period between 7 March 2015 and 6 April 2015. The closed-path CRDS was operated under dry conditions (RH <10%). Since hygroscopic effects become important at higher relative humidities, leading to divergence between the dry and ambient extinction coefficients, only time periods when the ambient RH was less than 50% were included in the comparison.
FIG. 4. Comparison of the aerosol extinction coefficients (1-min averages) measured by the open- and closed-path CRDSs.
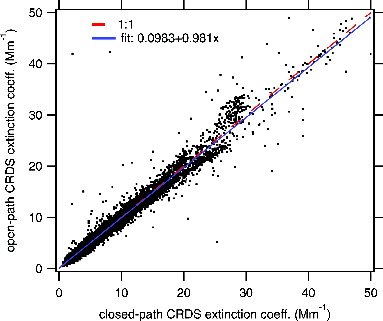
Overall, agreement between the two instruments is excellent. The scatter plot indicates that extinction coefficients from the OPCRDS are ∼2% lower than those from the closed-path CRDS. If the actual purge volume of the OPCRDS is (up to 50%) larger than the value we have assumed (as discussed above in this section), RL would also be larger and the agreement between the OPCRDS and the closed-path CRDS would be even closer.
While the relative uncertainty in extinction coefficients due to RL is constant (+1.7% as per the earlier discussion in this section), the relative uncertainty due to trace gas interference depends on both the trace gas mixing ratio and the magnitude of the measured extinction. Accounting for absorption due to water (up to 21°C dewpoint), O3 (20–100 ppb), and NO2 (2–8 ppb) would reduce the measured extinction coefficient by 8–25% in very clean conditions (3 Mm−1 aerosol extinction coefficient) and 1–2% in moderately polluted conditions (50 Mm−1).
3.3. Calculation of Rayleigh Scattering Cross-Section
CRDS provides an absolute measurement of the aerosol extinction coefficient requiring no calibration; the data depend only on the accuracy of τ, τ0, and RL. Nevertheless, in developing a new CRDS it is useful to compare the measured extinction coefficient for a pure substance with the extinction coefficient predicted from theory. In this section, we describe how the measured ringdown for ultrapure zero air was used to calculate the reflectivity of the mirrors in the OPCRDS. Then the reflectivity is used to calculate the expected ringdown time for He and CO2, and these values are compared to the values measured by the OPCRDS for these gases.
The classic equation for Rayleigh scattering cross-section is presented in many texts (e.g., Bodhaine et al. (Citation1999)) as[2]
where σ is the molecular scattering cross-section, λ is the wavelength of incident radiation, n is the refractive index of air, N is the molecular density, is the depolarization term (aka “King factor”), and ρ is the depolarization factor (which quantifies molecular anisotropy effects). Fair for dry air containing a concentration of CO2 equal to
(in volume percent, e.g., 0.045 for 450 ppm) is given by
where and
are given in equations (5) and (6) of Bodhaine et al. (Citation1999):
The refractive index for air n(λ, T, P, RH), needed to solve Equation (2), was calculated using NIST's online calculator (Stone and Zimmerman Citation2004), which is based on a modified version of the Edlen equation (Birch and Downs Citation1993). This calculator assumes a CO2 concentration of 450 ppm, which introduces negligible error since the depolarization term is only a very weak function of CO2 concentration. Substituting n and Fair into Equation (2), the calculated cross-section for air was 1.96696 × 10⁻²⁷ cm2 molecule−1 at 850 mb and 296.15 K. The mirror reflectivity was then calculated using
where L is the distance between the mirrors, τ0 is the ringdown time (calculated from the average value of 600,000 individual ringdowns), c is the speed of light, σ is the molecular scattering cross-section (calculated from Equation (2)), and N is molecular density. At 23°C, 20% RH, and 850 mb, the mean ringdown time for ultrapure zero air was 181.685 μs, and the calculated reflectivity was 0.99999389, which is slightly higher than the manufacturer's specification of 0.99999.
The predicted ringdown times for He and CO2 were calculated using the equation
where R is the reflectivity derived from the zero air measurements. He and CO2 span a wide range of scattering efficiencies (predicted ringdown times with our instrument for He and CO2 were 232.6 and 134.5 μs, respectively), and the difference between measured and predicted ringdown times was –0.09% and 3.24% for He and CO2, respectively.
3.4. Initial Deployment during the FRAPPE Field Campaign
The OPCRDS and a 3-wavelength nephelometer (TSI 3563, TSI Inc., Shoreview, MN, USA) were installed on a remote-controlled equipment carriage (2 m × 3 m × 2 m steel enclosure) at the Boulder Atmospheric Observatory (BAO), a 300 m instrumented tower, during the July–August 2014 Front Range Air Pollution and Photochemistry Experiment (FRAPPE). These instruments profiled ambient extinction and scattering between ground level and 285 m above ground level (AGL). The nephelometer was mounted inside of the carriage, and a 2 m long × 0.025 m diameter aluminum tube extending 1 m outside the carriage served as the nephelometer inlet. The flow rate through the nephelometer was 30 L min−1. The inlet tubing was heated to 45°C by wrapping the aluminum tubing with heat tape connected to a PID temperature controller; while this reduced the RH of the aerosol entering the nephelometer, no direct control over the aerosol RH was maintained. During normal operation, the nephelometer was zeroed for 5 min every hour. The nephelometer was calibrated before and after FRAPPE using the facility and protocol developed for nephelometer measurements at NOAA's long-term baseline observatories (Anderson et al. Citation1996), and the average errors between the calibrations were statistically indistinguishable: 0.82% before and 1.05% after.
The OPCRDS was bolted to a custom steel frame on the outside of the carriage that extended ∼0.5 m from the carriage wall. The nephelometer inlet and the OPCRDS were located within 1 m of each other. The particle-free ringdown τ0 was measured for 2 min every 20 min, and values between each τ0 measurement were linearly interpolated in time.
Extinction was calculated from 1-s averaged ringdowns (see Data Acquisition) as follows: (1) the contribution of Rayleigh scattering variability to the measured τ and τ0 was eliminated by correcting these parameters to a common temperature and pressure; (2) extinction was calculated using Equation (1); and (3) extinction was corrected to standard temperature and pressure (STP, 273.15 K and 1000 mb) for comparison with the nephelometer. (The contribution of water, O3, and NO2 to extinction was not subtracted from the reported aerosol extinction, but (as noted in Section 2.1 above) these are minor contributions and would not change our conclusions.)
The 1-s dry scattering values are calculated from the nephelometer data as follows: (1) the total scattering at 700 nm is calculated from
where C700 is the measured scattering at 700 nm, a700 is a factor that accounts for the truncation of the scattered radiation at scattering angles <7 degrees, b700 is a correction factor accounting for the slightly non-cosine weighted light intensity in the nephelometer, and Å is the Ångström exponent calculated from the scattering at 550 nm and 700 nm. The values chosen for a700 and b700 (1.297 and –0.113, respectively) are those recommended in Anderson and Ogren (Citation1998) for non-size selected aerosol, since there was no impactor upstream of the nephelometer; (2) Cts,700 is corrected to STP; and (3) the scattering at 674 nm (to match the OPCRDS laser wavelength) is calculated using the Ångström equation and the STP-corrected Cts,700.
Measurements made during a 2.5-h period of heavy cloud cover and rain demonstrate the OPCRDS's utility in extremely high RH conditions. Intermittent heavy cloud cover and precipitation are visible between 30 July 2014, 23:25 and 31 July 2014, 00:40 in the high spectral resolution lidar (Shipley et al. Citation1983) image shown in a. The aerosol entering the nephelometer was dried (<65%); therefore, scattering was relatively constant even when sampling in clouds (b). However, the OPCRDS extinction peaks during the cloud sampling periods due to the highly humidified aerosol. Several isolated clouds (visible in a and enlarged in c) intersect the OPCRDS and nephelometer at 285 m AGL for ∼1 min, causing the ambient extinction to peak above 300 Mm−1 (enlarged in d) while the dry scattering value remained constant. Assuming no absorbing species were present, the ratio of extinction at high RH to extinction at low RH, f(RH), calculated during the 1-min cloud intersection at 00:59:03 UTC ranged from 1.7 to 58.1 (mean = 12.1 and σ = 13.8). The extremely high values at the peak are indicative of highly humidified particles and/or droplets. Note that the OPCRDS's fast time response makes it possible to resolve some structure in the rising and falling seconds of the peak in d. At 01:45 when the rain clears (evident in the transition from green to blue in the bottom right corner of a) and the ambient RH drops below 90%, the extinction and scattering are approximately equal. This behavior is consistent with the well-known steep increase in f(RH) above 90% RH.
FIG. 5. 2.5 h of measurements during a 30–31 July 2014 rainstorm at the Boulder Atmospheric Observatory. Low-lying clouds and precipitation show up as areas of high backscatter cross-section (hotter colors) in (a) an image from a co-located high spectral resolution lidar. The (red) dashed line in (a) represents the vertical position of the OPCRDS and nephelometer as a function of time. (b) Ambient extinction (black trace) from the OPCRDS and dry scattering from a nephelometer (red trace). Note that the maxima of the extinction coefficients in (b) are off-scale (peaking at 150–450 Mm−1). The highlighted 10-min segment centered at 01:00 is expanded in (c) the lidar image and (d) the plot of extinction/scattering. The slight (∼1–2 min) misalignment between the cloud signature in (c) and the peak in (d) is likely due to the fact that the lidar was located about 500 m from the tower site.
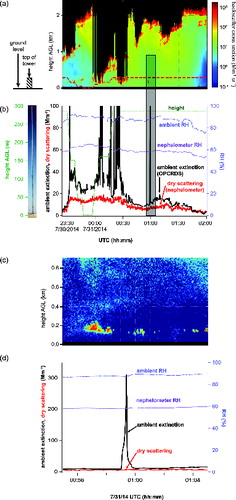
The ambient RH data reported in were recorded by a sensor in the center of the OPCRDS duct ∼21.5 cm above the optical cavity. A small increase in the RH during the cloud sampling period (00:59:03 UTC) is visible in d, but the lack of a large, distinct RH spike is due to the fact that the response time for the sensor when subjected to a step change in RH from 90% to 100% is on the order of tens of minutes. Since the OPCRDS was in the cloud (c and d) for only 1 min, the sensor would not have had enough time to reach steady state, and the measured RH would be lower than the actual value in the cloud. In addition, the average temperature in the duct was stable and ∼0.8 K higher than the value reported by a sensor on the BAO tower 15 m above the OPCRDS (the OPCRDS was positioned at 285 m during this time period). This tower sensor reported an average RH of 95.1% between 00:30 and 01:30 UTC at 300 m AGL, but if the temperature were 0.8 K higher (as in the duct), the RH would drop to approximately 91%, which is closer to the value reported by the sensor in the duct.
4. CONCLUSIONS AND FUTURE WORK
We have demonstrated the successful deployment of an OPCRDS. The direct interaction of transversely flowing aerosol with the laser beam in the OPCRDS mitigates particle losses inherent in closed-path CRDS designs, making possible measurements of the extinction coefficient due to coarse and highly humidified particles. Open-path sampling and high-finesse optical cavities have been combined previously in instruments measuring trace gases (Bitter et al. Citation2005; via broadband CRDS, BBCRDS) and aerosol (Thalman and Volkamer Citation2010; via differential optical absorption spectroscopy, DOAS); however, the current report is the first (to our knowledge) to demonstrate the application of open-path cavity ringdown spectrometry to the study of aerosol extinction.
Compared to a closed-path CRDS developed in our laboratory, the ringdown times measured in ambient air by the OPCRDS were more variable for short averaging times. Rather than reflecting a true difference in precision in measuring ringdowns, this variability is due to the closed-path CRDS's inability to measure independent aerosol samples at a 1 kHz repetition rate. When the ringdowns are averaged over 1-s periods, which is typical during actual experiments, the standard deviations of the two instruments were comparable. Furthermore, for 1-s averages the 1σ detection limits (0.05 Mm−1 Allan deviation) of the open- and closed-path instruments were nearly identical.
During a field study at NOAA's Boulder Atmospheric Observatory the OPCRDS recorded very large extinction enhancement (f(RH) > 50) due to highly humidified aerosol and/or droplets in low-lying rainclouds, demonstrating the OPCRDS's utility in extremely high RH conditions. Improving the accuracy of our RH measurements and minimizing the small temperature difference between the duct and the ambient have driven design changes since the 2014 field study. These changes will be described in a future publication.
In addition to its utility in characterizing aerosols, the OPCRDS could also be employed to study gases that are too sticky or reactive to be sampled in a closed-path instrument. The short residence time of the air in the instrument might also make it useful for measuring particle flux (e.g., using eddy covariance methods), since such measurements have been limited in the past (Held and Klemm Citation2006) due to technical difficulties in measuring aerosol at high enough time resolution (10–20 Hz).
Having proven that an open-path CRDS can operate stably with good sensitivity under a range of environmental conditions, future efforts will focus on designing a new OPCRDS for deployment on a research aircraft. Vertical aerosol extinction profiles from deployment on an aircraft-based OPCRDS could help further constrain ground- and satellite-derived AOD retrievals and the radiative forcing uncertainty in twilight zones around clouds and in coarse dust-dominated regions.
FUNDING
This research was funded by NOAA base and climate funding. Portions of the OPCRDS design have patent filing initiated.
REFERENCES
- Anderson, T., Covert, D., Marshall, S., Laucks, M., Charlson, R., Waggoner, A., Ogren, J., Caldow, R., Holm, R., and Quant, F. (1996). Performance Characteristics of a High-Sensitivity, Three-Wavelength, Total Scatter/Backscatter Nephelometer. J. Atmos. Ocean. Technol., 13:967–986.
- Anderson, T. L., and Ogren, J. A. (1998). Determining Aerosol Radiative Properties Using the TSI 3563 Integrating Nephelometer. Aerosol Sci. Technol., 29:57–69.
- Baynard, T., Lovejoy, E. R., Pettersson, A., Brown, S. S., Lack, D., Osthoff, H., Massoli, P., Ciciora, S., Dube, W. P., and Ravishankara, A. (2007). Design and Application of a Pulsed Cavity Ring-Down Aerosol Extinction Spectrometer for Field Measurements. Aerosol Sci. Technol., 41:447–462.
- Berden, G., and Engeln, R. (2009). Cavity Ring-Down Spectroscopy. Wiley, Chichester.
- Birch, K. P., and Downs, M. J. (1993). An Updated Edlen Equation for the Refractive Index of Air. Metrologia, 30:155.
- Bitter, M., Ball, S., Povey, I., and Jones, R. (2005). A Broadband Cavity Ringdown Spectrometer for In-Situ Measurements of Atmospheric Trace Gases. Atmos. Chem. Phys., 5:2547–2560.
- Bodhaine, B. A., Wood, N. B., Dutton, E. G., and Slusser, J. R. (1999). On Rayleigh Optical Depth Calculations. J. Atmos. Ocean. Technol., 16:1854–1861.
- Covert, D. S., Charlson, R. J., and Ahlquist, N. C. (1972). A Study of the Relationship of Chemical Composition and Humidity to Light Scattering by Aerosols. J. Appl. Meteorol., 11:968–976.
- Deuzé, J., Herman, M., Goloub, P., Tanré, D., and Marchand, A. (1999). Characterization of Aerosols Over Ocean from POLDER/ADEOS-1. Geophys. Res. Lett., 26:1421–1424.
- Gagliardi, G., and Loock, H.-P. (2014). Cavity-Enhanced Spectroscopy and Sensing. Springer, Berlin.
- He, Y., Jin, C., Kan, R., Liu, J., Liu, W., Hill, J., Jamie, I. M., and Orr, B. J. (2014). Remote Open-Path Cavity-Ringdown Spectroscopic Sensing of Trace Gases in Air, Based on Distributed Passive Sensors Linked by Km-Long Optical Fibers. Opt. Exp., 22:13170–13189.
- Heintzenberg, J., Wiedensohler, A., Tuch, T., Covert, D., Sheridan, P., Ogren, J., Gras, J., Nessler, R., Kleefeld, C., and Kalivitis, N. (2006). Intercomparisons and Aerosol Calibrations of 12 Commercial Integrating Nephelometers of Three Manufacturers. J. Atmos. Ocean. Technol., 23:902–914.
- Held, A., and Klemm, O. (2006). Direct Measurement of Turbulent Particle Exchange with a Twin CPC Eddy Covariance System. Atmos. Environ., 40:92–102.
- Howell, S., Clarke, A., Shinozuka, Y., Kapustin, V., McNaughton, C., Huebert, B., Doherty, S., and Anderson, T. (2006). Influence of Relative Humidity Upon Pollution and Dust during ACE-Asia: Size Distributions and Implications for Optical Properties. J. Geophys. Res.: Atmos., 111: D06205 .
- Koren, I., Remer, L. A., Kaufman, Y. J., Rudich, Y., and Martins, J. V. (2007). On the Twilight Zone between Clouds and Aerosols. Geophys. Res. Lett., 34:L08805.
- Langridge, J. M., Richardson, M. S., Lack, D., Law, D., and Murphy, D. M. (2011). Aircraft Instrument for Comprehensive Characterization of Aerosol Optical Properties, Part I: Wavelength-Dependent Optical Extinction and Its Relative Humidity Dependence Measured Using Cavity Ringdown Spectroscopy. Aerosol Sci. Technol., 45:1305–1318.
- Michel Flores, J., Bar-Or, R., Bluvshtein, N., Abo-Riziq, A., Kostinski, A., Borrmann, S., Koren, I., and Rudich, Y. (2012). Absorbing Aerosols at High Relative Humidity: Linking Hygroscopic Growth to Optical Properties. Atmos. Chem. Phys., 12:5511–5521.
- Ramanathan, V., Crutzen, P. J., Kiehl, J. T., and Rosenfeld, D. (2001). Aerosols, Climate, and the Hydrological Cycle. Science, 294:2119–2124.
- Ryder, C., Highwood, E., Rosenberg, P., Trembath, J., Brooke, J., Bart, M., Dean, A., Crosier, J., Dorsey, J., and Brindley, H. (2013). Optical Properties of Saharan Dust Aerosol and Contribution from the Coarse Mode as Measured during the Fennec 2011 Aircraft Campaign. Atmos. Chem. Phys., 13:303–325.
- Shipley, S. T., Tracy, D. H., Eloranta, E. W., Trauger, J. T., Sroga, J. T., Roesler, F. L., and Weinman, J. A. (1983). High Spectral Resolution Lidar to Measure Optical Scattering Properties of Atmospheric Aerosols. 1: Theory and Instrumentation. Appl. Opt., 22:3716–3724.
- Smith, J. D., and Atkinson, D. B. (2001). A Portable Pulsed Cavity Ring-Down Transmissometer for Measurement of the Optical Extinction of the Atmospheric Aerosol. Analyst, 126:1216–1220.
- Solomon, S., Qin, D., Manning, M., Alley, R., Berntsen, T., Bindoff, N., Chen, Z., Chidthaisong, A., Gregory, J., and Hegerl, G., eds. (2007). Technical Summary, in Climate Change 2007: The Physical Science Basis. Contribution of Working Group I to the Fourth Assessment Report of the Intergovernmental Panel on Climate Change, S. Solomon, D. Qin, M. Manning, Z. Chen, M. Marquis, K. B. Averyt, M. Tignor and H. L. Miller, eds., Cambridge University Press, Cambridge, pp. 21–91.
- Stone, J. A., and Zimmerman, J. H. (2004). Refractive Index of Air Calculator Based on Modified Edlén Equation. Available online at: http://emtoolbox.nist.gov/Wavelength/Edlen.asp
- Thalman, R., and Volkamer, R. (2010). Inherent Calibration of a Blue LED-CE-DOAS Instrument to Measure Iodine Oxide, Glyoxal, Methyl Glyoxal, Nitrogen Dioxide, Water Vapour and Aerosol Extinction in Open Cavity Mode. Atmos. Meas. Tech., 3:1797–1814.
- Wada, R., Beames, J. M., and Orr-Ewing, A. J. (2007). Measurement of IO Radical Concentrations in the Marine Boundary Layer Using a Cavity Ring-Down Spectrometer. J. Atmos. Chem., 58:69–87.
- Werle, P., Mücke, R., and Slemr, F. (1993). The Limits of Signal Averaging in Atmospheric Trace-Gas Monitoring by Tunable Diode-Laser Absorption Spectroscopy (TDLAS). Appl. Phys. B, 57:131–139.
- Yu, H., Kaufman, Y., Chin, M., Feingold, G., Remer, L., Anderson, T., Balkanski, Y., Bellouin, N., Boucher, O., and Christopher, S. (2006). A Review of Measurement-Based Assessments of the Aerosol Direct Radiative Effect and Forcing. Atmos. Chem. Phys., 6:613–666.
- Zieger, P., Weingartner, E., Henzing, J., Moerman, M., de Leeuw, G., Mikkilä, J., Ehn, M., Petäjä, T., Clémer, K., Roozendael, M. v., Yilmaz, S., Frieß, U., Irie, H., Wagner, T., Shaiganfar, R., Beirle, S., Apituley, A., Wilson, K., and Baltensperger, U. (2011). Comparison of Ambient Aerosol Extinction Coefficients Obtained from In-Situ, MAX-DOAS and LIDAR Measurements at Cabauw. Atmos. Chem. Phys., 11:2603–2624.