
Abstract
Red Española de DMAs Ambientales (REDMAAS), the Spanish network of environmental differential mobility analyzers (DMAs), currently comprises six research groups involved in the measurement of atmospheric aerosol size distributions by means of DMAs. The aim of this network is to guarantee the good quality and comparability of the routine measurements carried out at each location and in diverse environments across Spain. In order to achieve this objective, one of its main activities is the annual intercomparison of mobility size spectrometers used within the network (five units of scanning mobility particle sizers [SMPS] and one ultrafine particle monitor [UFPM]). Here we report the 2main results obtained during the 2010–2012 campaigns, including a study on particle deposition in dryers used in ambient air sampling systems. In general, all instruments showed good performance with deviations in accepted tolerance. The intercomparisons have been proved to be a useful exercise to detect instrument problems, such as incorrect calibrations. DMA calibration checks were performed with polystyrene latex reference particles. Deviations of less than 1% were observed during the first year, which increased 4.7% during the last campaign. Some differences among the responses of different condensation particle counter (CPC) models were encountered, being mainly connected to the intrinsic characteristics of each counter. The comparison of UFPM with CPCs has given good results. The SMPS intercomparisons, especially for particles above 20 nm, have been within +/−15% tolerance. Regarding particle deposition in dryers used in sampling systems, particle penetration was lower than predicted by the recommended model. This result was probably due to the fact that not all the possible mechanisms were considered in the model.
Copyright 2015 American Association for Aerosol Research
1. INTRODUCTION
The particle size distribution of atmospheric aerosol is an important property as it determines aerosol behavior, transport, and fate, and includes information about its origin and history. Particle size is a key factor in aerosol dynamics and determines their effects on the climate and human health. Besides aerosol composition, the radiation–matter interaction processes known as scattering and absorption also depend on particle size. Some climate models (IPCC Citation2013) indicate that aerosols are delaying the expected global warming caused by greenhouse gases. Sulfate and organic particles have a particular influence on this delay, and both are mainly found in the ultrafine range. Moreover, studies on aerosol health effects need to consider the particle size distribution to obtain the fraction that can be deposited in the different parts of the lungs and the overall respiratory system as well as the fraction that is able to penetrate into the bloodstream. Several studies have shown that the toxicity of particles per mass unit increases as the particle size decreases (Oberdorster Citation2000; Lingard et al. Citation2005; Oberdorster et al. Citation2005).
Since the 1990s, measurements of atmospheric particle size distributions have been performed at a great variety of sites. Kulmala et al. Citation(2004) have completed an extensive review specifically on nucleation process measurements, and Asmi et al. Citation(2011) have compiled two years of measurements at multiple sites in Europe.
These measurements have in common that they were done by using a combination of an aerosol neutralizer, a differential mobility analyzer (DMA), and a condensation particle counter (CPC). The names of the corresponding instruments differ by how the voltage varied in DMA: they are known as differential mobility particle sizer (DMPS) for a stepwise measurement, and scanning mobility particle sizer (SMPS) for a continuous one. In front of a DMA inlet, a dryer is used to assure a relative humidity of below 40%, which is the recommended value to minimize diameter changes due to hygroscopic growth.
Mobility particle size spectrometers are complex instruments that require good measurement protocols to ensure good data quality. This need, in combination with an increase in the number of instruments deployed around the world, has produced the formation of several measurement networks. The European reference network is called Aerosols, Clouds, and Trace gases Research InfraStructure Network (ACTRIS), which had its origin in the EU-funded European Supersites for Atmospheric Aerosol Research (EUSAAR) project. ACTRIS joins more than 20 ground-based atmospheric observational sites in Europe and has been able to prepare proper protocols to reach and enhance the quality of long-term aerosol size distribution measurements (Wiedensohler et al. Citation2012). In parallel to this European infrastructure, several national networks have also been developed. In Germany, the German Ultrafine Aerosol Network (GUAN), an atmospheric observation network designed for long-term observations, has been operational since the end of 2008 (Birmili et al. Citation2009). In Spain, the Spanish network of environmental DMAs (REDMAAS) was established in 2010 (Gómez-Moreno et al. Citation2010). These networks undertake a number of activities, including recommendations for instrument configuration, their calibration, and intercomparison workshops, in order to make all instruments belonging to the network, and their measurement results are comparable.
Results concerning intercomparisons of mobility particle size spectrometers have been published previously in peer-reviewed literature (Dahmann et al. Citation2001; Khlystov et al. Citation2001; Helsper et al. 2006; Imhof et al. Citation2006; Wiedensohler et al. Citation2012). The instruments showed a very similar shape of size spectra, with discrepancies for the particle number concentrations in the 20 to 200-nm range below 12%, and larger out of this range, reaching up to 30% at diameters of less than 50 nm. All these intercomparisons were individual campaigns, and were not repeated over several years, so there are no data on how the performance of an SMPS spectrometer can change with aging, even if routine maintenance and calibrations are properly conducted.
Another instrument able to measure size distributions in this range is the Ultrafine Particle Monitor (UFPM, TSI model 3031). This instrument is utilizing a DMA, a corona-discharge-based unipolar diffusion charger upstream the DMA and an aerosol electrometer used as detector. To the best of our knowledge, the only previous comparison with the traditional SMPS was performed by Hillemann et al. Citation(2014), with number concentrations measured by UFPM typically within a range of +/−20% of SMPS values.
In Spain there are six research groups measuring atmospheric particle size distributions at six different sites. These are located in the provinces of La Coruña (UDC), Barcelona (IDAEA-CSIC), Madrid (CIEMAT), Huelva (El Arenosillo-INTA), Granada (UGR), and Santa Cruz de Tenerife in the Canary Islands (IARC-AEMET). These sites correspond with different types of locations: suburban–rural, urban background, and rural background. These groups form and participate in the REDMAAS network, where an annual intercomparison campaign has been carried out during the period 2010–2012. We show here: (a) the main results obtained during the campaigns, (b) the evolution of the calibrations over the years for CPC and SMPS, (c) an experimental study on particle losses in dryers, and (d) a comparison of UFPM with other instruments.
2. INSTRUMENTATION
Mobility particle size spectrometers typically comprise a bipolar diffusion charger (also called aerosol neutralizer), a DMA, and a detector, which typically is a CPC, although one or several aerosol electrometers can also be used. The neutralizer objective is to establish an equilibrium electrical charge on the particles before they enter the DMA, which classifies particles according to their electrical mobility. This property is proportional to the particle size for a known particle charge.
The core of all mobility particle size spectrometers is DMA (Knutson and Whitby Citation1975; Flagan Citation1998), cylindrical geometries being the most common case. When the aerosol is introduced into DMA, the particles are exposed to a radial electric field and an axial flow field. The voltage applied to the inner cylinder is usually the spectral variable. The particle number concentration of the extracted mono-disperse flow can be measured by a CPC (Agarwal and Sem Citation1980). Particles below 300 nm cannot be detected by optical methods, so it is necessary to increase their size in order to count them. This can be achieved by the condensation of a working fluid, usually butanol or water (Hering and Stolzenburg Citation2005).
In most atmospheric measurements, the mobility particle size spectrometer has a dryer and an impactor upstream of a DMA. The use of an impactor is strongly recommended to remove the particles larger than a certain size, with no interest for the monitoring purpose, but an extremely negative effect on the long-term performance of the system, leading to increased soiling inside the DMA and the CPC optics. The pre-impactor also removes large particles that could disturb neutralizing process and distort size distribution. The objective of the dryer is to measure the particles at a relative humidity below 40% to avoid hygroscopic growth, but it also means that there will be some particle losses. Wiedensohler et al. Citation(2012) recommended considering a 12” Nafion® dryer (Perma Pure LLC, Toms River, NJ, USA) as a pipe with a length of 1.25 m and a 24” dryer as a pipe with a length of 2.5 m to calculate diffusional particle losses inside these devices. This recommendation was based on a previous work done at the University of Minnesota, published as a technical report (Dick et al. Citation1995).
The UFPM is an instrument that is also based on a DMA, but in this case there is a unipolar diffusion charger upstream of the DMA, and an aerosol electrometer is used as a detector (Peters et al. Citation2013; Hillemann et al. Citation2014). This instrument was designed to be installed in routine air quality monitoring stations, avoiding the use of radioactive sources and butanol as the working fluid as both could be operational constraints for a monitoring station. In the UFPM, the aerosol sample passes through a charger, where all particles are positively charged by diffusion charging mechanism. Later these charged particles are introduced and classified in a DMA according to their electrical mobility and measured by a Faraday cup aerosol electrometer. An important parameter is the kernel matrix, which relates the classifying DMA voltage to the particle size. This inversion matrix includes the charge distribution, the transfer function as well as the penetration of DMA and charger. Particle charging depends on particle composition, so different kernel matrices are available, i.e., for ammonium sulfate or atmospheric aerosol. The UFPM has five size channels of 20–30, 30–50, 50–70, 70—100, and >200 nm.
3. METHODOLOGY
Once a year, over three consecutive years, different institutions forming the REDMAAS network participated in intercomparison campaigns. A summary of CPC, neutralizer/charger, UFPM, and SMPS models used can be found in . Complete numbers of participating groups were achieved in 2012, when all the instruments belonging to the network could participate. In all the campaigns, a CPC intercomparison preceded the SMPS intercomparison, including not only the CPCs used within the SMPS systems but also other CPCs belonging to the participating institutions.
TABLE 1 Summary of the instrumentation used during intercomparisons. All instruments were manufactured by TSI Inc. (St. Paul, MN, USA)
In order to assure quality and accuracy of the instrument data, routine maintenance was performed at the beginning of each campaign, ensuring all instruments were in working order. This included filter changes, tubing and pre-impactor cleaning, and additional procedures laid out in the corresponding instrument manuals published by the manufacturer (TSI Inc., St. Paul, MN, USA).
For SMPS and UFPM systems, it is very important to work with appropriate flows to achieve an accurate aerosol classification by size. Therefore, it is necessary to periodically verify and, if necessary, calibrate the flows to ensure they are correct. For this task, it is common to use a volumetric flow meter. In these campaigns a Gilibrator-2 (Sensidyne LP, St. Petersburg, FL, USA), which was just calibrated, was used as a primary reference for the calibration of airflows. The difference in the inlet flow rates found among different CPCs was less than 6%, and among DMAs, the sheath flow rate difference was less than 2%, which is well within specifications.
Zero checks were performed for the CPC, UFPM, and SMPS systems. One of the lessons learnt during the campaigns was that the zero checks for SMPS should be done with the filter installed in the atmospheric air sampling line, rather than disconnecting the SMPS from the sampling line and installing the filter in front of the instrument inlet and sampling indoor air from the laboratory. The reason for this is that the sampling line produces a certain pressure drop, which can produce a leak in SMPS, which could not be observed when sampling laboratory air.
All intercomparison campaigns have been performed at INTA's “El Arenosillo” facility (Sorribas et al. Citation2011). It is located in the province of Huelva in southwestern Spain on the coast of the Atlantic Ocean and close to the Mediterranean Sea, not far from the North African coast. It is situated in Doñana National Park, which is a protected rural environment covering an extensive area with a homogeneous Mediterranean pine forest, and a coastal area to the southwest where the Atlantic Ocean is less than 1 km away. The closest populated place is the city of Huelva (160,000 inhabitants), 35 km to the northwest. This measurement location allows the measurement of different kinds of aerosols with distinct particle size distributions, i.e., emissions from industrial areas around Huelva could contribute much smaller particle sizes during northwesterly winds (Pey et al. Citation2008; Sorribas et al. Citation2011).
A small facility was used for the intercomparison of instruments, where ambient aerosol was sampled through an external sampling line. All the instruments were connected to this line using tubes with identical length, or when this was not possible, corrections were made to take into account differences in length. A common dry air supply was used for the Nafion dryers used in front of SMPS inlets.
4. RESULTS AND DISCUSSION
4.1. DMA Calibration Checks
During all three intercomparison campaigns, DMA calibrations were checked. For this objective, a primary particle size standard was used: polystyrene latex (PSL) spheres of 0.08 and 0.20 µm with a coefficient of variation of up to 18% and 5%, respectively. These PSL particles were aerosolized using a Collison nebulizer (May Citation1973), followed by a Nafion dryer to remove excess humidity.
The main results found in these campaigns are depicted in . Not all of the instruments were available during all three campaigns. There were four SMPS systems during the 2010 intercomparison, four SMPS systems and one UFPM in the 2011 campaign, and five SMPS systems and one UFPM in the 2012 campaign.
FIG. 1. Evolution of DMA calibration checks with PSL particles during the three campaigns. Every point varied between 6 and 10 scans, which were later averaged. An error band of +/−5% is shown as limits. See to identify every DMA.
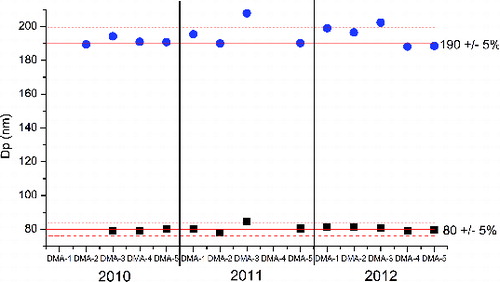
During the 2010 campaign, all SMPS instruments showed accurate sizing for 80-nm particles, with minor deviations of less than 1%. In all the measurements, a broad peak below 50–60 nm corresponding to water residue was observed. This peak did not affect the latex measurements. However, in the case of 200-nm particles, all of these were reported as 190 nm, with very small deviations (<0.5%). The 190-nm peak appeared symmetrical and clearly separated with no overlapping elements such as particles with multiple charges and aggregates that could have made difficult the peak identification. Taking into account this, all four instruments measured 80-nm particles accurately, and since the deviation in the size measurements was very small with a difference between the measured size and the expected value being 5%, it was considered that the real particle size was indeed 190 nm instead of the nominal 200 nm. This is why we will discuss the deviations from this value instead of the nominal value of 200 nm, as during the campaigns the same batch of PSL was always used.
shows the good overall quality of calibration checks in all the campaigns, with measurements having a deviation of less than 5% with one exception. The instrument identified as TSI-DMA-3 had deviations higher than 5% for both 80- and 190-nm reference particles in the 2011 campaign, and for 190-nm reference particles in the 2012 campaign. An interesting finding is the evolution of calibration validations over the three years. During the first year, the calibration check results for all the instruments were very good, with deviations smaller than 1%. During the second year, the calibration check results were good, but deviations reached a value of 2.8% (not taking into account TSI-DMA-3). In the third year, the behavior was similar, but worsening a little as the deviation reached 4.7%. These results are similar to those published in previous works. Imhof et al. Citation(2006) used mono-disperse particles with diameters of 20, 40, 80, 150, and 300 nm to check DMAs. The differences found were around ±5%, with the lowest standard deviations in the size range of below 100 nm. Wiedensohler et al. Citation(2012) found that all mobility particle size spectrometers that they investigated were within an uncertainty range of 3.5%.
From these results, we suggest that the instruments experienced a small deterioration in their accuracy over time, which is not directly related to lack of maintenance. In fact, all instruments were regularly maintained through cleaning, exchanging the filters, and checking the flow rates. The high voltage supply was not tested, as it was not included in the routine maintenance. Therefore, the increase in data scattering, which was always within the +/−5% tolerance band, could be due to small deviations in voltage. In other networks, such as ACTRIS (Wiedensohler et al. Citation2012), it is recommended to periodically check the high voltage and include the function obtained in the control software. This is not currently possible with the manufacturer's Aerosol Instrument Manager (AIM) software (TSI, model AIM3936), although it is possible to obtain the same results by manipulating the hardware through adjusting some potentiometers. This possibility is not documented in the manufacturer's instrument manual for this generation of SMPS systems, which implies that most SMPS users do not perform this verification. It should be pointed out that the new generation of SMPS instruments from the same manufacturer (TSI, model 3938 SMPS) comes with a fully ISO 15900:2009 compliant calibration, including a corresponding documentation in the instruction manual (TSI Incorporated Citation2014).
It is interesting to see that in spite of slight deterioration observed in the accuracy, the order in the PSL measurements was kept constant over time, at least for 190-nm particles. The instruments designated as TSI-DMA-4 and TSI-DMA-5 always measured the lowest values, and TSI-DMA-3 measured the highest. This fact was also confirmed in the 2014 campaign, which is not included in this article. These findings may be explained by slight differences in the DMA controller platforms.
For UFPM, it was more difficult to see PSL peak because this instrument has a lower size resolution by design. In order to meet the requirements of air quality monitoring networks, the UFPM has only five size channels, so it was expected to see the highest concentration in the channel corresponding to the latex particles size. However, during the SMPS calibration checks, a large quantity of residue particles from the water used in the collision nebulizer and peaks corresponding to multiple charges and aggregates were observed, as described previously. They did not disturb the high-resolution SMPS measurements, and did not allow identifying a clear peak in the UFPM data due to its lower size resolution. According to the results shown in Figure S2 (found in the SI), the choice of kernel matrix might also influence the results.
4.2. CPC Intercomparison
During different campaigns, several models of condensation particle counters have been used. A summary can be found in , which shows the lower size detection limit and the flow rates for each model according to the manufacturer's specifications. Some of the CPC models used offer a photometric mode when particle concentrations exceed a certain threshold. Other CPCs internally split the inlet flow to have a smaller detected aerosol flow and an improved lower size detection limit. All the counters included in the campaigns use butanol as a condensation liquid, except for the TSI-CPC model 3785, which uses distilled water. The variety of characteristics of these instruments makes it complex to compare the results obtained, i.e. different inlet flow rates can result in differences in particle deposition in sampling line due to diffusion losses of the smallest particles. If not taken into account, the particle concentration measured would be lower.
As no reference CPC was available during the campaigns (see Wiedensohler et al. Citation2012 for a discussion on reference instruments), we averaged the measurements of all the instruments to obtain a “reference value.” It is supposed that all the instruments can measure properly, so if one of them is far from the average value, out of the +/−10% limit value given by the manufacturer, it is not working well. A broad dispersion in the CPC data would indicate that most of the instruments are not working properly. In that case, this “reference value” would not be valid.
Although the CPC intercomparisons were performed in all the three campaigns, here we are going to discuss the 2011 campaign, as it is the event with the counters and the UFPM measuring simultaneously. The results from two other campaigns can be found in the online supplemental information (SI).
During the 2011 intercomparison campaign, ambient air was sampled for 19.5 h (as usual in other intercomparisons and worldwide intercomparisons), and the results are shown in . The results show that the CPCs were able to follow the changes in the particle number concentration independent of the aerosol origin or their technical characteristics. TSI-CPC-2C, a CPC model 3022A, measured around 10% less than the average of all the counters, although there were periods with larger differences of up to 40%. These periods coincided with particle concentrations of above 1 × 104 cm−3 when the CPC 3022A changes from single count mode to photometric mode. The measurements showed that this last mode was out of calibration, and hence manufacturer's recalibration was required. For other instruments, the maximum deviation was +5.0% and −5.6% for TSI-CPC-1 (3772) and TSI-CPC-5 (3776), respectively, while the others presented a deviation lower than 1.1%, including the TSI-CPC-3 (WCPC model 3785) that measured the highest concentrations during the previous intercomparison campaign. The values for these measurement differences were all well in the range of those specified by the manufacturer, suggesting that the potential influence of different cut-off diameters in our measurements was insignificant.
FIG. 2. CPC intercomparison during the 2011 campaign: (a) particle concentration measurements, (b) difference between each counter and the mean value during the measurements. The weird variability observed after 5:15 was caused by fast changes in the wind direction, being all CPCs able to follow the changes in particle concentrations.
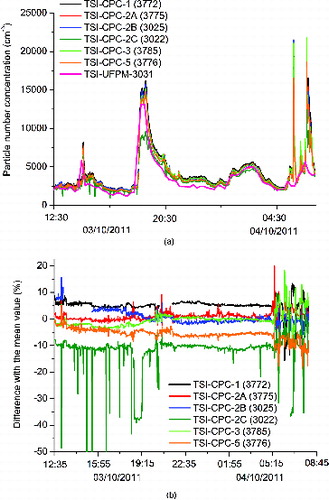
The TSI-UFPM (model 3031) was included in the 2011 intercomparison and its measurements can be found in . The kernel matrix used was the one obtained by Hillemann et al. Citation(2014) for ammonium sulfate. The instrument followed the general trend, although most of the time the concentration measured was slightly lower than the CPCs, which is expected for an instrument that uses an aerosol electrometer as its detector. The average differences varied between −1.5%, compared with TSI-CPC-5, and −10%, compared with TSI-CPC-1. The larger differences could be explained by different size detection limit, which is 20 nm for UFPM, while CPCs can reach smaller sizes. It might be that the combination of used kernel matrix and higher detection limit (20 nm) caused the discrepancies, which were not further studied in detail. It is worth to mention that the scanning UFPM with electrometer – not the standalone electrometer – was compared with standalone CPCs. A standalone CPC is typically the most precise way to measure total particle number counts.
It is remarkable that over the years, during the different campaigns performed, every CPC has maintained a similar behavior compared with others. The TSI-CPC-1 (3772), TSI-CPC-2A (3775), and TSI-CPC-3 (3785) have measured the highest concentrations, while the TSI-CPC-5 (3776) and TSI-CPC-4 (3010) have measured the lowest ones. Different instrument technologies used can be the reason for the different behaviors of these CPCs. The CPC 3776 and 3025A internally split the sensor flow and only use a small fraction (0.05 and 0.03 Lpm, respectively), so a small variation in this flow rate can produce variations in particle number concentration. It can be said that these different instrument technologies do not affect the stability of CPCs over long periods, and for the majority of the measurements the CPCs were within their measurement tolerances.
4.3. SMPS Intercomparison
As in the CPC intercomparison, we have selected here the most complete case, the 2012 campaign. The results for the other two campaigns can be found in the SI.
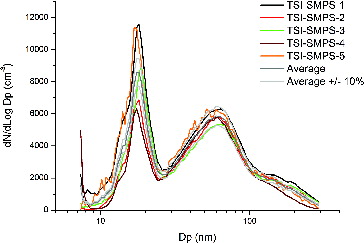
During the 2012 intercomparison campaign, all instruments were operated with identical sample and sheath flow rates and 1:10 ratios, so the internal diffusional and tubing losses were comparable for all of these. In addition, a number of measurements were taken without dryers to avoid introducing differences due to particle deposition. An example of this last case is shown in , where the differences observed previously in the CPC intercomparison were taken into account. For the accumulation mode, practically all instruments compared well within the +/−15% tolerance band. This was different for nucleation mode, where the data scattering was so high that most of the measurements were outside this range. Similar results were found when dryers were used in front of SMPS. Wiedensohler et al. Citation(2012) found similar results for seven size spectrometers: above 20 nm all instruments compared within +/−10%, but for smaller sizes the discrepancies increased substantially. The main reason for these differences is the particle diffusion losses inside the instruments, which can be different from instrument to instrument when standard long DMAs are used for the sub-20-nm size range. Although it is possible to correct diffusion losses, these corrections are not able to fully overcome discrepancies. The best solution is to use a nano-DMA when attention must be focused on the nucleation mode. On the other hand, losses in the dryer can also become important as discussed below.
FIG. 3. Particle size distributions measured during the 2012 campaign. No dryers were used during these measurements.
For a complete SMPS system, we found no clear tendency over the years when comparing different instrument behaviors during different campaigns.
The TSI-UFPM was also compared with SMPS systems. The comparison with TSI-SMPS-5 during the 2011 campaign can be found in the SI. For most of the time, the shapes of the size distribution were similar in both instruments, showing the maximum at the same diameter.
4.4. Particle Deposition in Dryers
In the setup used in the particle deposition study of dryers, external air was introduced into a common dryer and the dried air was split into two flows. The first of the flows was connected directly to an SMPS system, and the second to the test dryer and then to another SMPS. The sampling flow rate was always 1 Lpm. The reason to have a common dryer is to ensure that both SMPS systems measured dry particles, and that the differences between the measurements are due to particle deposition in the test dryer. The first measurement was performed with the test dryer replaced by an identical tube as the one used in the other line, conductive silicone tubing. Differences between the two instruments gave a correction factor to allow for comparing the following measurements with the assembled dryer. Six Permapure Nafion dryers were tested, five of them 12” long and one 24” in length. Twenty to 30 measurements were carried out for each dryer, and averaged to obtain the final curve.
An example of the results obtained is shown in , where the long dryer was studied. It shows a larger deposition than the short dryers, which are the ones used more frequently. The most important deposition of more than 50% was observed for the nucleation mode particles, while for the accumulation mode particles, it was smaller than 20%. This fact can be observed in , where the penetration curves obtained for all the dryers were included. For the case of a long dryer, the penetration efficiency started to deteriorate at 40 nm and got worse as the particle size decreased. All dryers presented a similar behavior for particles above 40 nm with a relatively flat penetration and a decrease for bigger particles. The penetrations in this size range are in the band of 0.8 to 0.9, with small deviations. An interesting case is an aged dryer (reference 46711101+u in ), which deteriorated faster than other short dryers in the size range of 40–20 nm.
FIG. 4. Main results obtained during the particle deposition study on dryers: (a) an example using a 24” long dryer and (b) particle penetration obtained for the dryers included in the study, the legend corresponds the dryer reference.
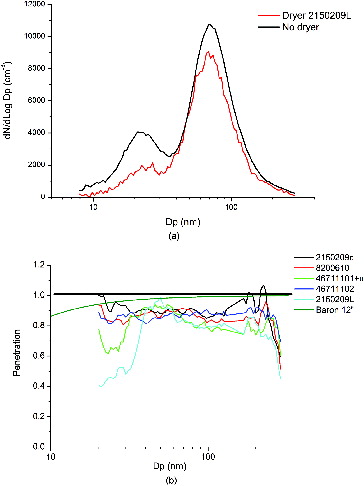
In order to estimate particle losses in dryers, Wiedensohler et al. Citation(2012) recommended to use equivalent pipe lengths, and consider the Permapure Nafion dryer SS24” as a 2.5-m tube and the Permapure Nafion dryer SS12” as a 1.25-m tube. To calculate particle deposition by diffusion, the only mechanism that was considered, the expressions given by Willeke and Baron (Citation1993, pp 435–436) were used. The results obtained have been included in . For most of the cases, the model gave a smaller deposition than the experimental values, always above 0.9 for sizes bigger than 20 nm. The probable reason for this difference is that there are more mechanisms influencing the deposition than those considered. One probable mechanism could be turbulent impaction due to a kinked inner tube that would increase this deposition. In Tuch et al. Citation(2009), the authors simulated some previous transmission efficiency measurements in a dryer and obtained good results, taking into account more mechanisms: diffusion, sedimentation, and impaction losses.
5. CONCLUSIONS
During three annual calibration and intercomparison campaigns, five SMPS systems and one UFPM instrument were compared. Instrument components such as DMAs and CPCs were individually checked prior to complete system comparisons. In general, all the instruments demonstrated a good performance behavior, with some deviations within the accepted tolerance bands. Some problems were detected during the campaigns, such as deteriorated calibrations, for which the intercomparison campaigns have proven to be very useful to detect them.
DMA calibration checks were performed with PSL particles. The results showed deviations in the particle size of less than 5%. Over the years, these deviations increased slightly, which could be related to instrument aging and possibly the soiling of high voltage source, as it is not normally checked by the user during routine maintenance. The rank order of instruments in the deviations for 190-nm PSL particles was shown to be constant over time.
The CPCs showed a good agreement during all intercomparisons, typically well within the tolerance band of +/−10%. The main differences were caused due to the different technologies used in each counter, such as different lower size detection limits or instrument flow rates. The comparison of UFPM with CPCs showed satisfactory results with differences below 10%. More research is needed to properly address the influence of kernel matrix on the results.
The intercomparisons of complete SMPS systems have given good results, especially for particles above 20-nm diameter, within +/− 15% tolerances. Below this size, discrepancies were larger because the long DMA columns used were not the appropriate ones to minimize diffusional losses in the lower nanometer size range. Size distributions measured by UFPM and SMPS were similar, although higher concentrations were measured by UFPM.
Considering particle deposition inside Nafion dryers, our study has demonstrated that above 20 nm, particle penetration was smaller than predicted by the recommended model, probably because it does not consider all the possible mechanisms involved in particle deposition.
SUPPLEMENTAL MATERIAL
Supplemental data for this article can be accessed on the publisher's website.
UAST_1074656_Supplemental_information.zip
Download Zip (258.3 KB)ACKNOWLEDGMENTS
The authors wish to thank M. Beeston of TSI GmbH for his instrumental support.
FUNDING
The REDMAAS activities were possible, thanks to funding from the Spanish Ministry of Science and Innovation (CGL2009-07128-E, CGL2010-11095-E, and CGL2011-15008-E), CIEMAT acknowledges funding from the Spanish R&D Plan under PROACLIM Project (CGL2014-52877-R) and the CAM TECNAIRE Project (P2013/MAE-2972). QANAP-IUMA acknowledges funding from Program of Consolidation and Structuring of Units of Competitive Investigation of the University System of Galicia (Xunta de Galicia) (refs. 2010/52 and GRC2013-047). Elisabeth Alonso acknowledges the FPI grant to carry out doctoral thesis/PhD at the Energy, Environment and Technology Research Centre (CIEMAT). M. Isabel García acknowledges the grant of the Canarian Agency for Research, Innovation and Information Society (ACIISI) co-funded by the European Social Funds.
REFERENCES
- Agarwal, J. K., and Sem, G. J. (1980). Continuous Flow Single-Particle-Counting Condensation Nuclei Counter. J. Aerosol Sci., 11:343–357.
- Asmi, A., Wiedensohler, A., Laj, P., Fjaeraa, A.-M., Sellegri, K., Birmili, W., Weingartner, E., Baltensperger, U., Zdimal, V., Zikova, N., Putaud, J.-P., Marinoni, A., Tunved, P., Hansson, H.-C., Fiebig, M., Kivekäs, N., Lihavainen, H., Asmi, E., Ulevicius, V., Aalto, P. P., Swietlicki, E., Kristensson, A., Mihalopoulos, N., Kalivitis, N., Kalapov, I., Kiss, G., de Leeuw, G., Henzing, B., Harrison, R. M., Beddows, D., O'Dowd, C., Jennings, S. G., Flentje, H., Weinhold, K., Meinhardt, F., Ries, L., and Kulmala, M. (2011). Number Size Distributions and Seasonality of Submicron Particles in Europe 2008–2009. Atmos. Chem. Phys., 11:5505–5538.
- Birmili, W., Weinhold, K., Nordmann, S., Wiedensohler, A., Spindler, G., Müller, K., Herrmann, H., Gnauk, T., Pitz, M., Cyrys, J., Flentje, H., Nickel, C., Kuhlbusch, T.A.J., Löschau, G., Haase, D., Meinhardt, F., Schwerin, A., Ries, L., and Wirtz, K. (2009). Atmospheric Aerosol Measurements in the German Ultrafine Aerosol Network (GUAN): Part 1 – Soot and Particle Number Size Distributions. Gefahrst. Reinh. Luft., 69:137–145.
- Dahmann, D., Riediger, G., Schlatter, J., Wiedensohler, A., Carli, S., Graff, A., Grosser, M., Hojgr, M., Horn, H.-G., Jing, L., Matter, U., Monz, C., Mosimann, T., Stein, H., Wehner, B., and Wieser, U. (2001). Intercomparison of Mobility Particle Sizers (MPS). Gefahrst. Reinh. Luft, 61:423–428.
- Dick, W., Huang, P. F., and McMurry, P. H. (1995). Characterization of 0.02 to 1.0μm Particle Losses in Perma Pure Dryers: Dependency on Size, Charge and Relative Humidity. PTL Publication No. 936. Particle Technology Laboratory, Department of Mechanical Engineering, University of Minnesota, Minneapolis, MN.
- Flagan, R. C. (1998). History of Electrical Aerosol Measurements. Aerosol Sci. Technol., 28:301–380.
- Gómez-Moreno, F. J., Sastre, M., Artíñano, B., Piñeiro Iglesias, M., López Mahía, P., Pey, J., Ripoll, A., Alastuey, A., Sorribas, M., Fernández, M., De la Morena, B., Trujillo de Cabo, J. L., and Rodríguez, S. (2010). The Spanish Network on Environmental DMAs: Introduction and Main Activities. Proceedings of IV Spanish Meeting on Aerosol Science and Technology – RECTA 2010 (ISBN: 978-84-693-4839-0), Granada, Spain.
- Helsper, C., Horn, H. G., Schneider, F., Wehner, B., and Wiedensohler, A. (2008). Intercomparison of Five Mobility Size Spectrometers for Measuring Atmospheric Submicrometer Aerosol Particles. Gefahrst. Reinh. Luft, 68:475–481.
- Hering, S. V., and Stolzenburg, M. R. (2005). A Method for Particle Size Amplification by Water Condensation in a Laminar, Thermally Diffusive Flow. Aerosol Sci. Technol., 39:428–436.
- Hillemann, L., Zschoppe, A., Caldow, R., Sem, G. J., and Wiedensohler, A. (2014). An Ultrafine Particle Monitor for Size-resolved Number Concentration Measurements in Atmospheric Aerosols. J. Aerosol Sci., 68:14–24.
- Imhof, D., Weingartner, E., Prévôt, A. S. H., Ordóñez, C., Kurtenbach, R., Wiesen, P., Rodler, J., Sturm, P., McCrae, I., Ekström, M., and Baltensperger, U. (2006). Aerosol and NOx Emission Factors and Submicron Particle Number Size Distributions in Two Road Tunnels with Different Traffic Regimes. Atmos. Chem. Phys., 6:2215–2230.
- IPCC. (2013). Climate Change 2013: The Physical Science Basis. Contribution of Working Group I to the Fifth Assessment Report of the Intergovernmental Panel on Climate Change, Stocker, T. F., Qin, D., Plattner, G.-K., Tignor, M., Allen, S. K., Boschung, J., Nauels, A., Xia, Y., Bex, V., and Midgley, P. M. (Eds.). Cambridge University Press, Cambridge, UK.
- Khlystov, A., Kos, G. P. A., ten Brink, H. M., Mirme, A., Tuch, T., Roth, C., and Kreyling, W. G. (2001). Comparability of Three Spectrometers for Monitoring Urban Aerosol. Atmos. Environ., 35:2045–2051.
- Knutson, E.O., and Whitby, K.T. (1975). Aerosol Classification by Electric Mobility: Apparatus, Theory and Applications. J. Aerosol Sci., 6:443–451.
- Kulmala, M., Vehkamäki, H., Petäjä, T., Dal Maso, M., Lauri, A., Kerminen, V.-M., Birmili, W., and McMurry, P.H. (2004). Formation and Growth Rates of Ultrafine Atmospheric Particles: A Review of Observations. J. Aerosol Sci., 35:143–176.
- Lingard, J. J. N., Tomlin, A. S., Clarke, A. G., Healey, K., Hay, A., and Wild, C. P. (2005). A Study of Trace Metal Concentration of Urban Airborne Particulate Matter and Its Role in Free Radical Activity as Measured by Plasmidstrand Break Assay. Atmos. Environ., 39:2377–2384.
- May, K. R. (1973). The Collison Nebulizer. Description. Performance & Application. J. Aerosol Sci., 4:235–243.
- Oberdörster, G. (2000). Toxicology of Ultrafine Particles: In Vivo Studies. Phil. Trans. R. Soc. A, 358:2719–2740.
- Oberdörster, G., Oberdörster, E., and Oberdörster, J. (2005). Nanotoxicology: An Emerging Discipline Evolving from Studies of Ultrafine Particles. Environ. Health Persp., 113:823–839.
- Peters, J., Theunis, J., Van Poppel, M., and Berghmans, P. (2013). Monitoring PM10 and Ultrafine Particles in Urban Environments Using Mobile Measurements. Aerosol Air Qual. Res., 13:509–522.
- Pey, J., Querol, X., de la Rosa, J., González-Castanedo, Y., Alastuey, A., Gangoiti, G., Sánchez de la Campa, A., Alados-Arboledas, L., Sorribas, M., Pio, C., Cachorro, V., Piñeiro, M., López-Mahia, P., and García-Gacio, D. (2008). Characterization of a Long Range Transport Pollution Episode Affecting PM in SW Spain. J. Environ. Monitor., 10:1158–1171.
- Sorribas, M., de la Morena, B. A., Wehner, B., López, J. F., Prats, N., Mogo, S., Wiedensohler, A., and Cachorro, V. E. (2011). On the Sub-micron Aerosol Size Distribution in a Coastal-Rural Site at El Arenosillo Station (SW-Spain). Atmos. Chem. Phys., 11:11185–11206.
- TSI Incorporated. (2014). Electrostatic Classifier Model 3082 and Scanning Mobility Particle Sizer (SMPS) Spectrometer Model 3938 Operation and Service Manual (P/N 6006760), Revision B, Feb 2014.
- Tuch, T. M., Haudek, A., Müller, T., Nowak, A., Wex, H., and Wiedensohler, A. (2009). Design and Performance of an Automatic Regenerating Adsorption Aerosol Dryer for Continuous Operation at Monitoring Sites. Atmos. Meas. Tech., 2:417–422.
- Wiedensohler, A., Birmili, W., Nowak, A., Sonntag, A., Weinhold, K., Merkel, M., Wehner, B., Tuch, T., Pfeifer, S., Fiebig, M., Fjäraa, A. M., Asmi, E., Sellegri, K., Depuy, R., Venzac, H., Villani, P., Laj, P., Aalto, P., Ogren, J. A., Swietlicki, E., Williams, P., Roldin, P., Quincey, P., Hüglin, C., Fierz-Schmidhauser, R., Gysel, M., Weingartner, E., Riccobono, F., Santos, S., Grüning, C., Faloon, K., Beddows, D., Harrison, R., Monahan, C., Jennings, S. G., O'Dowd, C. D., Marinoni, A., Horn, H.-G., Keck, L., Jiang, J., Scheckman, J., McMurry, P. H., Deng, Z., Zhao, C. S., Moerman, M., Henzing, B., de Leeuw, G., Löschau, G., and Bastian, S. (2012). Mobility Particle Size Spectrometers: Harmonization of Technical Standards and Data Structure to Facilitate High-Quality Long-Term Observations of Atmospheric Particle Number Size Distributions. Atmos. Meas. Tech., 5:657–685.
- Willeke, K., and Baron, P.A. (Eds.). (1993). Aerosol Measurement. Principles, Techniques and Applications. Van Nostrand Reinhold, Nueva York.