
ABSTRACT
Cavity ring-down spectroscopy (CRDS) of single, optically manipulated aerosol particles affords quantitative retrieval of refractive indices for particles of fixed or evolving composition with high precision. Here, we quantify the accuracy with which refractive index determinations can be made by CRDS for single particles confined within the core of a Bessel laser beam and how that accuracy is degraded as the particle size is progressively reduced from the coarse mode (>1 μm radius) to the accumulation mode (<500 nm radius) regime. We apply generalized Lorenz–Mie theory to the intra-cavity standing wave to explore the effect of particle absorption on the distribution of extinction cross section determinations resulting from stochastic particle motion in the Bessel beam trap. The analysis provides an assessment of the accuracy with which the real, n, and imaginary, κ, components of the refractive index can be determined for a single aerosol particle.
Published with license by American Association for Aerosol Research
EDITOR :
1. Introduction
Aerosol radiative forcing efficiency (RFE) is a key quantity used in modeling Earth's climate and its calculation relies on accurate characterizations of the refractive indices (RI, m) of atmospheric aerosol (Ravishankara et al. Citation2015). The RI is given by m = n + κi, where the real component, n, influences the scattering of light by an aerosol particle, while the imaginary component, κ, is associated with light absorption. Here, we assess the accuracy with which m can be retrieved from extinction cross section (σext) measurements using our recently reported single-particle cavity ring-down spectroscopy (SP-CRDS) instruments (Walker et al. Citation2013; Reid et al., Citation2014; Cotterell et al. Citation2015a,Citationb; Mason et al. Citation2015). We evaluate the scope of these instruments for studying coarse mode (>1 μm radius), fine mode (500–1000 nm radius) and accumulation mode (<500 nm radius) particles.
The interaction of light with an aerosol particle is governed by the particle extinction cross section, with σext the sum of a scattering cross section, σsca, and an absorption cross section, σabs. The contributions to σext from the σsca and σabs components depend on the values of n and κ, as well as the particle shape (here we assume spherical particles throughout), internal structure, and the ratio of the particle size to the incident wavelength of light.
For a homogeneous spherical particle illuminated by a travelling plane wave, Mie theory allows calculation of the optical cross sections and angular light scattering distributions for a given particle radius, RI and wavelength (Bohren and Huffman Citation1998). Conversely, the RI can be extracted by measuring σext as a function of the particle size and fitting to Mie theory. Cavity ring-down spectroscopy (CRDS) is a technique which enables high precision measurements of σext for aerosol particles and, consequently, precise determinations of RI (Miles et al. Citation2011a). Ensemble cavity ring-down spectroscopy (E-CRDS) has become a commonplace technique in aerosol science for measuring the extinction coefficient, αext, for a sample consisting of a cloud of particles (Attwood and Greenslade Citation2012; Mason et al. Citation2012; Michel Flores et al. Citation2012). A flow of atomized aerosol is introduced into an optical cavity in which the aerosol ensemble is probed by CRDS. Particles are size-selected prior to admitting the aerosol ensemble into the optical cavity, typically by using a differential mobility analyzer (DMA), while a condensation particle counter determines the aerosol particle number density, N, in the chamber. From measurements of αext and N, σext is calculated using . However, uncertainty in the number density and large variances in the measured αext, due to statistical variations in the aerosol population within the intra-cavity ring-down beam, can lead to an imprecise measurement of σext. Moreover, even though the mean aerosol particle size is selected with a DMA, the ensemble will have a degree of polydispersity and significant systematic errors can derive from the DMA size selection process. In particular, a DMA uses the charge of the aerosol particles in an ensemble to perform size selection using an electrostatic field, and the size selection process assumes particles are singly charged. However, a fraction of the particles in the ensemble are multiply charged with larger size but the same electrical mobility; thus, the resulting size distributions selected by the DMA can be described as multi-modal (Miles et al. Citation2011b). The combination of imprecise σext measurements with the presence of multiply charged particles of larger size can result in poor RI retrievals unless appropriately accounted for in the analysis of the E-CRDS data (Miles et al. Citation2011b; Mason et al. Citation2012; Zarzana et al. Citation2014). Furthermore, analysis of E-CRDS measurements typically neglects the broadening of measured σext values due to the effect of the CRDS standing wave (Miller and Orr-Ewing Citation2007; Mason et al. Citation2014). We have recently shown that a modification must be made to Mie theory to account for the intra-cavity standing wave of a two-mirror CRDS instrument in order to model correctly the σext variations with radius (Miller and Orr-Ewing Citation2007; Reid et al. Citation2014; Cotterell et al. Citation2015a; Mason et al. Citation2015, Citation2014).
Zarzana and co-workers address the question of how accurately the RI needs to be characterized for accurate calculations of RFE (Zarzana et al. Citation2014). To calculate RFE with an uncertainty <1%, the error in n must be <0.003 (0.2% of true n) for nonabsorbing ammonium sulfate particles with radii of either 75 or 100 nm, and the error in κ is required to be <0.0005 (1% of true κ) for absorbing brown carbon particles. Similarly, Moise et al. reported that variation in n from 1.4 to 1.5 resulted in an increase in the radiative forcing by 12% (Moise et al. Citation2015). Assuming a linear relationship, a 1% uncertainty in radiative forcing requires knowing n to an accuracy of ∼0.008. Indeed, requiring an RFE accuracy of better than 1% is particularly strict, considering that the current estimate of effective radiative forcing for the aerosol-radiation interaction is −0.9 W m−2 with an uncertainty range of −1.9 to −0.1 W m−2 (Stocker 2013). However, the two criteria that n is measured with an accuracy <0.003 (0.2%) and κ < 0.0005 (1%) are used in this work as a threshold for assessing the accuracy of RI retrievals.
From ensemble CRDS extinction measurements for non-absorbing sodium nitrate aerosol at five discrete values of particle size, Mason and co-workers reported n values with an uncertainty of ± 0.02 (an error of 1.4%) (Mason et al. Citation2012). Miles et al. published a thorough review of the sources of errors and uncertainties in RI retrievals from E-CRDS measurements, and argued that errors in the measured particle number density can alone introduce an error of ∼2.5% in determined values of n for purely scattering compounds (Miles et al. Citation2011b). Meanwhile, Zarzana and co-workers performed a comprehensive theoretical study to assess the lower-bound estimates of errors in retrieved RIs from E-CRDS measurements on both non-absorbing and absorbing aerosol (Zarzana et al. Citation2014). In the case of non-absorbing ammonium sulfate aerosol, for which extinction measurements were performed at twelve discrete values of size, the error in the fitted n was ∼0.6%. For absorbing aerosol, such as brown carbon where κ = 0.05, the error in the fitted κ was ∼20%. These three studies put the precision of n retrievals from E-CRDS in the range of 0.6–2.5% for non-absorbing aerosol particles. Clearly these uncertainties are larger than the desirable threshold uncertainties discussed above.
We recently demonstrated that improvements in the precision of σext measurements can be achieved with the SP-CRDS method over what can be achieved by E-CRDS. The SP-CRDS instrument probes a single particle indefinitely confined in a Bessel laser beam (BB) optical trap. The BB optical trap is used to control and optimize the position of the single particle at the centre of a cavity ring-down beam for the direct measurement of σext. No measurement is required of particle number density and σext measurements are made with continuous variation in the particle size (as the particle evolves with time), as opposed to the measurement of σext values at a finite number of discrete particle sizes. In our measurements, the particle size is precisely determined from fitting recorded angular light scattering distributions to Mie theory. We have previously demonstrated measurements of σext with size variation, both for the evaporation of semi-volatile organic aerosol and for the hygroscopic response of aqueous droplets containing atmospherically-relevant inorganic solutes, to changes in relative humidity (RH). From SP-CRDS measurements of single component evaporation, the RI retrieval precision was 0.5–0.8% (Cotterell et al. Citation2015a; Mason et al. Citation2015). From SP-CRDS measurements of aqueous droplets containing atmospherically-relevant inorganic solutes, a forthcoming publication demonstrates the RI retrieval precision is ∼0.0025 (∼0.17%). This represents a substantial improvement in RI retrieval precision compared to the ±0.02 (∼1.4%) uncertainty of E-CRDS measurements on sodium nitrate by Mason and co-workers (Mason et al. Citation2012). However, the accuracy of the RI retrieved from SP-CRDS measurements remains to be assessed.
In this article, a combination of experimental measurements and numerical simulation is used to quantify the accuracy of RI determinations from SP-CRDS measurements on non-absorbing aerosol. We examine how this accuracy scales with particle size, size range over which measurements are made, and signal-to-noise ratio in measured cavity ring-down times. A new derivation is presented for the calculation of σext, which incorporates the effect of absorption for particles with κ ≠ 0. This extended analysis allows us to assess the scope of the instrument in determining both n and κ for absorbing aerosol. Section 2. describes experimental measurements of σext using SP-CRDS, followed by descriptions of our method for the numerical simulation of σext and the procedure for fitting the σext versus radius distributions. Sections 3. and 4. apply these numerical simulation methods to examine the RI retrieval accuracies for non-absorbing and absorbing aerosol particles, respectively.
2. Experimental and numerical methods
2.1. The 532-nm single particle cavity ring-down spectrometer
The SP-CRDS measurements are made at a fixed wavelength of the probe laser light, and components of the spectrometer such as the high reflectivity mirrors are chosen for optimum performance at that wavelength. We have therefore developed both a 532-nm and a separate 405-nm SP-CRDS instrument to compare RI measurements at different wavelengths. The measurements presented in this article used only the 532-nm SP-CRDS instrument; consequently, the parameters incorporated in numerical simulations are appropriate for this spectrometer. Our previous publications provide a detailed account of the 532-nm SP-CRDS apparatus, and only a brief description is given here (Cotterell et al. Citation2015b; Mason et al. Citation2015).
A 532 nm 5 W single mode cw-laser source was split into two arms using a polarization beam splitter (PBS) cube; the transmitted beam was used to generate a BB while the reflected beam was used for CRDS. The BB was generated by passing the transmitted 532-nm beam through an axicon to create a BB with a core diameter of ∼50 μm, which was reduced to ∼5 μm using a pair of spherical lenses and subsequently directed vertically upwards into a trapping cell using a 45° mirror. This mirror and the trapping cell were mounted on a translation stage. A gas flow of 100–200 cm3 min−1 of controlled RH was passed vertically downwards through the trapping cell, with the cell's RH measured using a calibrated capacitance probe. Aerosol was introduced into the trapping cell via a medical nebulizer and a single aerosol particle was confined in the core of the BB optical trap.
We will show in a forthcoming publication that the accuracies of the size and refractive index determinations from elastic light scattering measurements using a Bessel beam are significantly worse than those associated with measurements made using a Gaussian probe beam of wide beam waist. Therefore, a 473-nm probe laser beam with a Gaussian beam profile was aligned collinear to the BB propagation direction using a PBS cube. The λ = 473 nm light elastically scattered by the trapped particle was measured as a function of angle (phase function, PF) by recording PF images, captured using a high numerical aperture, long working distance objective coupled to a camera positioned at 90° with respect to the BB propagation direction. A laser line filter removed light at 532 nm to ensure only 473 nm light was collected. Fitting the PFs to Mie theory allowed determination of the particle radius and RI at λ = 473 nm, using the fitting algorithms and procedures described in Cotterell et al. (Citation2015a,Citationb) and Preston and Reid (Citation2015).
In the trapping cell, the core of the BB was intersected at 90° by the 532-nm CRDS beam. The arm of the 532-nm cw-laser used for CRDS was first passed through an acousto-optic modulator (AOM). The use of a Coherent Verdi V5 single mode cw-laser source is an ideal choice for providing stability and accuracy in the CRD measurements due to is narrow laser linewidth (<5MHz) and excellent wavelength stability. The first-order diffraction spot was injected into an optical cavity consisting of two highly reflective mirrors with reflectivities greater than 0.9998 at 532 nm. These mirrors, with radii of curvature of 1 m and separated by a distance (L) of 0.5 m, were aligned such that the TEM00 mode was preferentially excited and higher order modes had low coupling efficiencies. Light coupled into the optical cavity most efficiently when the cavity length was exactly an integer number of wavelengths, i.e., when a standing wave was formed. Thus, the length of the cavity was modulated over several free spectral ranges by fixing one mirror to a piezo-electric transducer driven by a 20 V amplitude triangular waveform. The build-up of light intensity inside the optical cavity was monitored using a photodiode positioned behind the last mirror of the cavity, and recorded as a voltage which was sent to both a Compuscope 12-bit digitizer and a digital delay generator. When the voltage recorded by the photodiode reached 1 V, the digital delay generator sent a TTL pulse to the AOM, forcing the first-order diffraction spot to extinguish and initiating a ring-down decay. This ring-down decay was fitted to a single exponential function, with the characteristic decay time referred to as the ring-down time (RDT, τ). Values of τ were measured at 5–10 Hz. For an empty cavity, the RDT is denoted by τ0, and had a mean value of 25 µs and a Δτ = 0.04 μs standard deviation (Δτ/τ0 = 1.6 × 10⁻³).
The single aerosol particle captured in the BB was positioned at the centre of the TEM00 mode in both dimensions orthogonal to the CRDS beam axis, horizontally by adjustment of the micrometer translation stage on which the trapping cell and mirror were mounted and vertically by variation of the power of the 532-nm laser generating the BB. The particle extinguished a small fraction of light (through both scattering and absorption) upon each pass of the CRDS beam through the cavity, causing more rapid ring-down decays than for an empty cavity and a reduction in the value of τ. The ring-down time was minimized when the particle was located at the centre of the TEM00 mode. From knowledge of τ and τ0, σext is calculated using Equation (Equation1[1] ), in which L is the length of the optical cavity (i.e., the separation of the two cavity mirrors) and c is the speed of light, provided the focal beam waist, w, of the TEM00 mode is known (Butler et al. Citation2007; Walker et al. Citation2013). Although w can be predicted using geometric optics (Kogelnik and Li Citation1966) and is expected to be 271 μm for a symmetric cavity consisting of two mirrors with radius of curvature of 1 m separated by 0.5 m and excited at 532 nm, it is treated as a fitting parameter in all σext simulations.
[1]
2.2. Generation of simulated ring-down time data sets
To assess the detection limits and RI determination accuracy from SP-CRDS measurements, σext data sets were simulated for a known value of m using the parameters and typical noise levels appropriate to the 532-nm SP-CRDS instrument. Simulating σext data sets requires that the interaction of aerosol particles with the intra-cavity ring-down beam be quantified. Mie theory fully describes the interaction of a travelling plane wave with a spherical particle. However, the light of the intra-cavity ring down beam in an SP-CRDS experiment is a standing wave. As explained in our previous publications (Miller and Orr-Ewing Citation2007; Cotterell et al. Citation2015a; Mason et al. Citation2015, Citation2014), the measured σext value for a particle located at a node or anti-node of the intra-cavity standing wave differs from the value predicted by Mie theory. Moreover, a particle confined in the core of a BB optical trap can move via Brownian motion along the longitudinal axis of the optical cavity over distances of micrometres, sampling several nodes and anti-nodes of the standing wave and the various phases in-between. Therefore, the standing wave leads to a broadening in the measured σext, with the limits in the recorded data corresponding to the particle located at either a node or anti-node. Miller and Orr-Ewing accounted for the effect of a standing wave on particle light scattering, a theory referred to hereafter as cavity standing wave (CSW) Mie theory (Miller and Orr-Ewing Citation2007). They derived an expression for σsca and considered the case of σext = σsca for κ = 0, allowing the extinction cross section to be extracted from SP-CRDS measurements for nonabsorbing aerosol.
CSW Mie theory was used to simulate the expected boundaries in σext as a function of radius corresponding to the two limiting cases of a particle centered on either a node or an anti-node of the intra-cavity standing wave. A particle moving via Brownian motion inside the BB core is likely to sample the various phases of the intra-cavity standing wave equally. Thus, the space between these two limiting simulations was populated with N equally spaced data points within a given radius interval. The simulations were performed in particle radius steps of 0.1 nm with N = 20, resulting in a data point density, ρ, of 200 nm−1 which is a representative value of ρ for measurements made on the 532-nm SP-CRDS instrument. shows an example of the simulated CSW Mie envelope for a particle with m = 1.475 + 0i evaporating from 300 to 200 nm in radius, with the inset emphasizing the even population of this envelope with σext data points.
Figure 1. (a) Simulated boundaries in σext (solid black lines) from CSW Mie theory for the limiting cases of a particle centered on a node or an anti-node for m = 1.475 + 0i. The space between these two limiting cases is populated with evenly spaced data points (circles, red). (b) The corresponding variation in τ calculated from the simulated σext using Equation (Equation1[1] ). (c) The variation in the simulated τ with particle radius, with noise superimposed on τ with standard deviation Δτ = 0.04 μs and on the particle radius with Δa = 2 nm.
![Figure 1. (a) Simulated boundaries in σext (solid black lines) from CSW Mie theory for the limiting cases of a particle centered on a node or an anti-node for m = 1.475 + 0i. The space between these two limiting cases is populated with evenly spaced data points (circles, red). (b) The corresponding variation in τ calculated from the simulated σext using Equation (Equation1[1] ). (c) The variation in the simulated τ with particle radius, with noise superimposed on τ with standard deviation Δτ = 0.04 μs and on the particle radius with Δa = 2 nm.](/cms/asset/154d37cc-9963-4c69-86ec-c531d610c94f/uast_a_1219691_f0001_oc.gif)
Equation (Equation1[1] ) was used to convert the generated σext data points to values of τ, assuming the optical cavity parameters of the 532-nm SP-CRDS instrument, i.e., L = 0.5 m, τ0 = 25 μs and w = 275 μm. Although w is predicted to be 271 μm from Gaussian optics (Kogelnik and Li Citation1966), previous experimental measurements place the value between 276 and 283 μm depending on the optical alignment of the cavity (Mason et al. Citation2015), so w = 275 μm was chosen as a compromise between experiment and theory. shows the τ variation with particle radius for the corresponding σext data in . In 532-nm SP-CRDS experiments, the standard deviation in the recorded τ is typically Δτ = 0.04 μs. Therefore, a random number generator created values between −0.10 and +0.10 that were added to the calculated τ values to simulate experimental noise. The range −0.10–0.10 was chosen to give a standard deviation of Δτ = 0.04 μs and Δτ/τ0 = 1.6 × 10⁻³. A second random number generator was used to impose a 2 nm uncertainty on the radius, Δa, for each data point; we justify this level of uncertainty in Section 3.1. presents the simulated τ data corresponding to the same data in and with noise Δτ and Δa superimposed.
In data sets simulating measurements on evaporating single component aerosol, the RI was constant (m = n0). In data sets simulating the hygroscopic response of inorganic aerosol, n varied with particle size and was described using Equation (Equation2[2] ), where n532,1 and n532,2 dictate the variation in n with radius (Cotterell et al. Citation2015a,Citationb; Preston and Reid Citation2015).
[2]
2.3. Fitting data to CSW Mie theory for assessment of RI retrieval accuracy
The simulated RDT data sets were fitted to CSW Mie theory for the determination of refractive index, using the same fitting procedures that we have described in previous publications for fitting experimental data sets (Cotterell et al. Citation2015a,Citationb). In this way, the RI determination accuracy was quantified by comparison of the best-fit n532 to the n532 input to the RDT data set simulator. When fitting to CSW Mie theory, the CSW Mie envelope of σext was calculated in 1 nm radius steps. Computational time constraints permitted variation of only three parameters in fitting to the ‘measured’ (simulated) σext. In the case of data sets simulating single component evaporation, the beam waist (w), constant RI (n0) and a radius offset (Δa) were varied. The radius offset parameter is a value that is added to all the radius values for a RDT versus radius data set, and has the same definition as the radius offset parameter that was varied in Refs. (Mason et al. Citation2015) and (Cotterell et al. Citation2015a). In the case of data sets simulating a hygroscopic response measurement, w, n532,1 and n532,2 were varied. A residual function, R, was defined by evaluating Equation (Equation3[3] ), where the data points included in the summation were only those with values of σext that resided outside the CSW Mie envelope. In this equation, σsim is the closer of the node or anti-node centered simulation values at the given radius.
[3]
A weighting factor, ρj, is the density of the measured σext data points within a 1 nm range of the particle radius. This weighting factor prevents biasing of the fit to regions where the measured number of data points is high in the radius domain. Although the data point density is constant in the time domain in experimental data sets, there can be large fluctuations in the radius domain (in experimental measurements) if the aerosol particle's environment changes in a nonlinear fashion. The value of R was then minimized by varying the fit parameters described above.
3. Accuracy of determined refractive index for non-absorbing aerosol
We have previously estimated the corresponding particle radius for the minimum detectable σext to be 110 nm for our 532-nm SP-CRDS instrument (Cotterell et al. Citation2015b). This estimate was made by applying analytical expressions commonly used to assess the detection limits of optical cavities. However, this analysis neglected the influence of the intra-cavity standing wave on broadening the measured RDTs. Therefore, in Section 1 of the online supplementary information (SI), we report a simulation of RDTs for accumulation mode aerosol and determine the minimum detectable radius to be within the range of 135–157 nm, depending on the particle RI. These values are well within the accumulation mode regime of interest. Although this suggests that σext measurements can be made for particles with sub-500 nm radii, the accuracy of RI determinations in this size regime has not been established. The following sections consider the accuracy of RI determinations, for single component evaporation and hygroscopic response measurements, and for multiple size ranges spanning coarse, fine and accumulation mode regimes.
To examine the accuracy of RI determinations, simulated ring-down time and radius data as a function of time are used to mimic an experimental measurement. RDT values simulated for various particle radii are converted to the time domain by assuming an evaporation rate of 0.1 nm s−1, a typical rate of size change in our SP-CRDS measurements. A simulated data set is generated and the data are fit to CSW Mie theory as described in Section 2.3. to establish the RI determination accuracy. These assessments of RI accuracy are made for particles evaporating over three different size regimes: a coarse mode regime (2000–1000 nm radius); a fine mode regime (1000–500 nm radius); and an accumulation mode regime (300–200 nm). Within each size regime, the analysis is performed for particles with a constant RI (to represent a single component evaporation measurement) and for particles with an RI varying with particle radius (to represent a hygroscopic response measurement). The analysis also incorporates the influence of errors in the determined radius.
3.1. Coarse mode particles
Two different ranges are considered within the coarse mode regime, influenced by our experimental studies spanning the 1000–2000 nm radius range (Cotterell et al. Citation2015a; Mason et al. Citation2015). RDT and radius data were simulated for particles evaporating over the full 1000–2000 nm radius range. Hygroscopic response measurements were simulated over the reduced size range typically observed in experimental studies (Cotterell et al. Citation2015a,Citationb; Mason et al. Citation2015). For an aqueous droplet containing NaNO3, the size varies between ∼1050–1450 nm and, thus, RDT and radius data were simulated for this range.
3.1.1. Quantifying the uncertainties in the determined radius
The simulated data were generated using the method outlined in Section 2.2, with a random error of ±2 nm superimposed on the particle radius data; we first confirm that this is an appropriate uncertainty to introduce in the simulation. shows the radius (ameas, black data points) evolution with time for a coarse mode 1,2,6-hexanetriol aerosol particle. The evaporation is expected to be smooth and continuous with time; the Maxwell mass flux equation (Krieger et al. Citation2012) predicts that the radius-squared variation with time is linear. Thus, a polynomial is fitted to the measured radius data of the form of Equation (Equation4[4] ) in which b0, b1, b2 are fitting parameters.
Figure 2. (a) The measured radius (ameas, black points) as a function of time for an evaporating 1,2,6-hexanetriol droplet. The data were measured using the 532-nm CRDS instrument and the radius was determined from PFs recorded for elastically scattered light from a 473 nm Gaussian beam. The line (blue) shows a fit through the measured points of the form of Equation (Equation4[4] ), representing the predicted radius, apred, variation with time. (b) The absolute residual, |amea s −apred|, variation with time (black points). The solid (red) line is to guide the eye only.
![Figure 2. (a) The measured radius (ameas, black points) as a function of time for an evaporating 1,2,6-hexanetriol droplet. The data were measured using the 532-nm CRDS instrument and the radius was determined from PFs recorded for elastically scattered light from a 473 nm Gaussian beam. The line (blue) shows a fit through the measured points of the form of Equation (Equation4[4] ), representing the predicted radius, apred, variation with time. (b) The absolute residual, |amea s −apred|, variation with time (black points). The solid (red) line is to guide the eye only.](/cms/asset/33775dae-4e9e-4d17-87db-76053966cf3c/uast_a_1219691_f0002_oc.gif)
shows the variation in the absolute residual between the measured and fitted radius, |ameas − apred|, with time. Clearly, there are some large deviations in the measured radius, with the largest fluctuation having a value of ∼12 nm. The mean of the temporal variation in the absolute residual is 1.70 ± 1.54 nm, where the error represents one standard deviation. The mean deviation of 1.70 nm justifies our inclusion of a ±2 nm uncertainty on the determined radius.
In practice, such random fluctuations in particle radius can be smoothed prior to fitting the RDT variation with radius to CSW Mie theory. However, sustained and systematic deviations in radius over tens of seconds cannot be smoothed and still be expected to give a reliable representation of the true radius evolution. The inset of shows the radius oscillating to higher and lower values about the model prediction. Thus, in some of the simulations discussed here, sinusoidal oscillations were superimposed on the determined radius. The amplitude of these oscillations was taken as the mean absolute residual in (1.70 nm) plus two standard deviations (2 × 1.54 nm), which gives a value of 4.78 nm. Hence, a 5 nm amplitude was used in the simulations. The frequency of the oscillations was 6.25 × 10⁻³ nm−1, i.e., a full oscillation for every 160 nm change in size. Moreover, some simulations applied a systematic +5 nm offset to the radius data. This additional factor can represent the effect of an incorrectly assigned angular range when fitting the 473-nm PFs or the effect of systematic objective aberrations on the measured images.
3.1.2. Input RI parameters for single component evaporation and hygroscopic response simulations
In the simulations representing single component evaporation, the constant real RI, n0, was set to 1.475, while the imaginary RI, κ, was set to zero. For simulations of hygroscopic response, the RI was described using Equation (Equation2[2] ) with n532,1 = 2 × 10⁸ nm3 and n532,2 = −5 × 10¹⁶ nm6. These values are typical for an aqueous droplet containing NaNO3, with an RI of ∼ 1.36 at high RH increasing to ∼1.48 at low RH. In re-fitting to CSW Mie theory, the constrained search space for w was between 270.0 and 280.0 μm in steps of 0.1 μm. For data sets representing single component evaporation, the search range for n0 was 1.4700 and 1.4800 in steps of 0.0001 and the particle radius offset was varied from −10.0 to +10.0 nm in steps of 0.1 nm. For fitting hygroscopic response data sets, n532,1 was varied between 1.5 × 10⁸ and 2.5 × 10⁸ nm3 in steps of 1 × 10⁶ nm3 and n532,2 was varied between −7 × 10¹⁶ and −1 × 10¹⁶ nm6 in steps of 1 × 10¹⁵ nm6.
3.1.3. RI retrieval accuracy for particle radii between 1000–2000 nm
summarizes the best-fit parameters and RI retrieval accuracy for measurements on coarse mode particles, for ten simulated RDT data sets. For a single component particle evaporating from 2000 to 1000 nm, with a +5 nm systematic offset applied to the radius, the fitting to CSW Mie theory correctly finds that a value of Δa = −5.0 nm is required for the best-fit solution. The best-fit n0 is 1.4751 and the accuracy of the fit (defined as the difference between the input value of n0 and the fitted value) is 0.0001. Superimposing 5 nm sinusoidal oscillations on the radius has little effect on the RI retrieval accuracy. shows that these oscillations have a clear effect (most apparent in the inset) on the ability of the fitting to match the resonance peak locations in the simulated data. However, the large size range spanned by the droplet, passing through many resonances in σext, ensures the RI retrieval accuracy remains high (0.0002). Therefore, in RI determinations for 1,2,6-hexanetriol presented in previous publications (Cotterell et al. Citation2015a; Mason et al. Citation2015, Citation2014), the RI can be expected to be measured with an accuracy of 0.0002 (in the absence of other systematic errors such as impurities in the droplet composition).
Figure 3. The best-fit of simulated σext data (points, red) to CSW Mie theory (lines, black) for a data set representing the evaporation of single component aerosol over the radius range 1000–2000 nm. The constant n532 input to the data simulations was set to 1.475. The radius for the simulated data had 5 nm sinusoidal oscillations superimposed on the true radius evolution.
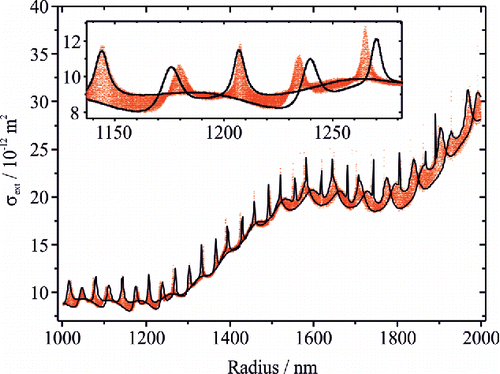
Table 1. Description of the 10 simulations used to assess the accuracy of RI retrievals from 532-nm SP-CRDS measurements on coarse mode particles.
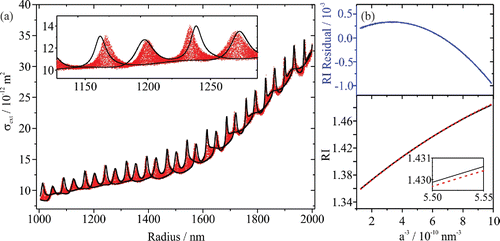
For simulations of hygroscopic response measurements, the RI is correctly retrieved (within the precision of the aforementioned step sizes of n1 and n2) when the radius is assumed to be determined perfectly. When 5 nm sinusoidal oscillations are superimposed on the radius, the RI retrieval accuracy is degraded only slightly. shows the result of the best-fit to CSW Mie theory; the figure inset emphasizes mismatches between the resonance peak positions in the simulated σext data and the best-fit CSW Mie envelope. compares the input and best-fit RI variation with a−3, with the residual between the two curves, Δn = nactual − nfit, also shown. The mean of the absolute residual, , over the whole measurement is 0.0003 (±0.0002), where the uncertainty is one standard deviation in the absolute residual. The corresponding values are quoted in the “Determined RI Accuracy” column of for various simulated data sets representing hygroscopic growth measurements.
Figure 4. (a) The best-fit CSW Mie envelope (lines, black) to simulated data (points, red) for a particle evaporating from 2000 to 1000 nm, where the RI is varying with radius. Prior to fitting the theoretical data to CSW Mie theory, 5 nm sinusoidal oscillations were superimposed on the radius data. (b) The actual RI (black line) used in simulating the σext data in (a) and the corresponding RI for the best-fit CSW Mie envelope (dashed line, red). In the top panel, the line (blue) shows the residual nactual-nfit.
A final simulation was performed with a +5 nm systematic offset applied. The RI retrieval accuracy is degraded significantly to 0.0031 (±0.0009), a consequence of the lack of an adjustable radius offset in the three-parameter fit when fitting hygroscopic response data. The poorer accuracy (>0.2% deviation) of this RI retrieval is significant and is comparable to the 0.003 threshold set in Section 1. A fitting program with four variable parameters including a radius offset might resolve this problem. However, systematic offsets to the particle radius as large as 5 nm are not expected to occur from fitting PFs: the angular range is treated as an adjustable parameter when fitting PFs and polarization filters ensure the correct polarization is imaged, but objective aberrations are a potential source of systematic error.
3.1.4. RI retrieval accuracy for particle radii between 1050–1450 nm
summarizes the outcomes of five simulations of the type described above but performed over the radius range of 1050–1450 nm (Cotterell et al. Citation2015a; Mason et al. Citation2015). For data sets representing single component evaporation, the RI retrieval accuracy is the same as for the 1000–2000 nm radius range and a sufficient number (twelve) of resonance peaks in σext over the radius range 1050–1450 nm facilitates accurate RI retrieval.
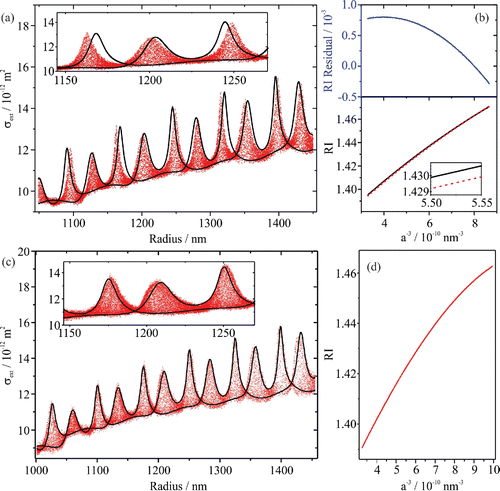
For simulations representing hygroscopic response measurements, the RI is correctly retrieved when the particle radius is assumed to be determined perfectly, the same outcome as for the simulation over the radius range 1000–2000 nm. When 5 nm sinusoidal oscillations are superimposed on the radius data, the RI retrieval accuracy is degraded to 0.0006 (±0.0002). shows the best-fit to CSW Mie theory for this analysis, with the best-fit RI, input RI and residual shown in . The accuracy of this retrieval remains much better than the desired 0.0030 threshold level. shows an actual experimental example of the σext variation with radius for a typical measurement on a NaNO3 particle, and shows the best-fit RI variation with radius. Comparison of and confirms that the parameters used in the simulations generate simulated data that are very similar to experiment. The 5 nm sinusoidal oscillations superimposed on the radius in the simulations exaggerate the uncertainty in the measured radius data. Therefore, an accuracy of 0.0006 (±0.0002) represents a conservative estimate of the RI determination accuracy for 532-nm SP-CRDS measurements on coarse mode, hygroscopic NaNO3 aerosol. When a +5 nm systematic offset is superimposed on the radius data in the simulations, the RI retrieval accuracy is almost two times poorer than for the corresponding 1000–2000 nm data set. This degradation is likely to be a consequence of the smaller number of resonance peaks observed in the 1050–1450 nm radius range. This analysis further indicates the possible importance of incorporating the radius offset as a fourth fitting parameter for hygroscopic growth measurements, although such large systematic offsets to the radius are not expected to occur in PF measurements.
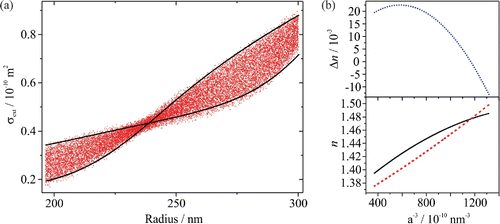
Figure 5. (a) The best-fit CSW Mie envelope (lines, black) to simulated σext data (points, red) for a particle evaporating from 1450 to 1050 nm and an RI varying with particle radius. Prior to fitting the data, 5 nm sinusoidal oscillations were superimposed on the radius data. (b) The actual RI (line, black) used in generating the data points in (a) and the corresponding RI for the best-fit CSW Mie envelope (dashed line, red). The line (blue) shows the residual nactual − nfit. (c) Experimental measurement of the varying σext with particle radius for a NaNO3 particle (points, red) and best-fit CSW Mie envelope (lines, black), with the corresponding best-fit RI shown by the line (red) in (d).
3.2. Fine mode particles
Two different size ranges are considered within the fine mode regime: 1000 to 500 nm and 900 to 700 nm. This latter range is chosen because it corresponds to initial experimental measurements (presented in this section) on fine mode hygroscopic inorganic particles. The same variety of offsets and perturbations reported in Section 3.1. were superimposed on the simulated radius data. Errors in the experimentally determined radius from PF measurements are expected to increase with decreasing particle size. However, our estimates of 5 nm systematic errors in particle radius retrieval for course mode particles were conservative estimates and the level of precision in radius retrieval for fine mode particles (where a remains larger than the 473 nm probe beam wavelength) are not expected to be significantly different to that observed for coarse mode particles. Therefore, we retained the 5 nm offsets and oscillation amplitudes to allow direct comparison to the coarse mode analysis.
3.2.1. Input RI parameters for single component evaporation and hygroscopic response simulations
In simulations representing the evaporation of single-component aerosol, the RI was set to m = 1.475 + 0i. In simulations representing hygroscopic response measurements, the RI was described using Equation (Equation2[2] ) with n1 = 2 × 10⁷ nm3 and n2 = −5 × 10¹⁴ nm6. The RI parameters for the hygroscopic response simulations are different to those used in the coarse mode simulations, with the values of n1 and n2 dependent on the particle size range of a particular measurement. In fitting to CSW Mie theory, the search space for w was between 265.0 and 285.0 μm in steps of 0.1 μm, while the n0 search range was between 1.4000 and 1.5500 in steps of 0.0001 for data sets representing single component evaporation. The radius offset was varied from −20.0 to 0.0 nm in steps of 0.1 nm. For data sets representing hygroscopic response measurements, the search space for w was the same as above, while n532,1 was varied from 1.00 × 10⁷ to 2.50 × 10⁷ nm3 in steps of 1 × 10⁵ nm3 and n532,2 was varied from −2.0 × 10¹⁵ to 2.5 × 10¹⁵ nm6 in steps of 1 × 10¹³ nm6.
3.2.2. RI retrieval accuracy for particle radii between 500–1000 nm
summarizes the best-fit parameters and RI retrieval accuracy for ten simulated RDT data sets. For a single component particle evaporating over the full 1000 to 500 nm radius range, with a +5 nm systematic offset applied to the radius, the accuracy in the determined RI is 0.0004 (0.027% of the true RI). This level of accuracy is poorer than for the corresponding coarse mode simulations, but still significantly better than the desired accuracy level of <0.2% of the true RI. When 5 nm oscillations are superimposed on the radius data, the RI accuracy degrades to 0.0015 (0.1% of the true RI). Although this retrieval remains within the desired accuracy level of 0.2%, artificial perturbations in the determined radius are more detrimental to measurements on fine mode than coarse mode particles. Even when a single-component fine mode particle evaporates over a larger radius range (e.g., the particles evaporating over 500 nm in ) than a coarse mode particle (e.g., the particles evaporating over 400 nm in ), the RI retrieval accuracy is better for coarse mode particles. Size-dependent structures in the measured σext are broader and more widely spaced for the smaller particles, limiting the retrieval accuracy for fine mode particles.
Table 2. Description of the 10 simulations used to assess the accuracy of RI retrievals from 532-nm SP-CRDS measurements on fine mode particles.
As an example, shows the best-fit CSW Mie simulation to σext data generated for a single component particle evaporating from 1000 to 500 nm with both a +5 nm systematic offset and 5 nm sinusoidal oscillations superimposed on the radius data. shows how the normalized residual function, R (Equation (Equation3[3] )), varies with Δa and n0. This contour plot exhibits a well-defined minimum which is elliptical in shape; the dashed line highlights the major axis of this ellipse and the intersecting solid lines show the best-fit values of Δa and n0. The dashed line has a slope and intercept of −0.0016 nm−1 and 1.4669, respectively. Extrapolating this line to Δa = −5 nm (i.e., the value required to counter the +5 nm offset input to the σext generation) locates a value of n0 = 1.4749 (accurate to within 0.007% of the true RI). Therefore, the fitted value of Δa is compensating for the larger n0 that minimizes the residual function. Nevertheless, it remains important to use Δa as a fitting parameter; if the radius offset were not varied (Δa = 0), the RI retrieval accuracy is 0.55%, which is worse than both the accuracy when Δa is floated (0.1%) and the desired 0.2% accuracy limit.
Figure 6. (a) The best-fit CSW Mie envelope (lines, black) to simulated σext data (points, red) for a particle evaporating from 1000 to 500 nm with m = 1.4750 + 0i. The input radius had 5 nm oscillations superimposed on the true radius evolution. (b) Contour plot showing the variation in the normalized residual function, R (Equation (Equation3[3] )), with varying fit parameters of radius offset Δa and refractive index n0.
![Figure 6. (a) The best-fit CSW Mie envelope (lines, black) to simulated σext data (points, red) for a particle evaporating from 1000 to 500 nm with m = 1.4750 + 0i. The input radius had 5 nm oscillations superimposed on the true radius evolution. (b) Contour plot showing the variation in the normalized residual function, R (Equation (Equation3[3] )), with varying fit parameters of radius offset Δa and refractive index n0.](/cms/asset/5dcdaca8-9a6e-426f-8c92-259427ff7c0b/uast_a_1219691_f0006_oc.gif)
reports the best-fit parameters and RI retrieval accuracy for three simulated data sets representing hygroscopic response measurements in the particle radius range of 500–1000 nm. When no errors are superimposed on the radius data, the RI is determined with a mean absolute residual (RI accuracy) of 0.0002 (±0.0001), where the error represents one standard deviation in the absolute residual. When 5 nm radius oscillations are superimposed, the RI retrieval accuracy is degraded to 0.0007 (±0.0001). When only a +5 nm offset is applied to the radius data, the determined RI accuracy is degraded to 0.0024 (±0.0007). The incorporation of a radius offset parameter when fitting hygroscopic response data might improve this retrieval accuracy, but at the expense of longer computational time. Nevertheless, systematic offsets to the radius as large as 5 nm are not expected and simulations with 5 nm oscillations superimposed on the radius data are more representative of typical experimental measurements.
3.2.3. RI retrieval accuracy for particle radii between 700–900 nm
also shows the results of fitting simulated σext data sets for particles evaporating from a radius of 900 to 700 nm. For data sets representing single component evaporation, the determined RI accuracy is 0.0060 (0.4%) when only a +5 nm linear offset is superimposed on the true radius and is 0.0262 (1.78%) when both a +5 nm linear offset and 5 nm sinusoidal oscillations are superimposed. In both cases, the fitted value of Δa compensates for larger n0 to minimize the normalized residual function, and the accuracy with which the RI is determined is worse than the desired 0.2%. Unless a single component, fine-mode particle evaporates over the wider 1000 to 500 nm radius range, the RI retrieval accuracy will not be sufficient unless the uncertainty in particle radius determination is better than 5 nm. Improvement in the precision of the CRDS measurement (Δτ/τ0) may also improve the RI retrieval accuracy, although a further discussion of this point is deferred to later.
As reported below, our initial hygroscopic response measurements using SP-CRDS for fine mode particles were over the radius range 700–900 nm. For CSW Mie theory fits to σext data generated over this size range, the RI accuracy is 0.0009 (±0.0008) when 5 nm sinusoidal oscillations are superimposed on the radius data, and is 0.0052 (±0.0012) when a +5 nm systematic offset is instead added to the radius data. Therefore, RI determinations for hygroscopic particles evaporating from 900 to 700 nm are susceptible to systematic errors in the determined radius and the RI retrieval accuracy may be poorer than the desired upper limit of 0.003.
For comparison, measurements of σext were performed for NaNO3, (NH4)2SO4 and NH4HSO4 aerosol; representative data sets and best-fit CSW Mie envelopes are shown in –c. These data sets represent the first comprehensive SP-CRDS measurements on fine mode particles. The droplet radii varied within the range from ∼880–630 nm. For each data set, the variation in the fitted RI (nfine) is compared with measurements from several coarse mode particles (ncoarse). The coarse mode n532 values (and their corresponding envelopes) represent averages (one standard deviation) for measurements of 4–5 droplets with radii >1 μm and can be regarded as a reliable representation of the true RI; the analysis presented in Section 3.1. shows that the expected accuracy for these coarse mode measurements is ∼0.0006 (±0.0002).
Figure 7. The best-fit CSW Mie envelopes (lines, black) to experimentally measured σext data (points, red) for fine mode particles containing the hygroscopic inorganic solutes NaNO3, (NH4)2SO4 or NH4HSO4. Shown alongside each data set are the corresponding variation in the best-fit RI, nfine, (points, black) compared against the determined RI variation from measurements on coarse mode particles, ncoarse, (points, green, with error envelope where the envelope represents one standard deviation in measurements over several droplets). The points (blue) in the plot of residuals represent Δn = ncoarse − nfine, with the magnitude and standard deviation in quoted.
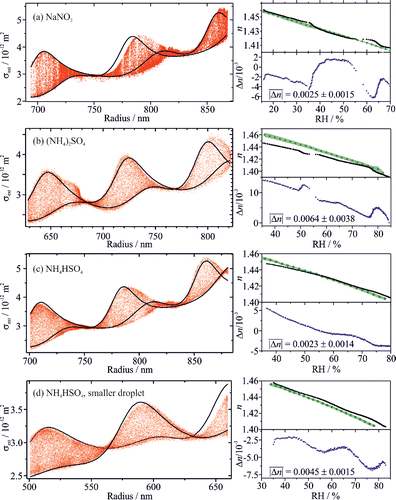
also reports the residual Δn = ncoarse−nfine for each data set on an expanded scale. The values of for the data sets in are in the range of 0.002 to 0.006. This is within the range of
found from the fine mode (900–700 nm radius) simulations for hygroscopic particles which indicate an expected accuracy as large as 0.0052 (±0.0012) in the case of a + 5 nm offset superimposed on the radius data. It is clear that the largest deviations in the nfine from the more reliable ncoarse are larger than the desired threshold of 0.003. Therefore, with the current level of Δτ/τ0 and accuracy of radius determination from PFs, it is not possible to retrieve the RI to the desired accuracy for fine mode particles. shows the best-fit of CSW Mie theory to measured σext data for a NH4HSO4 droplet evaporating from ∼ 660 to 500 nm in radius, i.e., at the lower end of the fine mode regime and approaching the accumulation mode. The value of
from comparison to coarse mode data is 0.0045 (±0.0015). This level of accuracy (∼0.3%) remains better than typical ensemble measurements; Zarzana et al. (Citation2014) estimated the level of accuracy as 0.6%, while Miles et al. (Citation2011b). predicted at 2.5% level of accuracy when considering the systematic errors in particle sizing only. The accuracy of fine mode SP-CRDS measurements is, however, outside the desired level of 0.003 (0.2%). Although not markedly different to the accuracy measured for the larger fine mode particles, the accuracy is expected to degrade significantly for radii <500 nm. This expectation is now investigated further by study of accumulation mode particles.
3.3. Accumulation mode particles
reports the outcomes of analysis of five data sets simulated to assess the RI retrieval accuracy from σext measurements on accumulation mode particles, evaporating over the radius range 200–300 nm. For simulations representing single component evaporation, the RI was set to m = 1.475 + 0i, while for simulations of hygroscopic growth, the RI was described using Equation (Equation2[2] ) in which n1 = 1.8 × 10⁶ nm3 and n2 = −5.0 × 10¹² nm6. For consistency, linear offsets and sinusoidal oscillations with the same 5 nm magnitude were superimposed on the determined radius, although the errors in the determined radius from fitting 473-nm PFs are expected to be larger for radii <500 nm. It is important to note that the exact magnitude of radius errors from particle sizing using phase function measurements is not known because of the lack of independent measurements alongside the PF determinations with which to assess the uncertainties for accumulation mode aerosol.
Table 3. Description of the 10 simulations used to assess the accuracy of RI retrievals from 532-nm SP-CRDS measurements on accumulation mode particles.
For a single component particle, when only a systematic + 5 nm radius offset is applied, the RI retrieval accuracy is 0.0059 (0.4% of the actual RI). Superimposing 5 nm sinusoidal oscillations on the radius degrades the RI retrieval accuracy to 0.147 (10% of actual RI). Even with these modest uncertainties in the determined radius, the RI retrieval accuracy is poor and lies outside the desired accuracy of 0.2% of the true RI.
For hygroscopic response measurements, the is 0.0055 (±0.0006) when no sizing error is applied. This level of accuracy degrades to 0.0177 (±0.0062) when 5 nm sinusoidal oscillations are superimposed on the radius data, with showing that the best-fit CSW Mie envelope encompasses most of the generated σext data points even though the fitted variation in n is markedly different to the actual variation. When only a +5 nm systematic offset is superimposed on the radius data, the RI accuracy is further degraded to 0.0228 (±0.0027). We attribute this poor retrieval to the absence of sharp structure in the size-dependent σext in this small particle regime.
Figure 8. (a) The best-fit CSW Mie envelope (lines, black) to theoretical σext data (points, red) simulated for a particle evaporating from 300 to 200 nm, where the RI is varying with radius. Prior to fitting, a 5 nm sinusoidal oscillation was superimposed on the radius data. (b) The actual RI (solid line, black) used in generating the data in (a) and the corresponding RI for the best-fit CSW Mie envelope (dashed line, red). The dotted line (blue) shows the residual nactual − nfit.
Progressively reducing both the size and the size range of particles probed by SP-CRDS increasingly degrades the RI retrieval accuracy. Furthermore, the retrieved RI becomes increasingly sensitive to errors in the determined radius. The 532-nm SP-CRDS instrument with its current level of Δτ/τ0 performance cannot be used to determine the RIs of accumulation mode particles accurately. Even in the case of perfect determination of the particle radius, the RI retrieval accuracy is 0.0055 (±0.0006) for a hygroscopic response simulation. Although this ∼0.4% error in the RI is better than the 0.6% and 2.5% errors suggested by Zarzana et al. (Citation2014) and Miles et al. (Citation2011b), respectively, for ensemble CRDS measurements, this error is too poor for RI retrievals to inform accurate radiative forcing calculations. Therefore, two problems need to be addressed to determine the RI for accumulation mode particles. First, the variation in the RI retrieval accuracy with Δτ/τ0 needs to be quantified, and Δτ reduced to a level which should, in principle, allow accurate RI determinations. Second, a method needs to be developed to reduce the errors in the experimentally determined particle radius. The former problem can be analyzed by simulating σext data for different levels of Δτ/τ0. Re-fitting the data to CSW Mie theory allows the variation in the RI retrieval accuracy with Δτ/τ0 to be assessed. The second problem is best addressed by experimental design.
3.3.1. Variation in RI retrieval accuracy with instrument performance
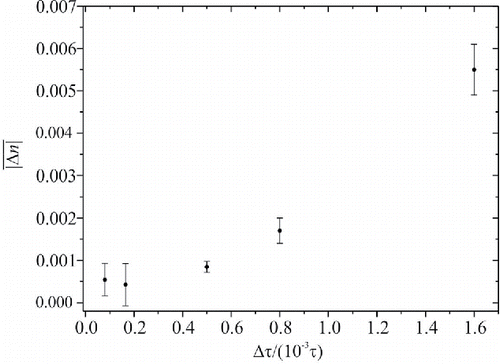
Simulated σext data sets were generated for hygroscopic particles evaporating from a radius of 300 to 200 nm using the RI parameters reported above. No systematic errors were superimposed on the radius data. Data sets were generated for five different values of Δτ/τ0. The current 532-nm SP-CRDS instrument has Δτ = 0.04 μs (one standard deviation) for an empty cavity RDT τ0 = 25 μs, i.e. Δτ/τ0 = 1.6×10⁻³. The other four values of Δτ/τ0 tested were 8.0 × 10⁻⁴, 5.0 × 10⁻⁴, 1.65 × 10⁻⁴ and 8.0 × 10⁻⁵. These five simulated data sets were fitted using CSW Mie theory and the RI retrieval accuracy was calculated. shows the variation in with Δτ/τ0. From a linear interpolation between the points corresponding to Δτ/τ0 values of 1.6 × 10⁻³ and 8.0 × 10⁻⁴, the required Δτ/τ0 for a mean RI accuracy of 0.003 is found to be 1.12 × 10⁻³, although a reduction of Δτ/τ0 to below 1 × 10⁻³ is recommended. For τ0 = 25 μs, this corresponds to a reduction in Δτ from the current value of 0.04 μs to 0.025 μs, i.e., a reduction in the RDT uncertainty by approx. 38%, which should be readily achievable by improvements to the instrument. Δτ/τ0 can be improved by increasing the value of τ0 by using higher reflectivity mirrors. In addition, Δτ/τ0 will be improved by reducing the impact of vibrations on optical alignment, and by further optimization of the purge N2 gas flow acting between the two CRDS mirrors and the trapping cell at the cavity centre. This purge flow reduces the levels of dust entering the intra-cavity ring-down beam and, thus, fluctuations in background scattering that contributes to noise in τ.
Figure 9. The variation in the RI accuracy with the instrument performance Δτ/τ0 for simulated accumulation mode measurements (200–300 nm in particle radius) on hygroscopic aerosol. Error bars represent one standard deviation in |Δn|.
The limiting factor in the accuracy of RI retrievals from accumulation mode measurements is the measurement of the particle radius. The accuracy of radius determinations from recorded PFs could be improved by collecting PFs at multiple wavelengths simultaneously. Carruthers et al. previously showed simultaneous collection of PFs at 405, 532, and 633 nm for an aerosol particle of constant size significantly improved the sizing accuracy (Carruthers et al. Citation2012). Alternative sizing techniques are also under investigation. For example, David et al. explored the use of broadband light scattering for radius retrievals (David et al. Citation2016, Citation2015).
We previously reported SP-CRDS measurements of 1,2,6-hexanetriol aerosol droplets in which evaporation reduced the particle radius below 300 nm (Cotterell et al., Citation2015a). Our analysis showed excellent agreement between CSW Mie theory for a fixed refractive index and the measured extinction efficiency even at droplet radii <400 nm. We have previously demonstrated that (NH4)2SO4 particles as small as 350 nm can be confined in optical BB traps when the core diameter is reduced to 2.6 μm (Cotterell et al. Citation2014). However, the analysis presented in this section leads us to conclude that RI determinations from SP-CRDS measurements on particles with radii significantly below 1 μm suffer inaccuracies greater than the threshold value of 0.003 set at the beginning of this article. Progress is dependent on improvements to the experimental performance to reduce ring-down time and radius determination uncertainties.
4. Accuracy of determined refractive index for absorbing aerosol
Optically trapping absorbing particles is challenging, with poor trapping stability caused by photophoretic forces that act in a direction away from high light intensity and become larger than the radiation pressure and gradient forces. However, some novel optical trapping schemes have been implemented to overcome this limitation. For example, Liu and co-workers developed taper-ring optical traps and demonstrated the manipulation of both strongly-absorbing aerosol and non-spherical particles (Liu et al. Citation2014). Redding and co-workers developed a photophoretic trap using ultraviolet beams and demonstrated trapping of micron sized aerosol with both spherical and non-spherical morphologies (Redding et al. Citation2015). Meanwhile, other trapping techniques (not optical) such as an electrodynamic balance should allow the confinement of absorbing aerosol particles. This section assesses the accuracy with which the complex refractive index can be determined from CRDS measurements of σext, assuming that absorbing particles can be trapped and confined stably within a CRDS beam.
The CSW Mie theory used above is only applicable to nonabsorbing spheres (Miller and Orr-Ewing Citation2007); Miller and Orr-Ewing reported an expression for the scattering cross section σsca, but then imposed the criterion of σext = σsca appropriate for a nonabsorbing sphere. The SI presents a new expression for σext by applying generalized Lorenz-Mie theory (GLMT) to a cavity standing wave, a theory referred to as CSW-GLMT, and predictions of σext are validated by comparing to predictions of CSW-Mie and traditional Mie theory. The CSW-GLMT expression for σext can be used for arbitrarily complex RIs. In the following sections we report calculations of the CSW-GLMT envelopes for a range of absorbing particles and assess the accuracy with which the complex RI can be retrieved using generated σext data sets for different values of κ.
4.1. CSW-GLMT envelopes for absorbing spheres
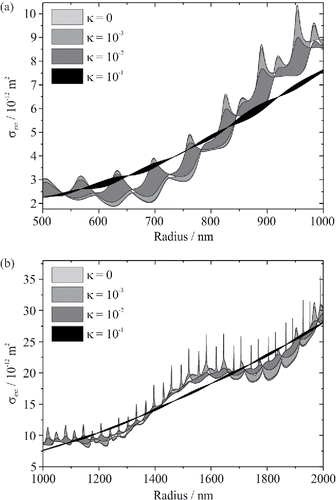
The variation in the σext envelopes, computed using the CSW-GLMT method for the limiting cases of a particle located at a node and anti-node of the intra-cavity field, can be studied with increasing κ values. shows the CSW-GLMT envelope variation for particle radii in the range 500–1000 nm and for κ values of 0, 10−3, 10−2 and 10−1. As κ increases, the fine ripple structure becomes increasingly damped, resulting in the compression of the CSW-GLMT envelopes. There is little discernible difference between the κ = 0 and κ = 10−3 simulation envelopes, with differences only becoming apparent for radii larger than ∼800 nm. shows the CSW-GLMT envelope variation over the coarse mode regime of 1000 to 2000 nm in particle radius, for the same set of κ values. In this case, there is a clear distinction between the κ = 0 and κ = 10−3 envelopes. However, the accuracy of the retrieved complex RI is expected to be sensitive to the experimental performance parameters of Δτ/τ0 and radius determination as before.
Figure 10. The variation in the CSW-GLMT envelopes for a particle of refractive index m = 1.475 + κi for different values of κ. The space-filled envelopes are color coded by their value of κ, indicated in the legend. The envelope variation with κ is shown for (a) a fine mode regime (radii from 500–1000 nm), (b) a coarse mode regime (radii from 1000–2000 nm).
4.2. Accuracy of complex RI determinations for absorbing aerosol
Simulated σext data sets were generated in the same way as outlined in the preceding sections using CSW-GLMT, incorporating the aforementioned parameters of the 532-nm SP-CRDS instrument. Notably, the Δτ/τ0 was set to 1.6 × 10⁻³ and τ0 = 25 μs. These data sets were generated for two different size regimes: a coarse mode regime (1000–2000 nm in radius) and a fine mode regime (500–1000 nm in radius). Eight data sets were generated for each size regime, corresponding to particles with m = 1.475 + κi and κ taking values of 0, 0.001, 0.002, 0.005, 0.01, 0.02, 0.05, or 0.1. Fitting each simulated σext data set to CSW-GLMT allowed an assessment of the retrieval accuracy for n and κ. As already discussed, particles that are absorbing at the 532 nm CRDS wavelength will also likely absorb at the 473 nm probe beam wavelength, and both the precision and accuracy of particle size retrieval from the 473 nm phase functions will vary with the magnitude of the imaginary RI (i.e. the magnitude of light absorption). Moreover, light absorption at the 532 nm CRDS wavelength renders Bessel beam optical trapping unstable and, thus, no experimental measurements have been performed to assess particle sizing accuracy for absorbing aerosol. Hence, the radius was assumed to be determined perfectly and the levels of RI retrieval accuracy presented here represent best cases. The percentage errors in κfit and nfit were defined as and
, respectively, where nset and κset denote the values input to the simulation.
shows the percentage error variation in κfit and nfit vary with κset for both the coarse and fine mode data sets. The desired thresholds are also shown as red lines for the accuracies in the two quantities: 1% for the error in κ and 0.2% for the error in n. The accuracy with which κ could be retrieved was 0.0002 for κ < 10−3, which manifested in a large percentage error for the low values of κ. However, this accuracy should improve as Δτ/τ0 is reduced. These results agree well with those of Zarzana and co-workers who found that, for ensemble aerosol CRDS measurements at discrete sizes, κ is not accurately retrieved for similar weakly absorbing compounds (Zarzana et al. Citation2014). As κ increases, the percentage error in κfit reduces. It falls within the accuracy threshold for values of κset > 0.05 for coarse mode data and at values >0.005 for fine mode data.
Figure 11. The variation in the percentage errors in the fitted κ and n from fitting simulated σext data sets with increasing values of κ. Coarse mode (1000–2000 nm particle radius range, open squares) and fine mode (500–1000 nm particle radius range, filled circles) size regimes were studied, with Δτ/τ0 set to 1.6 × 10⁻³. The line (red) represents the accuracy threshold set in Section 1.
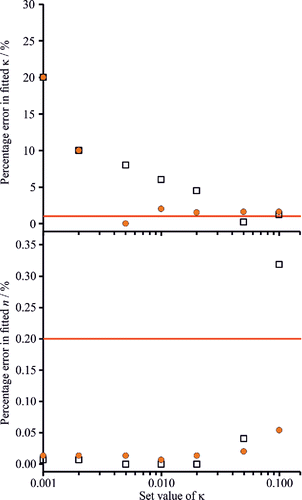
Generally, the percentage error in nfit was within the accuracy threshold for all values of κset. Only when κset is very large (>10−1) does the accuracy in nfit become significantly degraded. Therefore, for strongly absorbing compounds such as black carbon which has κ ∼ 0.8 (Bond and Bergstrom Citation2006), n is not expected to be accurately retrieved. This degradation of fitting accuracy arises from the damping of the resonance peaks in σext, leading to the CSW-GLMT σext envelope becoming increasingly featureless and tending towards a line of monotonic increase. Therefore, for both coarse and fine mode size ranges, there is an optimum range for κ in order to accurately retrieve both n and κ values. Further study is required to understand better how the percentage errors in κfit and nfit depend on both size range and Δτ/τ0. Note that this analysis does not incorporate the possibility that n and κ change with particle size, e.g. for a mixed component particle with absorbing components.
5. Conclusions
We have developed simulation methods for the assessment of RI retrieval accuracies from σext measurements using our 532-nm SP-CRDS instrument for both nonabsorbing and absorbing particles. The RI retrieval accuracy for single component nonabsorbing aerosol evaporating over a particle radius range of 2000–1000 nm was found to be 0.0002 (0.014% of actual RI), from 1000–500 nm was 0.0015 (0.10%), and for 300–200 nm was 0.15 (10%). Similarly, the RI accuracy for data sets representing hygroscopic response measured for particle radii between 1450–1050 nm was 0.0006 (±0.0002), for 900–700 nm was 0.0009 (±0.0008), and for 300–200 nm was 0.0177 (±0.0062). The retrieval of RI with sufficient accuracy to calculate reliable values of aerosol RFE is best achieved for particles with radii >1 μm. We find that σext can be measured for particle radii as small as ∼150 nm, although the RI retrieval accuracy for accumulation mode aerosol is poor and cannot be relied upon for accurate calculations of aerosol RFE. However, the level of accuracy (∼0.3%) remains better than typical ensemble measurements; Zarzana et al. (Citation2014) estimated the level of accuracy as 0.6%, while Miles et al. (Citation2011b) predicted at 2.5% level of accuracy when considering the systematic errors in particle sizing only. Accurate RI retrievals for accumulation mode aerosol should be achievable with an improvement in the CRDS instrument performance, Δτ/τ0, to below 1×10⁻³, assuming that the particle radius can be accurately determined.
Our analysis also tested the potential of the 532-nm SP-CRDS instrument to retrieve the complex RI for absorbing aerosol. We have derived an expression for σext by applying GLMT to a standing wave, referred to as CSW-GLMT, allowing calculations σext for particles with κ ≠ 0. Simulations of σext data using the parameters of our 532-nm SP-CRDS instrument were re-fitted to CSW-GLMT to assess the retrieval accuracy for both n and κ. For relatively non-absorbing aerosol (κ < 10−3) evaporating over the radius ranges of 2000–1000 nm and 1000–500 nm, the percentage error in κ is larger than 10%. This conclusion is in agreement with Zarzana and co-workers who note that it is difficult to retrieve the correct κ value when fitting E-CRDS measurements of σext for almost non-absorbing compounds (Zarzana et al. Citation2014). As κ is increased, the percentage error in the fitted κ reduces significantly, falling below the 1% error threshold for κ values >0.05 for coarse mode data sets and κ > 0.005 for fine mode data sets. Generally, n is well-retrieved in all cases except when κ becomes very large; when κ > 0.1, the CSW-GLMT envelope collapses and structure in the σext is lost. Further work is needed to assess how the accuracies in n and κ scale with Δτ/τ0, CRDS wavelength and particle size range and composition.
UAST_A_1219691_Supplemental_Information.pdf
Download PDF (737.5 KB)Acknowledgments
TCP acknowledges the Natural Sciences and Engineering Research Council of Canada (NSERC). The data presented in this article are provided through the University of Bristol data repository at Reid, J. P. (2016): Optical Properties of Aerosol, University of Bristol, DOI: 10.5523/bris.1a088w6wntf5210fkekhagrkfu.
Funding
JPR acknowledges financial support from the EPSRC through a Leadership Fellowship (EP/G007713/1). MIC acknowledges funding from NERC and the RSC through an Analytical Trust Fund studentship (NE/J01754X/1) and support from the Aerosol Society in the form of a CN Davies award.
Related Research Data
References
- Attwood, A. R., and Greenslade, M. E. (2012). Deliquescence Behavior of Internally Mixed Clay and Salt Aerosols by Optical Extinction Measurements. J. Phys. Chem. A, 116:4518–4527.
- Bohren, C. F., and Huffman, D. R. (1998). Absorption and Scattering of Light by Small Particles. Wiley, New York.
- Bond, T. C., and Bergstrom, R. W. (2006). Light Absorption by Carbonaceous Particles: An Investigative Review. Aerosol Sci. Technol., 40:27–67. doi:10.1080/02786820500421521
- Butler, T. J. A., Miller, J. L., and Orr-Ewing, A. J. (2007). Cavity Ring-Down Spectroscopy Measurements of Single Aerosol Particle Extinction. I. The Effect of Position of a Particle within the Laser Beam on Extinction. J. Chem. Phys., 126:174302. doi:10.1063/1.2723735
- Carruthers, A. E., Walker, J. S., Casey, A., Orr-Ewing, A. J., and Reid, J. P. (2012). Selection and Characterization of Aerosol Particle Size using a Bessel Beam Optical Trap for Single Particle Analysis. Phys. Chem. Chem. Phys., 14:6741–6748. doi:10.1039/c2cp40371d
- Cotterell, M. I., Mason, B. J., Carruthers, A. E., Walker, J. S., Orr-Ewing, A. J., and Reid, J. P. (2014). Measurements of the Evaporation and Hygroscopic Response of Single Fine-Mode Aerosol Particles using a Bessel Beam Optical Trap. Phys. Chem. Chem. Phys., 16:2118–28. doi:10.1039/c3cp54368d
- Cotterell, M. I., Mason, B. J., Preston, T. C., Orr-Ewing, A. J., and Reid, J. P. (2015a). Optical Extinction Efficiency Measurements on Fine and Accumulation Mode Aerosol Using Single Particle Cavity Ring-Down Spectroscopy. Phys. Chem. Chem. Phys., 17:15843–15856. doi:10.1039/C5CP00252D
- Cotterell, M. I., Preston, T. C., Mason, B. J., Orr-Ewing, A. J., and Reid, J. P. (2015b). Extinction Cross Section Measurements for a Single Optically Trapped Particle. Proc. SPIE, 9548:95480C-1–95480C-11. doi:10.1117/12.2189174
- David, G., Esat, K., Hartweg, S., Cremer, J., Chasovskikh, E., and Signorell, R. (2015). Stability of Aerosol Droplets in Bessel Beam Optical Traps under Constant and Pulsed External Forces. J. Chem. Phys., 142:154506. doi:10.1063/1.4917202
- David, G., Esat, K., Ritsch, I., and Signorell, R. (2016). Ultraviolet Broadband Light Scattering for Optically-Trapped Submicron-Sized Aerosol Particles. Phys. Chem. Chem. Phys., 18:5477–5485. doi:10.1039/C5CP06940H
- IPCC. (2013). Climate Change 2013: The Physical Science Basis. Contribution of Working Group I to the Fifth Assessment Report of the Intergovernmental Panel on Climate Change, Stocker, T. F., D. Qin, G.-K. Plattner, M. Tignor, S. K. Allen, J. Boschung, A. Nauels, Y. Xia, V. Bex and P. M. Midgley (eds.). Cambridge University Press, Cambridge, United Kingdom and New York, NY, USA, 1535 pp, doi:10.1017/CBO9781107415324.
- Kogelnik, H., and Li, T. (1966). Laser beams and resonators. Proc. IEEE, 54:1312–1329. doi:10.1109/PROC.1966.5119
- Krieger, U. K., Marcolli, C., and Reid, J. P. (2012). Exploring the Complexity of Aerosol Particle Properties and Processes using Single Particle Techniques. Chem. Soc. Rev., 41:6631–6662. doi:10.1039/c2cs35082c
- Liu, F., Zhang, Z., Wei, Y., Zhang, Q., Cheng, T., and Wu, X. (2014). Photophoretic Trapping of Multiple Particles in Tapered-Ring Optical Field. Opt. Express, 22:23716. doi:10.1364/OE.22.023716
- Mason, B. J., Cotterell, M. I., Preston, T. C., Orr-Ewing, A. J., and Reid, J. P. (2015). Direct Measurements of the Optical Cross Sections and Refractive Indices of Individual Volatile and Hygroscopic Aerosol Particles. J. Phys. Chem. A, 119:5701–5713. doi:10.1021/acs.jpca.5b00435
- Mason, B. J., King, S.-J., Miles, R. E. H., Manfred, K. M., Rickards, A. M. J., Kim, J., Reid, J. P., and Orr-Ewing, A. J. (2012). Comparison of the Accuracy of Aerosol Refractive Index Measurements from Single Particle and Ensemble Techniques. J. Phys. Chem. A, 116:8547–8556. doi:10.1021/jp3049668
- Mason, B. J., Walker, J. S., Reid, J. P., and Orr-Ewing, A. J. (2014). Deviations from Plane–Wave Mie Scattering and Precise Retrieval of Refractive Index for a Single Spherical Particle in an Optical Cavity. J. Phys. Chem. A, 118: 2083–2088. doi:10.1021/jp5014863
- Michel Flores, J., Bar-Or, R. Z., Bluvshtein, N., Abo-Riziq, A., Kostinski, A., Borrmann, S., Koren, I., and Rudich, Y. (2012). Absorbing Aerosols at High Relative Humidity: Linking Hygroscopic Growth to Optical Properties. Atmos. Chem. Phys., 12:5511–5521. doi:10.5194/acp-12-5511-2012
- Miles, R. E. H., Carruthers, A. E., and Reid, J. P. (2011a). Novel Optical Techniques for Measurements of Light Extinction, Scattering and Absorption by Single Aerosol Particles. Laser Photon. Rev., 5:534–552. doi:10.1002/lpor.201000029
- Miles, R. E. H., Rudić, S., Orr-Ewing, A. J., and Reid, J. P. (2011b). Sources of Error and Uncertainty in the Use of Cavity Ring Down Spectroscopy to Measure Aerosol Optical Properties. Aerosol Sci. Technol., 45:1360–1375. doi:10.1080/02786826.2011.596170
- Miller, J. L., and Orr-Ewing, A. J. (2007). Cavity Ring-Down Spectroscopy Measurement of Single Aerosol Particle Extinction. II. Extinction of Light by an Aerosol Particle in an Optical Cavity Excited by a cw Laser. J. Chem. Phys., 126:174303. doi:10.1063/1.2723736
- Moise, T., Flores, J. M., and Rudich, Y. (2015). Optical Properties of Secondary Organic Aerosols and Their Changes by Chemical Processes. Chem. Rev., 115:4400–4439. doi:10.1021/cr5005259
- Preston, T. C., and Reid, J. P. (2015). Angular Scattering of Light by a Homogeneous Spherical Particle in a Zeroth-Order Bessel Beam and its Relationship to Plane Wave Scattering. J. Opt. Soc. Am. A, 32:1053–1062. doi:10.1364/JOSAA.32.001053
- Ravishankara, A. R., Rudich, Y., and Wuebbles, D. J. (2015). Physical Chemistry of Climate Metrics. Chem. Rev., 3682–3703. doi:10.1021/acs.chemrev.5b00010
- Redding, B., Hill, S. C., Alexson, D., Wang, C., and Pan, Y. (2015). Photophoretic Trapping of Airborne Particles using Ultraviolet Illumination. Optics Express, 23:21–28. doi:10.1364/OE.23.003630
- Reid, J. P., Mason, B. J., Cotterell, M. I., Preston, T. C., and Orr-Ewing, A. J. (2014). Aerosol Optical Chromatography and Measurements of Light Extinction by Single Particles. Proc. SPIE, 9164:91641Y-3–91641Y-8.
- Walker, J. S., Carruthers, A. E., Orr-Ewing, A. J., and Reid, J. P. (2013). Measurements of Light Extinction by Single Aerosol Particles. J. Phys. Chem. Lett., 4:1748–1752.
- Zarzana, K. J., Cappa, C. D., and Tolbert, M. A. (2014). Sensitivity of Aerosol Refractive Index Retrievals Using Optical Spectroscopy. Aerosol Sci. Technol., 48:1133–1144. doi:10.1080/02786826.2014.963498