
ABSTRACT
The phase-separation of mixed aerosol particles and the resulting morphology plays an important role in determining the interactions of liquid aerosols with their gas-phase environment. We present the application of a new aerosol optical tweezers chamber for delivering a uniformly mixed aerosol flow to the trapped droplet's position for performing experiments that determine the phase-separation and resulting properties of complex mixed droplets. This facilitates stable trapping when adding additional phases through aerosol coagulation, and reproducible measurements of the droplet's equilibration timescale. We demonstrate the trapping of pure organic carbon droplets, which allows us to study the morphology of droplets containing pure hydrocarbon phases to which a second phase is added by coagulation. A series of experiments using simple compounds are presented to establish our ability to use the cavity enhanced Raman spectra to distinguish between homogeneous single-phase, and phase-separated core–shell or partially engulfed morphologies. The core–shell morphology is distinguished by the pattern of the whispering gallery modes (WGMs) in the Raman spectra where the WGMs are influenced by refraction through both phases. A core–shell optimization algorithm was developed to provide a more accurate and detailed analysis of the WGMs than is possible using the homogeneous Mie scattering solution. The unique analytical capabilities of the aerosol optical tweezers provide a new approach for advancing our understanding of the chemical and physical evolution of complex atmospheric particulate matter, and the important environmental impacts of aerosols on atmospheric chemistry, air quality, human health, and climate change.
Copyright © 2016 American Association for Aerosol Research
EDITOR:
1. Introduction
Atmospheric aerosols play an important role in Earth's climate system and are linked to adverse health effects (Pope et al. Citation2009; Donahue et al. Citation2012; IPCC Citation2013; Tsigaridis et al. Citation2014). Organic carbon-based aerosol particles are a major component of ambient aerosol and can make up between 30% and 70% of the total fine aerosol mass (Murphy et al. Citation2006; Zhang et al. Citation2007; Hallquist et al. Citation2009; Emanuelsson et al. Citation2013). Thus, it is important to understand the chemical processes that generate or modify organic aerosols, and their key physicochemical properties (Kanakidou et al. Citation2005; Koop et al. Citation2011). One key property that often impedes thorough experimental or ambient investigations of organic aerosols is the presence of distinct thermodynamic chemical phases in a particle, and the particle's resulting morphological state (or internal structure) in complex multicomponent aerosols (Hallquist et al. Citation2000; McNeill et al. Citation2006; Shen et al. Citation2008; Riemer et al. Citation2009; Zuend et al. Citation2010; Song et al. Citation2012b; Wheeler and Bertram Citation2012; Schill and Tolbert Citation2013). Liquid particles are common under atmospheric conditions with three main types of particle morphology (Chang and Pankow Citation2006; Ciobanu et al. Citation2009; Song et al. Citation2012a; Drozd et al. Citation2013; Schill and Tolbert Citation2013; Li et al. Citation2015; Qiu and Molinero Citation2015; Renbaum-Wolff et al. Citation2016; Stewart et al. Citation2015; Hekayati et al. Citation2016). These can be broadly categorized as a homogeneously mixed single-phase structure, and liquid–liquid phase-separated (LLPS) structures (Kwamena et al. Citation2010; Song et al. Citation2013; You et al. Citation2014; Stewart et al. Citation2015; You and Bertram Citation2015; Metcalf et al. Citation2016). For the phase-separated particles, the predominant morphological states are a core–shell or partially engulfed structure (Buajarern et al. Citation2007a; Reid et al. Citation2011; Song et al. Citation2013; O'Brien et al. Citation2015).
A phase-separated morphology is important in experiments addressing the formation or properties of oxidized secondary organic aerosol (SOA) mixed with a hydrocarbon or aqueous phase. In the cases where the phases are not expected or observed to mix the resulting phase-separation is usually assumed to adopt a core–shell morphology where one phase “coats” the other (Vaden et al. Citation2011; Abramson et al. Citation2013; Platt et al. Citation2013; Robinson et al. Citation2015). The occurrence of partial-shell morphologies and their importance for the timescales of physical and chemical evolution of aerosols has recently come to the fore requiring novel analytical techniques to fully assess their occurrence and impacts (Buajarern et al. Citation2007a, Citation2007b; Kwamena et al. Citation2010; Reid et al. Citation2011; Dennis-Smither et al. Citation2012; Shiraiwa et al. Citation2012; Stewart et al. Citation2015; Metcalf et al. Citation2016). For a core–shell morphology, diffusion through the shell dictates the rate at which gas-phase components partition into similar aerosol components as the system re-equilibrates (Vaden et al. Citation2011; Davies et al. Citation2012; Abramson et al. Citation2013; Lu et al. Citation2014). The composition at the air-particle interface also dictates the particle's ability to undergo chemical reactions with gas-phase reactants, and the rates and mechanisms of those reactions (Evans Citation2005; Alexander et al. Citation2009; Shindell et al. Citation2009; Abbatt et al. Citation2012; Gaston and Thornton Citation2016).
The simplest type of phase separation occurs when a particle contains two immiscible components. An example would be oil and water in which the phase separation is easy to observe at the macroscale. To understand the resulting morphology of a suspended oil-water particle, the interfacial tensions between each of the three phases (oil, water, and air in this case) must be known (Kwamena et al. Citation2010). In adopting an equilibrium structure, the total surface free energy is minimized; if the change in surface areas is small then we can simply use the spreading coefficients to directly predict the morphology. This assumption was shown to hold for supermicron systems studied using the aerosol optical tweezers, for example, oleic acid added to aqueous NaCl produced a partially engulfed morphology (Kwamena et al. Citation2010; Dennis-Smither et al. Citation2012). Veghte et al. (Citation2013) has shown that phase separated supermicron particles can experience transitions to a homogeneous morphology as diameter decreases (dp < 196 nm for succinic acid with ammonium sulfate and dp < 270 nm for pimelic acid and ammonium sulfate). For the three-phase systems studied here, only the liquid spreading coefficients (
and
, Equations (Equation1
[1] ) and (Equation2
[2] )) are of interest as generally the spreading coefficient of the gas phase will be negative:
[1]
[2]
L1 and L2 are the two liquid phases. If both and
are negative, then the particle adopts a partially engulfed morphology, where the two phases lie side-by-side and in contact with each other at equilibrium. If either
or
is positive, then the particle exhibits a core–shell morphology and the phase with the positive spreading coefficient forms the shell. Note both
and
cannot be positive as then we get the impossible result of negative interfacial tension for
. Aqueous phases in the atmosphere have a negative spreading coefficient, meaning it always costs energy to spread the aqueous phase over another phase. This is why the organic phase will always form the shell around the aqueous phase, if an LLPS core–shell morphology occurs. A partial-engulfing or homogeneous morphology is also possible for different combinations of aqueous and organic phases, depending on their miscibility and spreading coefficients.
The morphology of liquid–liquid phase-separated particles representing typical atmospheric aerosol components has been studied using optical microscopy, aerosol optical tweezers, electrodynamic balance, confocal Raman spectroscopy, scanning electron microscopy, cryo-transmission electron microscopy, and aerosol mass spectrometry (Buajarern et al. Citation2007a,Citationb; Ciobanu et al. Citation2009; Kwamena et al. Citation2010; Bertram et al. Citation2011; Reid et al. Citation2011; Song et al. Citation2012a,Citationb, Citation2013; You et al. Citation2012, Citation2014; Schill and Tolbert Citation2013; Veghte et al. Citation2013; Stewart et al. Citation2015). The direct observational studies rely on optical microscopy where particles are placed on a hydrophobic substrate, and this can affect the resulting morphology (You et al. Citation2012, Citation2014; Renbaum-Wolff et al. Citation2016).
A major advantage of the aerosol optical tweezers (AOT) technique, as well as the electrodynamic balance (EDB), is that there are no surface contact points because the droplets are suspended in air (Mitchem and Reid Citation2008; Verdeny et al. Citation2011; Bzdek et al. Citation2016). This contactless aspect of the AOT, combined with the surface resonant whispering gallery modes (WGMs) retrieved in the cavity enhanced Raman spectrum, provides a unique direct and real-time assessment of the droplet's morphology, size, and refractive index (Preston and Reid Citation2013, Citation2015). The same droplet characterization can be done in an EDB by measuring the angular scattering of light from the trapped droplet. This EDB setup would retrieve less accurate size and refractive index measurements than the AOT (Ray et al. Citation1991, Citation1989; Miles et al. Citation2012). Due to higher possible air flow rates in the EDB, faster equilibration timescales could be measured than in the current AOT system. The WGMs in the AOT can be used to distinguish between the three predominant morphologies: phase-separated core–shell or partial-engulfed structures, and homogeneous single-phase droplets (Kwamena et al. Citation2010; Reid et al. Citation2011; Dennis-Smither et al. Citation2012; Cai et al. Citation2015b; Stewart et al. Citation2015). Furthermore any changes in the droplet's morphology as its composition or the surrounding relative humidity is changed are directly assessed (Rickards et al. Citation2013; Cai et al. Citation2014). The AOT can also be used to study individual micron-sized droplets and does not require the aerosols to first be collected on a substrate, and then extracted in solvent as is the case with other methods (Hopkins et al. Citation2004; Davis et al. Citation2015; Redding et al. Citation2015).
2. Experimental methods
2.1. Aerosol optical tweezers system
The aerosol optical tweezers (AOT) system consists of three main components: the aerosol generation system, the droplet trapping system, and the trapping chamber. The design and evaluation of the new trapping chamber was the focus of our work presented here. The droplet trapping system is described in the online supplementary information (SI) as we follow the same approach as Hopkins et al. (Citation2004). Briefly, a 532 nm laser is passed through a set of expansion lenses so that the resulting beam overfills the back aperture of the 100x (NA 1.25) oil immersion objective. The objective is pressed against the bottom of a thin glass coverslip, and an optical gradient force trap forms approximately 40 μm above the coverslip inside the trapping chamber.
The aerosol generation system creates droplets of sufficient size (dp > 4 μm) and passes them into the chamber. A medical nebulizer (PARI TREK S) is used to generate aerosol from aqueous solutions that have low viscosity similar to water. To trap organic carbon-based droplets, the condensation monodisperse aerosol generator (CMAG; TSI, Inc., Shoreview, MN, USA) is used for compounds that can grow droplets large enough by vapor condensation.
2.2. Chamber system design
To apply the aerosol optical tweezers approach in studies of liquid–liquid phase separation, droplets composed of immiscible compounds must be trapped. We achieve this by adding the second phase to a tweezed droplet either by coagulation of small particles, or by vapor condensation. Our chamber design goal was then to produce stable trapping under conditions of variable air flow rates, and during collisions of small droplets with the tweezed droplet.
When adding a second component to the trapped droplet through coagulation, the total flow field of conditioned air plus the additional aerosol flow should have the same uniform flow velocity as the conditioned air by itself. In this way, the aerosol addition does not significantly affect the air flow around the droplet, which can destabilize the trap. Condensation of vapors from the oxidation of gases is the second method that we designed for, which requires the ability to add organic aerosol vapor precursors to the conditioned air flow. The ability to add a second component by either condensation or coagulation will allow us to simulate the formation and chemical evolution of atmospheric aerosol particles mimics frequently studied using smog chamber or aerosol flow tube reactors (Loza et al. Citation2013; Ortega et al. Citation2013; Robinson et al. Citation2013, Citation2015; Bruns et al. Citation2015), while allowing us to investigate the resulting morphology and properties of the individual multicomponent droplet. We used an iterative design process with computational fluid dynamic (CFD) simulations using SolidWorks software, and rapid prototyping using 3D printing to optimize the final aluminum chamber design. The new chamber achieves a uniform and predictable fluid flow around the droplet's position that is an improvement over previous AOT chamber designs (Hopkins et al. Citation2004; Davis et al. Citation2015). The chamber used by the Bristol Aerosol Research Center has a small volume, maximizing trapping efficiency. The new CMU chamber presented here was designed to facilitate coagulation of a second phase to a trapped droplet, so a uniform flow was the design priority. More details on the two chamber designs are provided in the SI.
The AOT chamber must deliver the droplets reliably to the trapping region just above the coverslip, and establish the conditioned airflow that controls the relative humidity (RH) and vapor concentration surrounding the droplet. The trapped droplet only resides approximately 40 μm above the coverslip and lies within the surface boundary layer of the coverslip. The best chamber design we can achieve is to reliably and controllably deliver the droplets and the conditioned air to the boundary layer above the trapping location. We show the final design in . It consists of three main sections: an upper mixing volume for conditioning the incoming air flow, a droplet trapping volume, and a vacuum volume for the exhaust air flow.
Figure 1. The interior design and external gas and aerosol ports of our aerosol optical tweezers chamber, designed in SolidWorks. The dot (blue) at the chamber bottom just above the coverslip represents the position of an oversized trapped droplet. The scale bar displays the relative humidity field from computational fluid dynamics simulations of the humid conditioned airflow mixing with the drier aerosol airflow, in the chamber. The simulation shows the mixing of the various flows at the top of the trapping chamber. The mixing chamber flow is 0.15 L/min of 100% RH air and the vacuum exhaust flow is 0.3 L/min, resulting in 0.15 L/min coming in from ambient pressure at the aerosol port at 50% RH. The black and white arrows show the direction of the characteristic airflows. The lower images display three different rotations of the outer chamber design, with each machined part having a separate color.
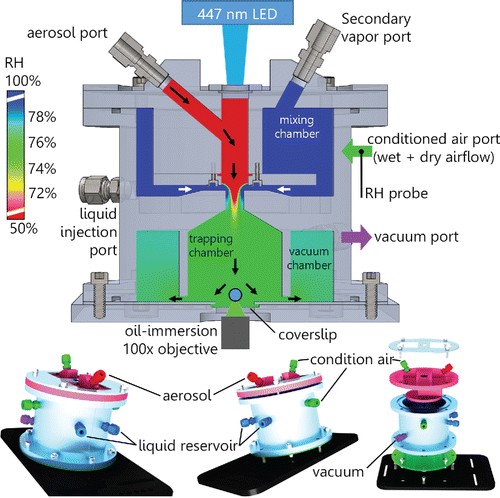
The top of the chamber contains the mixing volume, where the RH conditioned air is added. This air flow can also be mixed with other gases injected into the mixing volume or with vapors evaporating from liquids contained in two wells at the bottom of the mixing chamber. The well-mixed air flow then travels radially inward to the central shaft where the aerosol flow is also introduced, and the combined flow continues down into the trapping chamber. The radial introduction of the conditioned flow through a concentric slit surrounding the shaft is a key design feature we identified through CFD simulations for producing a uniform gas-phase flow before it reaches the droplet. The expansion of the flow into the bottom trapping chamber slows its velocity while maintaining a central downward flow toward the trapping region. The result is a uniformly mixed downward airflow over the trapping region delivering conditioned air and droplets to the optical trap position under small fluid velocities (<0.005 m/s, for 0.25 Lpm vacuum air flow and 0.35 Lpm conditioned air flow). After passing over the trapping region, the gas flows out radially from the center trapping chamber to the surrounding vacuum chamber. The concentric exit slit surrounding the trapping region is important for maintaining a uniform gas-phase composition around the droplet because it produces uniform flow velocities and thus minimizes concentration gradients. These three chamber sections combine to generate a uniform airflow to the droplet, resulting in stable trapping during coagulation of additional aerosol particles to the trapped droplet. We have stably trapped droplets in this system for more than 24 h with no user intervention.
Control of the RH around the droplet is important for stable trapping of aqueous droplets, to perform hygroscopic growth and equilibration timescale experiments, and also for in situ production of secondary organic matter in future experiments through oxidation of precursor vapors directly in the chamber. Large variations in RH cause significant changes in the size of hygroscopic droplets, such that they are no longer stable in the optical trap and are lost. The desired RH is achieved using mass flow controllers whose flow rates are controlled via a custom LabVIEW program. Using a computer controlled RH system facilitates performing longer experiments over many hours to investigate hygroscopic growth and droplet equilibration timescales during RH cycles. Experiments can be replicated multiple times on the same droplet. Lastly, using the volumes of the mixing (0.38 L) and trapping (0.089 L) chambers, we can calculate the theoretical equilibration timescale, τ, for changes in the gas phase using Equation (Equation3[3] )
[3] τ is calculated as the sum of the residence times (volume/air flow rate) of the trapping and mixing chambers. For a typical experiment, this calculated timescale is 1.44 min (0.25 Lpm vacuum air flow and 0.35 Lpm conditioned air flow) and the shortest timescale we can achieve with this setup is 0.55 min (0.35 Lpm vacuum air flow and 1.25 Lpm conditioned air flow). Note, when we are not coagulating or trapping a droplet the chamber is run at positive pressure (vacuum air flow greater than conditioned air flow) so the excess flow exits the aerosol port. This is to ensure the RH measured by the probe (Vaisala, ±1.5% RH) is the same RH experienced by the droplet. Below we will compare this calculated timescale to the measured equilibration timescale by studying an aqueous salt droplet equilibrating to different step changes in RH.
2.3. Raman spectrum analysis
The analysis of the droplet's retrieved Raman spectrum involves first finding the whispering gallery modes (WGMs) in the raw spectrum and then fitting the wavelength positions of these peaks to a homogeneous Mie scattering model to retrieve the droplet's diameter, dp, and refractive index, n (Preston and Reid Citation2013, Citation2015). At the wavelength of each WGM, the droplet acts as a high finesse optical cavity where the WGMs form a standing wave on the droplet surface—this greatly amplifies the Raman scattered signal at that discrete wavelength (Matsko and Ilchenko Citation2006; Wills et al. Citation2009; Yang et al. Citation2011). The WGMs are thus superimposed on top of the broader Stokes shifted vibrational modes in the droplet's Raman spectrum. We show example droplet Raman spectra in . The spectrum is reported as a Raman shift in units of wavenumbers (cm−1) that accounts for the excitation laser's wavelength (532 nm).
Figure 2. Example Raman spectra from tweezed droplets with whispering gallery modes (WGMs) indicated by arrows. Top: A homogeneous, aqueous NaCl droplet has only the broad O-H Raman band (spectral range indicated by the bottom right [blue] bar). Middle: The squalane coated aqueous NaCl droplet has both the O-H and C-H Raman bands, where the C-H Raman band is caused by the squalane (spectral range indicated by the bottom left [green] bar). Both broad modes support WGMs. Note the circular tipped pointers indicate narrower Raman features indicative of squalane, on top of which WGMs can also form. Bottom: A spectrum from a partially engulfed morphology of oleic acid and aqueous NaCl, where both the broad C-H and O-H modes are observed, but no WGMs are present.
![Figure 2. Example Raman spectra from tweezed droplets with whispering gallery modes (WGMs) indicated by arrows. Top: A homogeneous, aqueous NaCl droplet has only the broad O-H Raman band (spectral range indicated by the bottom right [blue] bar). Middle: The squalane coated aqueous NaCl droplet has both the O-H and C-H Raman bands, where the C-H Raman band is caused by the squalane (spectral range indicated by the bottom left [green] bar). Both broad modes support WGMs. Note the circular tipped pointers indicate narrower Raman features indicative of squalane, on top of which WGMs can also form. Bottom: A spectrum from a partially engulfed morphology of oleic acid and aqueous NaCl, where both the broad C-H and O-H modes are observed, but no WGMs are present.](/cms/asset/4b64cc2e-c4b2-4a0c-9ce9-6ef502f13899/uast_a_1224317_f0002_oc.gif)
Our previous WGM peak finding method for Raman spectral analysis relied on a smooth spline fitting of a single spectrum (to capture the broad Raman mode) with a Gaussian fit to the WGM peaks above the smoothed spline (Hopkins et al. Citation2004; Preston and Reid Citation2013). Although this method works well for WGM peaks with a signal-to-noise ratio >20, it produces many false positives when used to find WGM peaks at an S/N < 10. This posed a problem for the analysis of our pure organic droplets where there are fewer large WGM peaks with S/N > 10 in the narrow C-H Raman hydrocarbon mode to constrain the fit. Aqueous droplets have a broad O-H Raman water stretch mode that supports a larger number of intense WGM peaks, facilitating the fitting. To find the less intense WGM peaks in the Raman spectrum, we developed a signal processing method using a non-local means denoising algorithm and wavelet transforms, which is described in the SI. This signal processing allows us to find WGMs that have peak intensities with S/N > 2.4, and can find even weaker WGM peaks (S/N = 1.2–1.6) depending on the noise level of the data.
Once we identify the whispering gallery mode positions, we use the Mie scattering algorithm developed by Preston and Reid (Citation2013) to independently determine both the size and refractive index of a homogeneous droplet. The diameter (dp) can be determined to an accuracy of ±0.05% and the refractive index () to ±0.11% (Preston and Reid Citation2013, Citation2015). When we apply this homogeneous algorithm to a core–shell droplet, we can use the plausibility of the retrieved refractive index and diameter parameters as well as an abnormally high fit error to identify a droplet with a core–shell morphology (Stewart et al. Citation2015). This method of determining whether the droplet has a homogeneous or phase-separated core–shell morphology will be important in the interpretation of our results.
2.4. Direct detection of phase separation
The WGMs generated by the droplet are the crucial evidence constraining the assignment of morphology (Dennis-Smither et al. Citation2012; Reid et al. Citation2011). We show examples of Raman spectra for a homogeneous, a core–shell, and a partially engulfed droplet in . The easiest morphology to observe is the partial-engulfing structure because it breaks the spherical symmetry and thus quenches any WGMs, leaving only the broad Stokes Raman vibrational modes (Dennis-Smither et al. Citation2012). The partially engulfed morphology can sometimes also be observed in the bright-field visual image (Buajarern et al. Citation2007a).
The core–shell morphology is characterized by WGMs that are influenced by both the core and shell phases. Prior identification of a core–shell morphology relied on the interpretation of the WGMs and the retrieved homogeneous fit parameters and fit error (Stewart et al. Citation2015). This determination is different from the partially engulfed situation that lacks WGMs, as the WGMs generated in the shell can travel in and out of the core, depending on the shell's thickness. The main effect observed for core–shell droplets is an increase in fit error and/or unphysical refractive index and diameter changes; a homogeneous single-phase model simply will not fit the WGMs positions accurately. Another piece of evidence to support a core–shell formation is a change in the peak separation between adjacent transverse electric (TE) and transverse magnetic (TM) WGM peaks (Stewart et al. Citation2015). To use that method requires a relative humidity induced phase separation going from a core–shell to homogeneous morphology and back where the size does not vary significantly but the apparent refractive index retrieved from a homogeneous fit would suggest otherwise. The systems studied here do not experience RH-induced phase separations. Instead we rely on the interpretation of the homogeneous fit error, droplet refractive index, and size to identify if a homogeneous Mie scattering model is valid.
2.5. Core–shell WGM fitting algorithm
To conclusively demonstrate our ability to distinguish the morphology of a core–shell versus a homogeneous droplet, and to recover meaningful physical parameters from core–shell droplets, we have developed a fitting algorithm for the Mie scattering of a core–shell morphology. A previous core–shell algorithm could fit for the diameter, refractive index, and chromatic dispersion for the core and shell but required WGM labels a priori, which we do not have (Ray and Nandakumar Citation1995). WGM labels are mode number, mode order, and EM wave type (either transverse electric [TE] or transverse magnetic [TM]) for each WGM. In our other recently published core–shell algorithm, we assigned the refractive index and chromatic dispersion of the core and shell a priori, and then determined the diameter of the core and shell, and the WGM labels (Stewart et al. Citation2015).
The core–shell optimization problem involves finding the global minimum on a non-convex error space, just as in the case of the homogeneous algorithm. We used a gridded search over the six droplet parameters: the diameters, refractive indices, and chromatic dispersions for both the core and shell phases. Then for each parameter set, we also need to optimize for the WGM labels, which have discrete values for the mode number (30 to 80), mode order (1 to 3), and EM wave type (TE or TM). For the optimization of the WGM labels, we search possible combinations to find the combination with the lowest error for each set of droplet parameters. We sample the droplet parameter space using a gridded search with a specified resolution for each parameter. This algorithm locates the minimum in one spectrum in >24 h when running on a 4 core 2.60 GHz CPU. The optimization results of the first spectrum can then be used to constrain the optimization of the next spectra, decreasing subsequent computation time. Applying our core–shell algorithm to the phase-separated experiments will allow us to retrieve more details regarding the solubility, volatility, and diffusion coefficients of the components in the two phases.
3. Results
3.1. Assessment of trapping chamber performance
The chamber design was first prototyped by 3D printing out of ABS polymer to test the validity of the design before the final version was machined from aluminum. We were able to successfully tweeze droplets within the 3D printed chamber but it had one important drawback. The porous nature of the 3D printed polymer structure made humidity control impractical as the chamber walls acted as a capacitor for changes in relative humidity (RH). Thus, with minor modifications the final design presented here was fabricated out of aluminum in the Mechanical Engineering machine shop at Carnegie Mellon University. The experimental data shown here were all obtained using the aluminum chamber.
To assess the equilibration timescale of our chamber, we tweezed a saturated aqueous NaCl droplet as a responsive probe to humidity changes. An NaCl droplet has a low viscosity, similar to that of water, and equilibrates promptly with changes in the relative humidity of the surrounding gas phase. This equilibration is much faster than the calculated bulk equilibration timescale of the chamber (1.44 min). Thus by fitting the size of a rapidly responding droplet to an exponential decay after a step change in RH, we can determine the actual equilibration timescale of the chamber. We nebulized droplets from a saturated solution of NaCl in water because this produces the largest droplet sizes and facilitates trapping. Once we trapped the droplet, we ramped the RH up and down in approximately 4% RH steps from 65% to 88% RH, holding the RH constant for 20 min at each step. We cycled RH up and down six times, for a total experimental length of almost 20 h. We show a segment of the experimental data in . This figure is also a good reference for the typical scatter in the retrieved refractive index and size from the Mie fitting of a homogeneous droplet as the droplet's size and composition changes in response to changes in its surrounding gas-phase. Note that the WGMs are sometimes lost in the initial portion of an RH step change as the rapid change in droplet size blurs the wavelength positions of the WGMs, which results in a decrease in the accuracy of the position and the quantity of WGMs observed. We only show the WGMs that resulted in a successfully retrieved fit. We isolated the retrieved droplet diameter for each RH step and performed an exponential fit to the change in diameter to determine the equilibration timescale as the e-folding decay time. The average equilibration timescale was 1.83 ± 0.36 min for RH below 82% (the uncertainty is the standard deviation of 36 timescale measurements, see the SI for the full 20 h dataset). Above 82% RH, we observed an increase in the measured timescale, which we attribute to partial wetting of the chamber walls and a consequent slow equilibration of water with the walls. We typically performed equilibration experiments at less than 80% RH to avoid this lag.
Figure 3. Timescale of changes in droplet size and refractive index, determined from fitting the Raman shift positions of the WGMs, as the chamber RH was stepped, to determine the chamber's equilibration timescale. An aqueous NaCl droplet was used, nebulized from a saturated solution of 0.4 g/mL. An excerpt of the experiment is shown here—see the SI for the full 20 h experiment. The RH steps were in increments of 5% in the humid air flowrate, while holding the total conditioned air flow at 0.35 Lpm. Each RH condition was held for 20 min before stepping to the next.
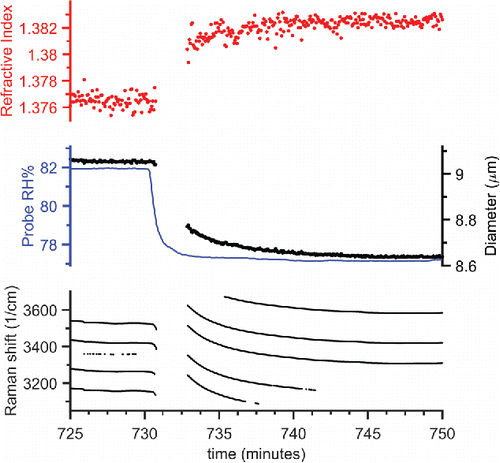
We applied the same exponential decay fit to the measured RH of the conditioned airflow immediately before it entered the mixing chamber; this yielded an average equilibration timescale for the RH probe (Vaisala) of 0.50 min. The same exponential fit can be applied to the slope of the Raman shift positions of the WGMs instead of to the retrieved dp. This resulted in an equilibration timescale of 2.08 ± 0.85 min for RH below 82% (the uncertainty is the standard deviation of 28 timescale measurements). This method has an increased uncertainty as we fit the derivative of the WGM wavelength position, which amplifies the scatter in the data. By taking the derivative, we can then combine the individual WGMs into a complete dataset filling in possible gaps in a single WGM trace. We use this equilibration timescale estimation method for core–shell droplets where the complete diameter time series is not retrieved. Finally, from the middle panel in , we can see there is a 30 s delay between onsets of changes in the droplets radius and when the RH probe responded. Therefore, when analyzing the data, onset delays of changes in droplet diameter (or WGM Raman shift) following a step change in RH should be greater than 2 min before we consider that the delay may be caused by droplet equilibration limitations, such as caused by low particle-phase diffusivity that impedes the rate of mass transport.
3.2. Determination of partial-engulfing morphology for mixed droplets composed of simple hydrocarbons
We used dioctyl sebacate (DOS) to test our ability to trap pure organic particles produced with the CMAG. Dioctyl sebacate is a long-chain 26 carbon molecule with two internal ester groups. It is a hydrophobic liquid and thermally stable with a boiling point of 256°C; these thermal properties make it suitable for use in the CMAG. To demonstrate our AOT system's ability to create phase separated droplets by the addition of a second phase through coagulation, aqueous glycerol aerosol was generated using the medical nebulizer and allowed to coagulate with the tweezed DOS droplet. Based on bulk phase observations of phase separation when DOS and aqueous glycerol were mixed in a beaker, and the known hydrophobic properties of dioctyl sebacate, it would be expected that phase-separation would occur in the aerosol phase but the specific morphology cannot be predicted from these bulk phase observations alone. The surface and interfacial tensions required to predict the resulting morphology are not available in the literature.
The experiment started by trapping a dioctyl sebacate droplet, which then slowly evaporated into the conditioned airflow. The evaporation is evident by the negative slope in the WGM traces in indicating decreasing droplet diameter as the WGM positions blue shift to shorter wavelength, apparent in the reported spectrum from the shift to smaller Raman shifts. As the WGMs are only created from Raman scattered photons, this presents some unique challenges for fitting and
to the WGMs when a pure organic droplet is trapped. The hydrocarbon C-H stretch mode is much narrower than the broad O-H water stretch mode observed in aqueous systems. Therefore, there are fewer WGM peaks present in the C-H mode to fit droplet diameter
and
, as few as two WGMs in some cases as seen in the WGM traces in . As such only a few frames could be fit for
and
for the pure DOS droplet.
Figure 4. (a) Raman spectra time series for a tweezed dioctyl sebacate droplet that was then coagulated with small droplets produced from a 1:1 solution of glycerol and water. The C-H Raman mode appears in the spectra between 2825 and 2975 cm−1, and the color scale indicates the intensity of the Raman signal at that Raman shift position. The bright white points indicate the positions of the whispering gallery modes (WGMs). Negative slopes (decreasing Raman shift) indicate decreasing droplet size. The glycerol:water aerosol was added at 0 min, indicated by the gray bar; the RH was 75%. This caused an almost immediate disappearance of the WGMs, indicating a partially engulfed morphology was present between 5 min and 115 min. A faint O-H mode from water also appeared between ∼3000 and 3300 cm−1. After 115 min the O-H Raman band faded and the WGMs appeared, indicating the loss of the aqueous phase and the restoration of a homogeneous droplet morphology. The evaporation of the glycerol:water phase explains these observations. (b) Raman spectra for a tweezed NaCl(aq) droplet being coagulated with small droplets of oleic acid, at an RH of 77%. A short 25 s coagulation at 0 min resulted in a partially engulfed morphology. The oleic acid addition is also evident by the increase in the C-H Raman mode between 2850 and 3000 cm−1. After a longer 145 s coagulation period at 4 min the partially engulfed morphology was still present.
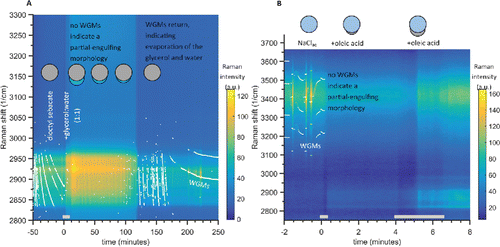
At 0 min in , nebulized droplets of the glycerol solution (50% DI water and 50% glycerol) were flowed into the chamber, coagulating with the DOS droplet. Immediately after the coagulation began, the WGMs were no longer observed. This indicates that the liquid droplet phase separated into a partially engulfed morphology, where the non-spherical structure and presence of phase inclusion quenches the surface-resonant WGMs. The aqueous glycerol phase of the droplet then appeared to slowly evaporate over a 115 min period, after which the WGMs returned indicating the restoration of a homogeneous droplet. The return of the WGMs indicates evaporation of the aqueous glycerol phase and thus the droplet composition returning to the original dioctyl sebacate. Before the glycerol(aq) addition, the average diameter of the DOS droplet was 8.281 μm and was 1.4441. The refractive index is similar to refractometer measurements for DOS of
= 1.4463 (Rheims et al. Citation1999). After the evaporation of the glycerol(aq), the average
was 7.97 μm and
was 1.4453, indicating the droplet's composition had returned to that of primarily dioctyl sebacate.
We determine from the dispersion
retrieved from the WGM fit, and report
at 650 nm (see the SI for the full WGM fit results). This is the wavelength where
is typically reported from AOT experiments as it corresponds to the center of the aqueous O-H Raman mode (3412 cm−1) where most of the WGMs reside in aqueous droplets (Preston and Reid Citation2013, Citation2015; Cai et al. Citation2015a; Stewart et al. Citation2015). Small amounts of water and/or glycerol may have also been partitioned into the DOS phase when the WGMs returned. However, the similarity of the droplet's refractive index of
= 1.4441 before versus 1.4453 after the WGMs disappeared indicates that the composition was still that of DOS, as the small change in n is within the uncertainty of the fit (
= 1.4441 ± 0.0016).
This experiment demonstrates the phase separation of dioctyl sebacate and aqueous glycerol into a partially engulfed morphology, and also showcases the simplicity of determining this type of morphology. It also demonstrates the successful tweezing and retrieval of the diameter and refractive index of a pure hydrocarbon droplet. Organic droplets present new challenges due to the smaller number of WGM peaks available in the narrow C-H Raman mode to use in fitting the droplet's parameters.
The second experiment we conducted to explore a partially engulfed morphology was the addition of oleic acid to a trapped aqueous NaCl droplet. We show in that the coagulation of oleic acid to the NaCl(aq) droplet formed a partial-engulfing morphology, quenching the WGMs due to interference from the lens of oleic acid on the surface of the aqueous droplet. This resulting morphology was also observed using AOT for the same system by Dennis-Smither et al. (Citation2012), and this similar result helps to validate the successful performance of our new tweezing chamber and the proper interpretation of the acquired Raman spectra. After a second longer oleic acid coagulation period, the droplet still remained in a partially engulfed morphology. This was performed to test the trapped droplet's stability during prolonged aerosol coagulation, and also to explore if the addition of a large amount of immiscible oleic acid might produce a uniform film around the aqueous droplet and a core–shell morphology. The droplet remained stably trapped during the 2 min coagulation period, with no user intervention (such as adjusting the trapping laser power) required. The lack of WGMs clearly indicates that the morphology remained partially engulfed. The addition of oleic acid during both coagulation events is observed by the increase in the signal in the hydrocarbon mode's C-H stretch region between 2850 and 3000 cm−1. From the spreading coefficient framework described above, the morphology will not change simply due to the addition of more mass of one of the phases (Kwamena et al. Citation2010; Reid et al. Citation2011; Dennis-Smither et al. Citation2012). This partially engulfed structure minimizes the Gibbs free energy of this system through reducing the interfacial surface energy, and thus the partially engulfed morphology would be expected to persist despite the addition of more organic phase.
3.3. Determination of core–shell morphology for mixtures of simple aqueous and hydrocarbon components
Hydrophobic squalane (a saturated long-chain 30 carbon triterpene, purity 99%) droplets produced by nebulization of the pure liquid were added by coagulation to a trapped aqueous NaCl droplet. This mixed system was observed to produce a core–shell morphology, and it is used to distinguish from the previous experiment using a DOS droplet mixed with aqueous glycerol that exhibited a partially engulfed morphology. This experiment was also used to confirm that our new core–shell fitting algorithm produced valid fits. An aqueous NaCl droplet was trapped and stabilized at 75% RH for 20 min to assess the starting droplet size before a short pulse of nebulized squalane aerosol was injected. shows the progression of the WGMs and the Raman spectrum after the first squalane pulse was added at 0 min. Note that after 0 min the WGMs were still present, and there was almost no change in the background intensity of the broad C-H Raman band. The hydrocarbon immersion oil used with the microscope objective is the cause of the weak background C-H Raman signal. That rules out a partially engulfed morphology, and the small signal for the C-H band suggests very little squalane was added compared to the amount of water in the droplet (observed from the O-H Raman band). As the homogeneous fit produced an unrealistic refractive index and high fit error after the first squalane addition, the morphology was likely core–shell (). A thicker squalane coating was produced by adding more squalane aerosol at 42 min and then a clear increase in the C-H Raman band was observed, with prominent WGMs on both the aqueous O-H and hydrocarbon C-H stretch modes. The retrieved refractive index and size from the homogeneous fit are now even more unphysical, as the scatter in the diameter and refractive index and a high fit error demonstrate in . Taken together these observations indicate the presence of a phase separated droplet with a core–shell morphology.
Figure 5. Raman spectra time series for a tweezed aqueous NaCl droplet coagulated with squalane aerosol. A NaCl(aq) droplet is shown at −20 min, and at 0 min squalane droplets were coagulated for the period indicated by the gray bar at the bottom. WGMs are still observed, indicating the squalane formed a thin shell coating. Following the second coagulation period of squalane at 42 min a strong C–H Raman band is observed between 2800 and 3000 cm−1, and WGMs are present in this hydrocarbon mode. This indicates the addition of significant amounts of squalane, which formed a homogeneous shell surrounding the aqueous core. A negative trend in the WGM location (bright white points/lines) indicates droplet shrinkage while a positive trend indicates growth. The chamber humidity is plotted on the top, and WGMs have a positive trend after the RH is increased. That indicates the aqueous NaCl core still can uptake water through the hydrophobic squalane shell.
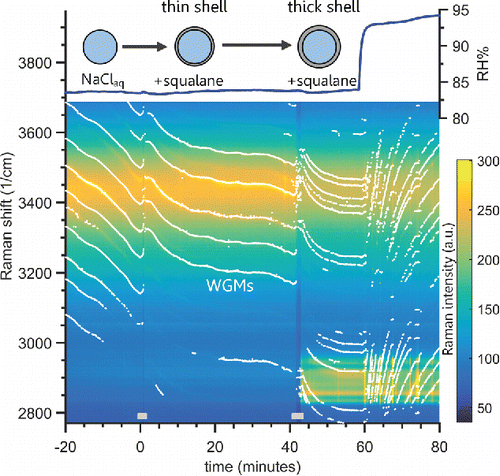
Figure 6. Droplet homogeneous Mie fit parameters for the tweezed aqueous NaCl droplet that was then coagulated with squalane aerosol from . Top panel shows the reduced χ2 fit error from fitting the WGM positions to a homogeneous Mie scattering model—note the log scale. The middle panel plots the fitted droplet refractive index (+) and diameter (o) from the Mie fit. The bottom panel shows the wavenumber position of the WGMs. The gray bars at the bottom indicate periods of squalane addition. After the first squalane addition at 0 min the fit error increased and an unrealistic change in diameter and refractive index are observed. This indicates that the WGMs do not represent a homogeneous droplet. This result was further confirmed after the second squalane addition at 42 min, where the fit error increased and the retrieved parameters changed unrealistically. This is explained by the formation of a shell of squalane around the aqueous core.
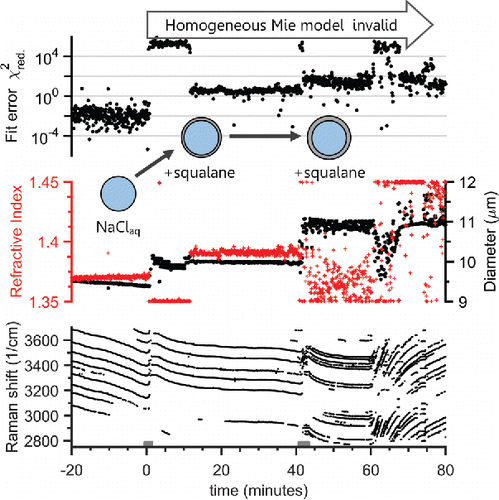
To confirm that a core–shell morphology was formed, a one spectrum frame at 60 min was fit with the new WGM core–shell algorithm. The derived parameters at 60 min indicate a core of aqueous NaCl (n650 nm = 1.3715, dp = 8.41 μm) and a shell of squalane (n650 nm = 1.4450, dp = 10.26 μm, shell thickness = 0.925 nm). The core and shell refractive indexes, and the different fit diameters, confirm that the squalane was coating the NaCl(aq) phase. Pure squalane has 1.4474 ± 0.0002 at 589.3 nm (Dubey et al. Citation2005). After 60 min, the relative humidity was increased from 83% to 93% and we observed droplet growth from the positive slope of the WGMs. The equilibration timescale we retrieved from the slope of the WGMs was 4.11 ± 0.10 min, which is within the 1.5 to 5.1 min range observed for an uncoated NaCl(aq) droplet at an RH greater than 82% (see the SI for more details). This water uptake response indicates that the aqueous NaCl core still responds promptly to gas-phase humidity changes even though it is coated by a hydrophobic shell, and the squalane has no measurable effect on the equilibration timescale. Prior AOT experiments have used an increase in the RH equilibration timescale to assess diffusion limitations of water through viscous droplet phases (Tong et al. Citation2011; Cai et al. Citation2015b).
To further support this proposed squalane shell on NaCl(aq) core morphology, we can use the surface active nature of the WGMs to explain why the homogeneous fit performed poorly and gave unphysical changes in n and dp. We use the droplet fractional radial penetration depth of the WGMs, which is approximately one minus the inverse of refractive index, (Hulst Citation1981). For most materials, we can use an upper bound of 30% of the droplet radius. This means that the WGMs do not probe the droplet from its center to 70% of its radius and only exist in the outer 30% of the droplet's radius. Therefore, the refractive index retrieved from fitting the WGMs corresponds to the composition of the droplet in the outer 30% layer of its radius. Taking this into account, and considering the small amount of squalane that was added to the droplet initially, the squalane must have formed the coating, and not the core of the droplet. In other words, for squalane to have formed the core phase it would have to compose a volume equal to greater than 70% of the droplet's radius, which would require adding the equivalent of a 7.7 μm droplet of squalane. This logic chain can be used in future phase-separation experiments to determine which phase is the shell coating versus at the core, along with the retrieved values of n. The results from the new core–shell fitting algorithm discussed above provide additional information that further validates the determination of a core–shell morphology.
4. Discussion of results
We have demonstrated how the uniformly mixed gas phase flow delivered to the trapped droplet's position in our new aerosol optical tweezers chamber design facilitates trapping and stability during the addition of a second phase through aerosol coagulation. This enables optical tweezers experiments on more complex aerosol systems that more realistically mimic atmospheric aerosol compositions. Additional material can also be added through vapor condensation. The chamber is also designed to facilitate the in situ production of secondary organic matter inside the tweezing chamber through the oxidation of precursor vapors; we will demonstrate these new capabilities in a subsequent manuscript. The drawback to the chamber's current large size is the long equilibration timescale of the tweezers chamber's air volume to changes in RH and gas-phase composition. The shortest timescale we can theoretically achieve by adjusting the airflow rates is 0.55 min. For future tweezing chambers based on this design where shorter equilibration timescales are desired, the whole height of the chamber could be compressed by at least half. The only limitation with that change is the airflow fields around the droplet must be stable and uniform so as to not push the droplet out of the optical trap. This would be largely determined by the height of the trapping chamber and providing enough distance for the airflow to expand and relax as it enters the lower tweezing chamber so it achieves a symmetrical and low velocity as it approaches the droplet. By having a shorter chamber equilibration timescale, we could also determine if there are any mass transport delays from the droplet, to the boundary layer, and then to the bulk air flow. A boundary layer to bulk air flow mass transport limitation could explain why the theoretical equilibration time (1.44 min) is lower than what we observed (1.83 ± 0.36 min). Future experiments of droplet evaporation will determine if there is a mass transport limitation of the droplet to the bulk air flow, by observing evaporation rates.
Using three liquid–liquid phase separation experiments, we demonstrated that our chamber can reliably and stably combine two immiscible phases by coagulation of a second phase to the initial aqueous or hydrocarbon droplet and subsequently determine the resulting morphology. The analysis and precise interpretation of the Raman spectra and their WGMs is limited by the use of a homogeneous Mie scattering model to fit the WGM positions. We have demonstrated that our core–shell Mie fitting algorithm can retrieve physically realistic properties of both the core and shell phases, when the experimental evidence indicates that a core–shell morphology exists. The algorithm is currently computationally expensive, requiring 24+ h to analyze a single Raman spectrum frame, and thus was only used to analyze isolated periods of the experiments. The details and capabilities of our new algorithm will be fully described and explored in a forthcoming manuscript. From these fits of both the core and shell phase properties (diameter and refractive index), we are now able to proceed in determining important quantitative properties from complex mixed aerosol experiments such as component vapor pressures, hygroscopicities, and diffusion coefficients. This can be done by trapping core–shell droplets whose two phases evaporate at different rates (measuring diffusion of the core through the shell), or have differing hygroscopicity (measuring water diffusion through the shell) (Ray and Tu Citation2013).
5. Conclusions
Our study of the morphology of immiscible aerosol systems has assembled the advanced methodology that enables future experiments on more complex atmospherically relevant droplets. We show that a squalane shell creates no measurable impedance on the uptake of water by the underlying aqueous NaCl core, determined from its measured prompt growth following a humidity ramp. We also highlight the need for an algorithm to fit unlabeled whispering gallery modes to a core–shell Mie model, and our preliminary results that can fulfill that need. Through the improvement and assessment of our core–shell algorithm, these same phase separation experiments would reveal more details about the solubility, volatility, and diffusion coefficients of the components in each of the two phases. This facilitates the analysis of more complex and realistic aerosol systems, which often adopt a core–shell morphology following phase separation.
Future experiments will investigate secondary organic matter produced in situ in the tweezing chamber and determine if the SOM mixes or does not mix with different trapped core droplet compositions. We can then determine key properties of the secondary organic matter using the core–shell fitting of tweezed droplets that are difficult to determine using other methods such as are applied to large aerosol chamber reactor experiments (Vaden et al. Citation2011; Abramson et al. Citation2013; Robinson et al. Citation2015). We have highlighted the importance and common occurrence of phase separation and its resulting morphology, and presented a methodology for using the aerosol optical tweezers to determine critical properties of complex aerosols following the addition of new material through coagulation.
UAST_1224317_Supplementary_File.zip
Download Zip (1.1 MB)Funding
Kyle Gorkowski was supported in part by a Bertucci Fellowship from Carnegie Mellon University's College of Engineering. This research was supported by the National Science Foundation (Award CHE-1213718).
Related Research Data
References
- Abbatt, J. P. D., Lee, A. K. Y., and Thornton, J. A. (2012). Quantifying Trace Gas Uptake to Tropospheric Aerosol: Recent Advances and Remaining Challenges. Chem. Soc. Rev., 41(19):6555–6581, doi:10.1039/c2cs35052a.
- Abramson, E., Imre, D., Beránek, J., Wilson, J., and Zelenyuk, A. (2013). Experimental Determination of Chemical Diffusion Within Secondary Organic Aerosol Particles. Phys. Chem. Chem. Phys., 15(8):2983–2991, doi:10.1039/c2cp44013j.
- Alexander, B., Hastings, M. G., Allman, D. J., Dachs, J., Thornton, J. A., and Kunasek, S. A. (2009). Quantifying Atmospheric Nitrate Formation Pathways Based on a Global Model of the Oxygen Isotopic Composition (Δ17O) of Atmospheric Nitrate. Atmos. Chem. Phys., 9(14):5043–5056, doi:10.5194/acp-9-5043-2009.
- Bertram, A. K., Martin, S. T., Hanna, S. J., Smith, M. L., Bodsworth, A., Chen, Q., Kuwata, M., Liu, A., You, Y., and Zorn, S. R. (2011). Predicting the Relative Humidities of Liquid-Liquid Phase Separation, Efflorescence, and Deliquescence of Mixed Particles of Ammonium Sulfate, Organic Material, and Water Using the Organic-to-Sulfate Mass Ratio of the Particle and the Oxygen-to-Carbon Elemental Ratio of the Organic Component. Atmos. Chem. Phys., 11(21):10995–11006, doi:10.5194/acp-11-10995-2011.
- Bruns, E. A., El Haddad, I., Keller, A., Klein, F., Kumar, N. K., Pieber, S. M., Corbin, J. C., Slowik, J. G., Brune, W. H., Baltensperger, U., and Prevot, A. S. H. (2015). Inter-Comparison of Laboratory Smog Chamber and Flow Reactor Systems on Organic Aerosol Yield and Composition. Atmos. Meas. Tech., 8(6):2315–2332, doi:10.5194/amt-8-2315-2015.
- Buajarern, J., Mitchem, L., and Reid, J. P. (2007a). Characterizing Multiphase Organic/Inorganic/Aqueous Aerosol Droplets. J. Phys. Chem. A, 111(37):9054–9061, doi:10.1021/jp074366a.
- Buajarern, J., Mitchem, L., and Reid, J. P. (2007b). Characterizing the Formation of Organic Layers on the Surface of Inorganic/Aqueous Aerosols by Raman Spectroscopy. J. Phys. Chem. A, 111(46):11852–11859, doi:10.1021/jp075021v.
- Bzdek, B. R., Power, R. M., Simpson, S. H., Reid, J. P., and Royall, C. P. (2016). Precise, Contactless Measurements of the Surface Tension of Picolitre Aerosol Droplets. Chem. Sci., 7(1):274–285, doi:10.1039/C5SC03184B.
- Cai, C., Stewart, D. J., Preston, T. C., Walker, J. S., Zhang, Y. H., and Reid, J. P. (2014). A New Approach to Determine Vapour Pressures and Hygroscopicities of Aqueous Aerosols Containing Semi-Volatile Organic Compounds. Phys. Chem. Chem. Phys., 16(7):3162–3172, doi:10.1039/c3cp54948h.
- Cai, C., Stewart, D. J., Reid, J. P., Zhang, Y., Ohm, P., Dutcher, C. S., and Clegg, S. L. (2015a). Organic Component Vapor Pressures and Hygroscopicities of Aqueous Aerosol Measured by Optical Tweezers. J. Phys. Chem. A, 119(4):704–718, doi:10.1021/jp510525r.
- Cai, C., Tan, S., Chen, H., Ma, J., Wang, Y., Reid, J. P., and Zhang, Y. (2015b). Slow Water Transport in MgSO4 Aerosol Droplets at Gel-Forming Relative Humidities. Phys. Chem. Chem. Phys., 17(44):29753–29763, doi:10.1039/C5CP05181A.
- Chang, E. I., and Pankow, J. F. (2006). Prediction of Activity Coefficients in Liquid Aerosol Particles Containing Organic Compounds, Dissolved Inorganic Salts, and Water—Part 2: Consideration of Phase Separation Effects by an X-Unifac Model. Atmos. Environ., 40(33):6422–6436, doi:10.1016/j.atmosenv.2006.04.031.
- Ciobanu, V. G., Marcolli, C., Krieger, U. K., Weers, U., and Peter, T. (2009). Liquid−Liquid Phase Separation in Mixed Organic/Inorganic Aerosol Particles. J. Phys. Chem. A, 113(41):10966–10978, doi:10.1021/jp905054d.
- Davies, J. F., Haddrell, A. E., Miles, R. E. H., Bull, C. R., and Reid, J. P. (2012). Bulk, Surface, and Gas-Phase Limited Water Transport in Aerosol. J. Phys. Chem. A, 116(45):10987–10998, doi:10.1021/jp3086667.
- Davis, R. D., Lance, S., Gordon, J. A., and Tolbert, M. A. (2015). Long Working-Distance Optical Trap for in Situ Analysis of Contact-Induced Phase Transformations. Anal. Chem., 87(12):6186–6194, doi:10.1021/acs.analchem.5b00809.
- Dennis-Smither, B. J., Hanford, K. L., Kwamena, N. A., Miles, R. E. H., and Reid, J. P. (2012). Phase, Morphology, and Hygroscopicity of Mixed Oleic Acid/Sodium Chloride/Water Aerosol Particles Before and after Ozonolysis. J. Phys. Chem. A, 116(24):6159–6168, doi:10.1021/jp211429f.
- Donahue, N. M., Robinson, A. L., Trump, E. R., Riipinen, I., and Kroll, J. H. (2012). Volatility and Aging of Atmospheric Organic Aerosol. Springer, Berlin, Heidelberg, pp. 97–143.
- Drozd, G. T., Woo, J. L., and McNeill, V. F. (2013). Self-Limited Uptake of α-Pinene Oxide to Acidic Aerosol: The Effects of Liquid–Liquid Phase Separation and Implications for the Formation of Secondary Organic Aerosol and Organosulfates from Epoxides. Atmos. Chem. Phys., 13(16):8255–8263, doi:10.5194/acp-13-8255-2013.
- Dubey, G. P., Tripathi, N., and Bhatia, S. C. (2005). Refractive Index of Ternary Liquid Systems of Squalane (+ Hexane + Benzene; + Cyclohexane + Benzene and + Hexane + Cyclohexane). Indian J. Pure Appl. Phys., 43(3):175–179.
- Emanuelsson, E. U., Hallquist, M., Kristensen, K., Glasius, M., Bohn, B., Fuchs, H., Kammer, B., Kiendler-Scharr, A., Nehr, S., Rubach, F., Tillmann, R., Wahner, A., Wu, H.-C., and Mentel, T. F. (2013). Formation of Anthropogenic Secondary Organic Aerosol (SOA) and its Influence on Biogenic SOA Properties. Atmos. Chem. Phys., 13(5):2837–2855, doi:10.5194/acp-13-2837-2013.
- Evans, M. J. (2005). Impact of New Laboratory Studies of N2O5 Hydrolysis on Global Model Budgets of Tropospheric Nitrogen Oxides, Ozone, and OH. Geophys. Res. Lett., 32(9):L09813, doi:10.1029/2005GL022469.
- Gaston, C. J., and Thornton, J. A. (2016). Reacto-Diffusive Length of N2O5 in Aqueous Sulfate- and Chloride-Containing Aerosol Particles. J. Phys. Chem. A, 120(7):1039–1045, doi:10.1021/acs.jpca.5b11914.
- Hallquist, M., Stewart, D. J., Baker, J., and Cox, R. A. (2000). Hydrolysis of N2O5 on Submicron Sulfuric Acid Aerosols. J. Phys. Chem. A, 104(17):3984–3990, doi:10.1021/jp9939625.
- Hallquist, M., Wenger, J. C., Baltensperger, U., Rudich, Y., Simpson, D., Claeys, M., Dommen, J., Donahue, N. M., George, C., Goldstein, A. H., Hamilton, J. F., Herrmann, H., Hoffmann, T., Iinuma, Y., Jang, M., Jenkin, M. E., Jimenez, J. L., Kiendler-Scharr, A., Maenhaut, W., McFiggans, G., Mentel, T. F., Monod, A., Prévôt, A. S. H., Seinfeld, J. H., Surratt, J. D., Szmigielski, R., and Wildt, J. (2009). The Formation, Properties and Impact of Secondary Organic Aerosol: Current and Emerging Issues. Atmos. Chem. Phys., 9(14):5155–5236, doi:10.5194/acp-9-5155-2009.
- Hekayati, J., Roosta, A., and Javanmardi, J. (2016). Liquid–Liquid Equilibria in the Quinary Aqueous Two-Phase System of Poly(Ethylene Glycol) 6000+Sodium Sulfate+Water in the Presence of Glucose and Ethanol: Experimental Investigation and Thermodynamic Modeling. Thermochim. Acta, 625:47–52, doi:10.1016/j.tca.2015.12.013.
- Hopkins, R. J., Mitchem, L., Ward, A. D., and Reid, J. P. (2004). Control and Characterisation of a Single Aerosol Droplet in a Single-Beam Gradient-Force Optical Trap. Phys. Chem. Chem. Phys., 6(21):4924–4927, doi:10.1039/b414459g.
- Hulst, H. C. (1981). Light Scattering by Small Particles. John Wiley & Sons, New York.
- IPCC: Climate Change 2013. (2013). Contribution of Working Group I to the Fifth Assessment Report of the Intergovern- Mental Panel on Climate Change, in The Physical Science Basis, P. M. M. Stocker, T. F. D. Qin, G.-K. Plattner, M. Tignor, S. K. Allen, J. Boschung, A. Nauels, Y., Xia, V. Bex, eds., Cambridge University Press, Cambridge, pp. 6589–740.
- Kanakidou, M., Seinfeld, J. H., Pandis, S. N., Barnes, I., Dentener, F. J., Facchini, M. C., Van Dingenen, R., Ervens, B., Nenes, A., Nielsen, C. J., Swietlicki, E., Putaud, J. P., Balkanski, Y., Fuzzi, S., Horth, J., Moortgat, G. K., Winterhalter, R., Myhre, C. E. L., Tsigaridis, K., Vignati, E., Stephanou, E. G., and Wilson, J. (2005). Organic Aerosol and Global Climate Modelling: A Review. Atmos. Chem. Phys., 5(4):1053–1123, doi:10.5194/acp-5-1053-2005.
- Koop, T., Bookhold, J., Shiraiwa, M., and Pöschl, U. (2011). Glass Transition and Phase State of Organic Compounds: Dependency on Molecular Properties and Implications for Secondary Organic Aerosols in the Atmosphere. Phys. Chem. Chem. Phys., 13(43):19238–19255, doi:10.1039/c1cp22617g.
- Kwamena, N.-O. A., Buajarern, J., and Reid, J. P. (2010). Equilibrium Morphology of Mixed Organic/Inorganic/Aqueous Aerosol Droplets: Investigating the Effect of Relative Humidity and Surfactants. J. Phys. Chem. A, 114(18):5787–5795, doi:10.1021/jp1003648.
- Li, Y. J., Liu, P., Gong, Z., Wang, Y., Bateman, A. P., Bergoend, C., Bertram, A. K., and Martin, S. T. (2015). Chemical Reactivity and Liquid/Nonliquid States of Secondary Organic Material. Environ. Sci. Technol., 49(22):13264–13274, doi:10.1021/acs.est.5b03392.
- Loza, C. L., Coggon, M. M., Nguyen, T. B., Zuend, A., Flagan, R. C., and Seinfeld, J. H. (2013). On the Mixing and Evaporation of Secondary Organic Aerosol Components. Environ. Sci. Technol., 47(12):6173–6180, doi:10.1021/es400979k.
- Lu, J. W., Rickards, A. M. J., Walker, J. S., Knox, K. J., Miles, R. E. H., Reid, J. P., and Signorell, R. (2014). Timescales of Water Transport in Viscous Aerosol: Measurements on Sub-Micron Particles and Dependence on Conditioning History. Phys. Chem. Chem. Phys., 16(21):9819–9830, doi:10.1039/C3CP54233E.
- Matsko, A. B., and Ilchenko, V. S. (2006). Optical Resonators with Whispering-Gallery Modes-Part I: Basics. IEEE J. Sel. Top. Quantum Electron., 12(1):3–14, doi:10.1109/JSTQE.2005.862952.
- McNeill, V. F., Patterson, J., Wolfe, G. M., and Thornton, J. A. (2006). The Effect of Varying Levels of Surfactant on the Reactive Uptake of N2O5 to Aqueous Aerosol. Atmos. Chem. Phys., 6(6):1635–1644, doi:10.5194/acp-6-1635-2006.
- Metcalf, A. R., Boyer, H. C., and Dutcher, C. S. (2016). Interfacial Tensions of Aged Organic Aerosol Particle Mimics Using a Biphasic Microfluidic Platform. Environ. Sci. Technol., 50(3):1251–1259, doi:10.1021/acs.est.5b04880.
- Miles, R. E. H., Reid, J. P., and Riipinen, I. (2012). Comparison of Approaches for Measuring the Mass Accommodation Coefficient for the Condensation of Water and Sensitivities to Uncertainties in Thermophysical Properties. J. Phys. Chem. A, 116(44):10810–10825, doi:10.1021/jp3083858.
- Mitchem, L., and Reid, J. P. (2008). Optical Manipulation and Characterisation of Aerosol Particles using a Single-Beam Gradient Force Optical Trap. Chem. Soc. Rev., 37(4):756–769, doi:10.1039/b609713h.
- Murphy, D. M., Cziczo, D. J., Froyd, K. D., Hudson, P. K., Matthew, B. M., Middlebrook, A. M., Peltier, R. E., Sullivan, A., Thomson, D. S., and Weber, R. J. (2006). Single-Particle Mass Spectrometry of Tropospheric Aerosol Particles. J. Geophys. Res., 111(D23):D23S32, doi:10.1029/2006jd007340.
- O'Brien, R. E., Wang, B., Kelly, S. T., Lundt, N., You, Y., Bertram, A. K., Leone, S. R., Laskin, A., and Gilles, M. K. (2015). Liquid–Liquid Phase Separation in Aerosol Particles: Imaging at the Nanometer Scale. Environ. Sci. Technol., 49(8):4995–5002, doi:10.1021/acs.est.5b00062.
- Ortega, A. M., Day, D. A., Cubison, M. J., Brune, W. H., Bon, D., de Gouw, J. A., and Jimenez, J. L. (2013). Secondary Organic Aerosol Formation and Primary Organic Aerosol Oxidation from Biomass-Burning Smoke in a Flow Reactor During Flame-3. Atmos. Chem. Phys., 13(22):11551–11571, doi:10.5194/acp-13-11551-2013.
- Platt, S. M., El Haddad, I., Zardini, A. A., Clairotte, M., Astorga, C., Wolf, R., Slowik, J. G., Temime-Roussel, B., Marchand, N., Ježek, I., Drinovec, L., Močnik, G., Möhler, O., Richter, R., Barmet, P., Bianchi, F., Baltensperger, U., and Prévôt, A. S. H. (2013). Secondary Organic Aerosol Formation from Gasoline Vehicle Emissions in a New Mobile Environmental Reaction Chamber. Atmos. Chem. Phys., 13(18):9141–9158, doi:10.5194/acp-13-9141-2013.
- Pope, C. A., Ezzati, M., and Dockery, D. W. (2009). Fine-Particulate Air Pollution and Life Expectancy in the United States. N. Engl. J. Med., 360(4):376–86, doi:10.1056/NEJMsa0805646.
- Preston, T. C., and Reid, J. P. (2013). Accurate and Efficient Determination of the Radius, Refractive Index, and Dispersion of Weakly Absorbing Spherical Particle using Whispering Gallery Modes. J. Opt. Soc. Am. B-Optical Phys., 30(8):2113–2122, doi:10.1364/josab.30.002113.
- Preston, T. C., and Reid, J. P. (2015). Determining the Size and Refractive Index of Microspheres using the Mode Assignments from Mie Resonances. J. Opt. Soc. Am. A, 32(11):2210–2122, doi:10.1364/JOSAA.32.002210.
- Qiu, Y., and Molinero, V. (2015). Morphology of Liquid–Liquid Phase Separated Aerosols. J. Am. Chem. Soc., 137(33):10642–10651, doi:10.1021/jacs.5b05579.
- Ray, A., Devakottai, B., Souyri, A., and Huckaby, J. (1991). Evaporation Characteristics of Droplets Coated with Immiscible Layers of Nonvolatile Liquids. Langmuir, 7(3):525–531.
- Ray, A. K., Johnson, R. D., and Souyri, A. (1989). Dynamic Behavior of Single Glycerol Droplets in Humid Air Streams. Langmuir, 5(1):133–140, doi:10.1021/la00085a024.
- Ray, A. K., and Nandakumar, R. (1995). Simultaneous Determination of Size and Wavelength-Dependent Refractive Indices of Thin-Layered Droplets from Optical Resonances. Appl. Opt., 34(33):7759–7770, doi:10.1364/AO.34.007759.
- Ray, A. K., and Tu, H. (2013). Evaporation Dynamics of Microdroplets Coated with Nonvolatile Liquid Layers. Chem. Eng. Trans., 32:1933–1938.
- Redding, B., Schwab, M., and Pan, Y. (2015). Raman Spectroscopy of Optically Trapped Single Biological Micro-Particles. Sensors, 15(8):19021–19046, doi:10.3390/s150819021.
- Reid, J. P., Dennis-Smither, B. J., Kwamena, N.-O. A., Miles, R. E. H., Hanford, K. L., and Homer, C. J. (2011). The Morphology of Aerosol Particles Consisting of Hydrophobic and Hydrophilic Phases: Hydrocarbons, Alcohols and Fatty Acids as the Hydrophobic Component. Phys. Chem. Chem. Phys., 13(34):15559–15572, doi:10.1039/c1cp21510h.
- Renbaum-Wolff, L., Song, M., Marcolli, C., Zhang, Y., Liu, P. F., Grayson, J. W., Geiger, F. M., Martin, S. T., and Bertram, A. K. (2016). Observations and Implications of Liquid–Liquid Phase Separation at High Relative Humidities in Secondary Organic Material Produced by α-Pinene Ozonolysis without Inorganic Salts. Atmos. Chem. Phys. Discuss., 16:7969–7979.
- Rheims, J., Köser, J., and Wriedt, T. (1999). Refractive-Index Measurements in the Near-IR using an Abbe Refractometer. Meas. Sci. Technol., 8(6):601–605, doi:10.1088/0957-0233/8/6/003.
- Rickards, A. M. J., Miles, R. E. H., Davies, J. F., Marshall, F. H., and Reid, J. P. (2013). Measurements of the Sensitivity of Aerosol Hygroscopicity and the κ Parameter to the O/C Ratio. J. Phys. Chem. A, 117(51):14120–14131, doi:10.1021/jp407991n.
- Riemer, N., Vogel, H., Vogel, B., Anttila, T., Kiendler-Scharr, A., and Mentel, T. F. (2009). Relative Importance of Organic Coatings for the Heterogeneous Hydrolysis of N2O5 During Summer in Europe. J. Geophys. Res., 114(D17):D17307, doi:10.1029/2008JD011369.
- Robinson, E. S., Saleh, R., and Donahue, N. M. (2013). Organic Aerosol Mixing Observed by Single-Particle Mass Spectrometry. J. Phys. Chem. A, 117(51):13935–13945, doi:10.1021/jp405789t.
- Robinson, E. S., Saleh, R., and Donahue, N. M. (2015). Probing the Evaporation Dynamics of Mixed SOA/Squalane Particles Using Size-Resolved Composition and Single-Particle Measurements. Environ. Sci. Technol., 49(16):9724–9732, doi:10.1021/acs.est.5b01692.
- Schill, G. P., and Tolbert, M. A. (2013). Heterogeneous Ice Nucleation on Phase-Separated Organic-Sulfate Particles: Effect of Liquid vs. Glassy Coatings. Atmos. Chem. Phys., 13(9):4681–4695, doi:10.5194/acp-13-4681-2013.
- Shen, S.-C., Wang, Y. J., and Chen, Y.-Y. (2008). Design and Fabrication of Medical Micro-Nebulizer. Sensors Actuators A Phys., 144(1):135–143, doi:10.1016/j.sna.2007.12.004.
- Shindell, D. T., Faluvegi, G., Koch, D. M., Schmidt, G. A., Unger, N., and Bauer, S. E. (2009). Improved Attribution of Climate Forcing to Emissions. Science (80-.)., 326(5953):716–718, doi:10.1126/science.1174760.
- Shiraiwa, M., Pfrang, C., Koop, T., and Pöschl, U. (2012). Kinetic Multi-Layer Model of Gas-Particle Interactions in Aerosols and Clouds (Km-GAP): Linking Condensation, Evaporation and Chemical Reactions of Organics, Oxidants and Water. Atmos. Chem. Phys., 12(5):2777–2794, doi:10.5194/acp-12-2777-2012.
- Song, M., Marcolli, C., Krieger, U. K., Lienhard, D. M., and Peter, T. (2013). Morphologies of Mixed Organic/Inorganic/Aqueous Aerosol Droplets. Faraday Discuss., 165:289–316, doi:10.1039/c3fd00049d.
- Song, M., Marcolli, C., Krieger, U. K., Zuend, A., and Peter, T. (2012a). Liquid-Liquid Phase Separation and Morphology of Internally Mixed Dicarboxylic Acids/Ammonium Sulfate/Water Particles. Atmos. Chem. Phys., 12(5):2691–2712, doi:10.5194/acp-12-2691-2012.
- Song, M., Marcolli, C., Krieger, U. K., Zuend, A., and Peter, T. (2012b). Liquid-Liquid Phase Separation in Aerosol Particles: Dependence on O:C, Organic Functionalities, and Compositional Complexity. Geophys. Res. Lett., 39(19):L19801, doi:10.1029/2012GL052807.
- Stewart, D. J., Cai, C., Nayler, J., Preston, T. C., Reid, J. P., Krieger, U. K., Marcolli, C., and Zhang, Y.-H. H. (2015). Liquid–Liquid Phase Separation in Mixed Organic/Inorganic Single Aqueous Aerosol Droplets. J. Phys. Chem. A, 119(18):4177–4190, doi:10.1021/acs.jpca.5b01658.
- Tong, H.-J., Reid, J. P., Bones, D. L., Luo, B. P., and Krieger, U. K. (2011). Measurements of the Timescales for the Mass Transfer of Water in Glassy Aerosol at Low Relative Humidity and Ambient Temperature. Atmos. Chem. Phys., 11(10):4739–4754, doi:10.5194/acp-11-4739-2011.
- Tsigaridis, K., Daskalakis, N., Kanakidou, M., Adams, P. J., Artaxo, P., Bahadur, R., Balkanski, Y., Bauer, S. E., Bellouin, N., Benedetti, A., Bergman, T., Berntsen, T. K., Beukes, J. P., Bian, H., Carslaw, K. S., Chin, M., Curci, G., Diehl, T., Easter, R. C., Ghan, S. J., Gong, S. L., Hodzic, A., Hoyle, C. R., Iversen, T., Jathar, S., Jimenez, J. L., Kaiser, J. W., Kirkev??g, A., Koch, D., Kokkola, H., H Lee, Y., Lin, G., Liu, X., Luo, G., Ma, X., Mann, G. W., Mihalopoulos, N., Morcrette, J. J., M??ller, J. F., Myhre, G., Myriokefalitakis, S., Ng, N. L., O'donnell, D., Penner, J. E., Pozzoli, L., Pringle, K. J., Russell, L. M., Schulz, M., Sciare, J., Seland, Shindell D. T., Sillman, S., Skeie, R. B., Spracklen, D., Stavrakou, T., Steenrod, S. D., Takemura, T., Tiitta, P., Tilmes, S., Tost, H., Van Noije, T., Van Zyl, P. G., Von Salzen, K., Yu, F., Wang, Z., Wang, Z., Zaveri, R. A., Zhang, H., Zhang, K., Zhang, Q., and Zhang, X. (2014). The AeroCom Evaluation and Intercomparison of Organic Aerosol in Global Models. Atmos. Chem. Phys., 14(19):10845–10895, doi:10.5194/acp-14-10845-2014.
- Vaden, T. D., Imre, D., Beránek, J., Shrivastava, M., and Zelenyuk, A. (2011). Evaporation Kinetics and Phase of Laboratory and Ambient Secondary Organic Aerosol. Proc. Natl. Acad. Sci. U. S. A., 108(6):2190–2195, doi:10.1073/pnas.1013391108.
- Veghte, D. P., Altaf, M. B., and Freedman, M. A. (2013). Size Dependence of the Structure of Organic Aerosol. J. Am. Chem. Soc., 135(43):16046–16049, doi:10.1021/ja408903g.
- Verdeny, I., Farré, A., Mas, J., López-Quesada, C., Martín-Badosa, E., and Montes-Usategui, M. (2011). Optical Trapping: A Review of Essential Concepts. Óptica Pura Y Apl., 44:527–551.
- Wheeler, M. J., and Bertram, A. K. (2012). Deposition Nucleation on Mineral Dust Particles: A Case Against Classical Nucleation Theory with the Assumption of a Single Contact Angle. Atmos. Chem. Phys., 12(2):1189–1201, doi:10.5194/acp-12-1189-2012.
- Wills, J. B., Knox, K. J., and Reid, J. P. (2009). Optical Control and Characterisation of Aerosol. Chem. Phys. Lett., 481(4–6):153–165, doi:10.1016/j.cplett.2009.09.020.
- Yang, J. J., Huang, M., Yu, J., and Lan, Y. Z. (2011). Surface Whispering-Gallery Mode. Europhys. Lett., 96(5):57003, doi:10.1209/0295-5075/96/57003.
- You, Y., and Bertram, A. K. (2015). Effects of Molecular Weight and Temperature on Liquid–Liquid Phase Separation in Particles Containing Organic Species and Inorganic Salts. Atmos. Chem. Phys., 15(3):1351–1365, doi:10.5194/acp-15-1351-2015.
- You, Y., Renbaum-Wolff, L., Carreras-Sospedra, M., Hanna, S. J., Hiranuma, N., Kamal, S., Smith, M. L., Zhang, X., Weber, R. J., Shilling, J. E., Dabdub, D., Martin, S. T., and Bertram, A. K. (2012). Images Reveal that Atmospheric Particles can Undergo Liquid-Liquid Phase Separations. Proc. Natl. Acad. Sci. U. S. A., 109(33):13188–13193, doi:10.1073/pnas.1206414109.
- You, Y., Smith, M. L., Song, M., Martin, S. T., and Bertram, A. K. (2014). Liquid–Liquid Phase Separation in Atmospherically Relevant Particles Consisting of Organic Species and Inorganic Salts. Int. Rev. Phys. Chem., 33(1):43–77, doi:10.1080/0144235X.2014.890786.
- Zhang, Q., Jimenez, J. L., Canagaratna, M. R., Allan, J. D., Coe, H., Ulbrich, I., Alfarra, M. R., Takami, A., Middlebrook, A. M., Sun, Y. L., Dzepina, K., Dunlea, E., Docherty, K., DeCarlo, P. F., Salcedo, D., Onasch, T., Jayne, J. T., Miyoshi, T., Shimono, A., Hatakeyama, S., Takegawa, N., Kondo, Y., Schneider, J., Drewnick, F., Borrmann, S., Weimer, S., Demerjian, K., Williams, P., Bower, K., Bahreini, R., Cottrell, L., Griffin, R. J., Rautiainen, J., Sun, J. Y., Zhang, Y. M., and Worsnop, D. R. (2007). Ubiquity and Dominance of Oxygenated Species in Organic Aerosols in Anthropogenically-Influenced Northern Hemisphere Midlatitudes. Geophys. Res. Lett., 34(13):1–6, doi:10.1029/2007GL029979.
- Zuend, A., Marcolli, C., Peter, T., and Seinfeld, J. H. (2010). Computation of Liquid-Liquid Equilibria and Phase Stabilities: Implications for RH-Dependent Gas/Particle Partitioning of Organic-Inorganic Aerosols. Atmos. Chem. Phys., 10(16):7795–7820, doi:10.5194/acp-10-7795-2010.