
ABSTRACT
Understanding transport characteristics of airborne nanotubes and nanofibers is important for assessing their fate in the respiratory system. Typically, diffusion and aerodynamic diameters capture key deposition mechanisms of near-spherical particles such as diffusion and impaction in the submicrometer size range. For nonspherical particles with high aspect ratios, such as aerosolized carbon nanotubes, these diameters can vary widely, requiring their independent measurement. The objective of this study was to develop an approach to provide approximate estimates of aerodynamic- and diffusion-equivalent diameters of airborne carbon nanotubes (CNTs) and carbon nanofibers (CNFs) using their morphological characteristics obtained from electron micrographs. The as-received CNT and CNF materials were aerosolized using different techniques such as dry dispersion and nebulization. Mobility and aerodynamic diameters of test aerosol were directly deduced from tandem measurement of particle mobility and mass. The same test aerosol was mobility-classified and subsequently collected on a microscopy grid for transmission electron microscopy (TEM) analysis. TEM micrographs were used to obtain projected area, maximum projected length, and two-dimensional (2-D) radius of gyration of test particles. Estimates of the aerodynamic diameter and the diffusion diameter were obtained by applying the fractal theory developed for aerosol agglomerates of primary spherical particles. After accounting for the particle dynamic shape factor, estimated aerodynamic diameters agreed with those from the direct measurements (using tandem mobility-mass technique) within 30–40% for the agglomerates with relatively open structures while the diffusion diameters agreed within 40–50%. The uncertainty of these estimates mainly depends on degree of overlapping structures in the microscopy image and nonuniformity in tube diameter. The approach could be useful in calculating approximate airborne properties from microscopy images of CNT and CNF agglomerates with relatively open structures.
This article not subject to US copyright law
EDITOR:
1. Introduction
The growing industrial production of carbon nanotubes (CNTs) and carbon nanofibers (CNFs) has led to rising concerns over the health hazards associated with their pulmonary exposure (NIOSH Citation2013; Donaldson et al. Citation2010; Lam et al. Citation2004). Quantifying risks associated with workplace exposures is critical for promoting worker health and safety, and responsible growth of nanotechnology industry (NIOSH Citation2009). Knowing transport characteristics of workplace aerosol particles is important in assessing their fate in the respiratory system of workers who are potentially exposed to CNTs and CNFs. In this context, inhalation of airborne nanomaterials and their deposition in the respiratory system is getting more attention during the process-related workers' activities in the workplace (NIOSH Citation2009, Citation2013). Some toxicological studies of single-walled and multi-walled CNTs (SWCNTs and MWCNTs) and CNFs have demonstrated that these materials can cause fibrogenic pulmonary responses, and promote inflammation, genotoxicity, and/or a potential carcinogenesis and mesothelioma (Sargent et al. Citation2014; Takagi et al. Citation2008; Shvedova et al. Citation2005; Kisin et al. Citation2011; Poland et al. Citation2008). Though individual SWCNTs and MWCNTs have fibrous morphologies, most airborne particles are in agglomerated state consisting of complex and intricate network of nanotubes and nanoropes. These irregular-shaped agglomerates are characterized by large open and porous structure, high surface area, moderate aspect ratio (of the overall agglomerate), and extremely low effective density that lead to their familiar floating or slow settling in air. Their overall physical size, inferred from transmission electron microscopy (TEM) micrograph, has been found to be larger by up to a factor of 10 compared to their aerodynamic size (Baron et al. Citation2008). Our recent laboratory study has also shown that diffusion-equivalent diameters of airborne SWCNTs and MWCNTs can be larger by a factor of up to six compared to their aerodynamic diameters (Ku and Kulkarni Citation2015; Kulkarni et al. Citation2009).
Direct-reading instruments that measure aerodynamic or diffusion (or mobility) diameter are essential to assessing exposures of CNTs (Maynard et al. Citation2004; Evans et al. Citation2010; Heitbrink et al. Citation2009); however, they may not be readily available when monitoring exposures in the workplace. Electron microscopy (EM) analysis of air samples is a useful off-line method for characterizing CNT/CNF particle morphology and structure (Birch et al. Citation2017). Filter or microscopy samples of workplace aerosols are often readily available and can be used to characterize particle morphology and structure using EM. The objective of this study was to estimate aerodynamic and diffusion-equivalent (or mobility) diameters of airborne CNTs from their physical morphological information available from EM. Fractal theory, developed for idealized agglomerates of spherical primary particles, was applied to agglomerates of nanotubes and nanofibers to estimate their equivalent diameters and effective density. The accuracy of the estimation approach was obtained by comparing the measurement to those obtained from direct tandem mass and mobility measurements in laboratory test aerosols. The details of calculation approach and experimental measurements are presented and discussed.
2. Estimation of aerodynamic and mobility diameters from TEM images
2.1. Description of ideal fractals of agglomerates of spherical primary particles
Fractals are self-similar structures (Vicsek Citation1992; Jullien and Botet Citation1987; Cai et al. Citation1995; Meakin Citation1988; Sorensen and Roberts Citation1997). Aerosol agglomerates formed by diffusion limited agglomeration of primary particles have been shown to exhibit fractal properties (Baron et al. Citation2001; Sorensen Citation2011). It has been shown that the number of primary particles, Np, in the agglomerates scales as a power law with the reduced size of the agglomerate as[1] where a is the primary particle radius, Rg is the radius of gyration of the agglomerate, k0 is the scaling prefactor (or structural coefficient), and Df is the fractal dimension. Typically for soot agglomerates of spherical primary particles formed in combustion systems from diffusion limited growth Df = 1.78−1.92 and k0 ∼ 1.3.
The radius of gyration is expressed as[2] where m is the mass of the primary particle and ri is the distance from the center of mass of the ith primary particle to that of the agglomerate (Friedlander Citation2000). The radius of gyration is a purely geometric parameter that depends only on the spatial distribution of the primary particles in the agglomerate. The following relationship between mobility radius of an agglomerate, Rm, and the number of primary particles Np in an agglomerate, has been shown to exist (Sorensen Citation2011; Ku and Kulkarni Citation2015; Wang et al. Citation2015; Ku et al. Citation2006),
[3] where Dm is the mass-mobility scaling exponent for silica, soot, silver agglomerates, and fibrous particle agglomerates such as CNTs and CNFs with Dm = 1.74 – 2.40. (i.e., Dm = Df).
The dynamic shape factor (χ) of a particle is defined as the ratio of the actual drag force on the particle to that on an imaginary sphere with the same volume as the particle (Kulkarni et al. Citation2011).[4] where f(Rm) is the drag coefficient based on mobility radius Rm, and f(Rve) is drag coefficient for volume-equivalent radius Rve. As the drag coefficient is proportional to radius in the Stokes regime, after accounting for slip correction the above equations reduces to,
[5] where C(Kn) is the Cunningham slip correction factor and Kn is the Knudsen number.
2.1.1. Calculation of radius of gyration from TEM images
Projected transmission electron microscope (TEM) image-based (i.e., two-dimensional [2-D]) radius of gyration of a particle, Rg, TEM, can be simplified from Equation (Equation2[2] ) as
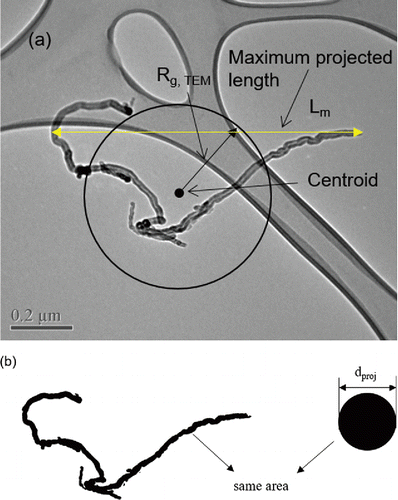
[6] where rc and rk are position vectors representing the center of mass of the image and the center of the kth pixel, respectively, and Npx is number of pixels in the image. shows the TEM image analysis for obtaining projected surface area, maximum projected length, and radius of gyration of the projected image. The particle image () taken by TEM was converted to a binary image (). From the binary image, the projected surface area, maximum projected length, and coordinates of centroid of the image were obtained using ImageJ software (Rasband Citation2014). The radius of gyration of the projected particle image was directly calculated using ImageJ software (Rasband Citation2014) that provides the information about pixel coordinates of the image.
Figure 1. TEM image analysis for projected surface area, maximum projected length, and radius of gyration for MWCNT particle using ImageJ software (Rasband Citation2014). (a) Original TEM image, (b) black and white binary image to obtain projected area of the particle, and its corresponding projected area diameter.
An indirect approach to calculating the 2D radius of gyration Rg, 2D was also investigated to compare to direct calculation and to prove that the indirect approach can be applied to CNT aerosol agglomerates, like fractal-like particles. Three-dimensional radius of gyration Rg, 3D is related with the 2D radius of gyration and the maximum projected length Lm of a fractal-like agglomerate shape via the following equation (Kulkarni et al. Citation2011; Koylu et al. Citation1995; Brasil et al. Citation1999) for Np in the range of 100–1,000 and Df = 1.78.[7]
Rg,3D is related to 2D (projected) radius of gyration Rg,2D (Koylu et al. Citation1995) as follows: for Np in the range of 20–1,000 and Df = 1.78.[8]
2.1.2. Dynamic shape factor
According to fractal theory on the mobility of fractal agglomerates (Sorensen Citation2011; Rogak et al. Citation1993), the mobility radius of the agglomerate is proportional to its radius of gyration,[9]
Further, by assuming that the ratio of mobility radius to volume-equivalent radius could be approximated by the ratio of particle radius of gyration and projected-area equivalent radius, one can write,[10] where Rg,TEM and Rproj are radii of the 2D gyration and projected area from TEM image, respectively. The above approximation was evaluated by comparing the two ratios shown in Equation (Equation10
[10] ) for the particle morphologies (from TEM) obtained in this study (Figure S1 in the online supplementary information [SI]). Using the above equation, one can obtain an approximate estimate of dynamic shape factor of particles from microscopy image.
2.1.3. Mobility diameter
From the relation between Rm and Np (Equation (Equation3[3] )), the mobility radius Rm of the fractal agglomerate is calculated using approach outlined by Sorensen and coworkers (Sorensen Citation2011) as follows:
[11] where
, 0.46 < x < 0.56, x is the mobility-mass scaling exponent, a is the radius of a primary particle, and Kn is the Knudsen number, which is the ratio of the molecular mean free path to the agglomerate mobility radius.
2.2. Calculation of aerodynamic diameter of nanotube agglomerate
The relationships between different physical descriptors, noted above, are extended to fibrous particle agglomerates studied in this work. We must note that the agglomerates studied in this work (and often found in real-world workplace samples) do not strictly exhibit fractal geometry. However, it has been shown that these agglomerates exhibit mass-scaling relationship similar to that of fractals (Ku and Kulkarni Citation2015), although over a limited range of agglomerate size and mobility diameter. We assume that this scaling of agglomerate mass as a function of its overall size, makes these agglomerates exhibit fractal-like behavior.
In order to estimate the aerodynamic diameter, one must know or approximate the tube diameter and material density a priori. The aerodynamic diameter is obtained using a standard reference density and particle mass, which is obtained from the TEM image alone without accounting for the particle shape effect. To more accurately estimate aerodynamic diameter, we need to consider a particle's dynamic shape factor. The overall approach to compute aerodynamic diameter from TEM micrograph is as follows:
| 1. | Calculate projected area (Ap) of an agglomerate from its TEM micrograph. | ||||
| 2. | Calculate imaginary length (Li) by dividing the projected area of the particle/agglomerate by the diameter of the individual nanotube/nanofiber strand (must be known a priori). | ||||
| 3. | Calculate the volume (Va) of the agglomerate by using the imaginary length of the nanotube/nanofiber and its cross-sectional area (based on the tube/fiber diameter). | ||||
| 4. | Calculate the agglomerate mass (mp) using volume and material density (ρp; known a priori and we assume the density of ∼ 2 g cm−3 for MWCNTs and CNF) of the particle. | ||||
| 5. | Calculate aerodynamic diameter (dae) from mass and standard reference density (ρ0 = 1 g cm−3), | ||||
| 6. | Calculate dynamic shape factor (χ) using Equation (Equation10 | ||||
| 7. | Correct the dae calculated in Step 5 using the χ calculated in Step 6. | ||||
The aerodynamic diameter, after correcting for particle's shape factor is obtained as follows:[13]
2.3. Calculation of mobility radius from TEM images
From TEM image and fractal parameterization given by Sorensen et al. (Citation2011), mobility radius (Rm) of CNT agglomerate can be estimated as follows:
| 1. | Calculate projected area, imaginary length, and volume of an agglomerate from the TEM image as mentioned above. | ||||
| 2. | Calculate number (Np) of primary particles corresponding to the volume, assuming that the CNT agglomerate is a fractal-like agglomerate and primary particle size is the same as the tube diameter. | ||||
| 3. | Calculate Rm using Equation (Equation11 | ||||
| 4. | Correct Kn (Rm) with true Rm. | ||||
3. Experimental methods
3.1. Nanomaterials
Different types of nanomaterials were studied: SWCNTs, MWCNTs, and CNFs. High-pressure carbon monoxide SWCNT material was purchased from Carbon Nanotechnologies Inc. (CNI, Houston, TX, USA), MWCNT (95+%, OD 10–20 nm, length 10–30 µm; stock #: 1205YJ) from Nanostructured & Amorphous Materials, Inc. (Houston, TX, USA), Mitsui MWCNTs from Mitsui & Co. (Ibaraki, Japan), and Pyrograf- III CNFs (Type PR-24, Grade LHT) from Applied Sciences Inc. (Cedarville, OH, USA). summarizes physical properties and aerosolization methods for nanomaterials used in this study.
Table 1. Nanomaterials and aerosolization methods used in this study.
3.2. Aerosol generation
We considered two generation techniques to aerosolize test materials: dry powder dispersion and liquid-based generation. Test CNT and CNF material powders (i.e., MWCNT1, MWCNT2, SWCNT, and CNF as shown in ) were aerosolized from dry powders using a vortex shaking method (Ku et al. Citation2006; Ku et al. Citation2013; Ku and Kulkarni Citation2015). The characteristics of the vortex shaking method have been fully investigated in a recent study (Ku et al. Citation2013). Briefly, the test nanomaterial powder in a glass tube is vigorously mechanically agitated by a vortex shaker (Vortex Genie 2, Model G560, Scientific Industries Inc., Bohemia, NY, USA). A cloud of airborne fibrous particles is generated and filtered airflow provided into the glass tube sweeps the floated particles out as an aerosol. This generation technique was found to give relative stable size distributions of airborne MWCNTs for one or two hours, as shown in a previous study (Ku and Kulkarni Citation2015).
Liquid-based generation technique was used to pneumatically atomize suspension of the same MWCNT1, using a constant output atomizer (model 3073, TSI Inc., Shoreview, MN, USA), as in our recent study (Ku and Kulkarni Citation2015). The morphologies tend to be different for these two generation techniques: pneumatic atomization gives a more compact structure as compared to dry dispersion technique, which gives more open structures with larger overall geometric size. Generation of aerosols from these two techniques, therefore, was expected to encompass a wide range of morphologies of workplace aerosols, although by no means absolutely bounded.
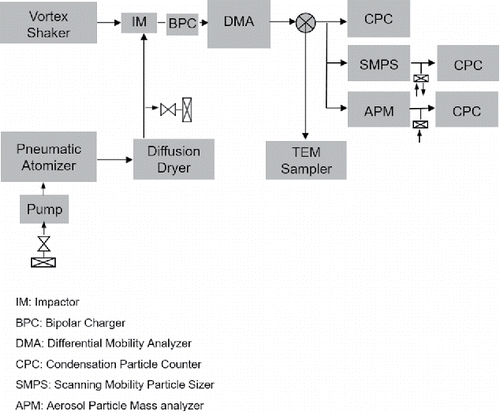
3.3. Experimental setup
Experimental setup as shown in was used to generate test aerosols of nanotube and nanofiber agglomerates. The details of the experimental setup has been described in detail elsewhere (Ku and Kulkarni Citation2015; Ku et al. Citation2006). The experimental setup was used to measure mass and mobility (using tandem DMA-aerosol particle mass analyzer [APM] technique [Ku et al. Citation2006; McMurry et al. Citation2002]) of test aerosol and then compare these measurements with those obtained from microscopy approach described in Section 2. Briefly, CNTs and CNFs aerosols were produced using either the dry dispersion or liquid atomization method and then size distributions of generated polydisperse aerosols were measured by a scanning mobility particle sizer (SMPS, Model 3936, TSI Inc.). Aerosol flow rates to the SMPS were adjusted in the range of 0.3–1.0 lpm and sheath flow rates were in the range of 3.0 to 10 lpm to obtain desired particle size range. A differential mobility analyzer (DMA) was used to obtain near-monodisperse mobility diameter particles in the range from 100 nm up to 800 nm. The DMA-classified aerosol was also collected electrostatically on a TEM grid. The impactor-based electrostatic precipitator used is described by Ku and Maynard (Citation2005) and was designed to improve the collection efficiency of particles. Particle imaging and analysis was carried out using a TEM to obtain particle morphology and structure. CNT and CNF agglomerates were randomly selected and imaged to minimize bias. Magnifications were in the range from 34,000× to 110,000×, giving one to five particles per image. For each single-mobility particle sample, about ten fields of view were used to obtain image properties. The image processing of the particles was performed using ImageJ (ver. 1.46 r) software in the public domain (Rasband Citation2014) to obtain projected area, maximum projected length, and 2D radius of gyration of the particles.
Figure 2. Experimental setup for particle generation and measurement of particle mobility diameter and aerodynamic diameter.
3.4. Aerodynamic diameter from particle mass measurement
Aerodynamic diameters of mobility-classified particles were obtained from particle mass and mobility diameter measured using tandem mobility-mass approach, using the following relationship (Park et al. Citation2003):[14] where ρeff is effective density of the DMA-classified particles, mp is the mass of the DMA-classified particles, ρ0 is the standard reference density (1 g cm−3), dae aerodynamic diameter, and dm mobility diameter. DMA-classified CNT agglomerates were provided into an aerosol particle mass analyzer having two cylinders rotating at a fixed angular speed (APM, Model 3600, Kanomax, Inc., Andover, NJ, USA) to obtain an estimate of mean particle mass. The number concentration of particles downstream of the APM is measured (using a condensation particle counter [CPC]) with increasing voltage applied to the APM inner cylinder. Assuming singly charged particles, the peak APM voltage was determined and used to obtain mean particle mass estimates (Ehara et al. Citation1996; McMurry et al. Citation2002; Ku et al. Citation2006; Maynard et al. Citation2007). The aerodynamic diameters of mobility-classified particles were obtained from Equation (Equation14
[14] ) for all the materials tested in this study except for the Mitsui MWCNT material (MWCNT1), whose aerodynamic diameter was measured using an electrical low pressure impactor instead of the aerosol particle mass analyzer.
4. Results and discussion
4.1. Particle morphology and radius of gyration
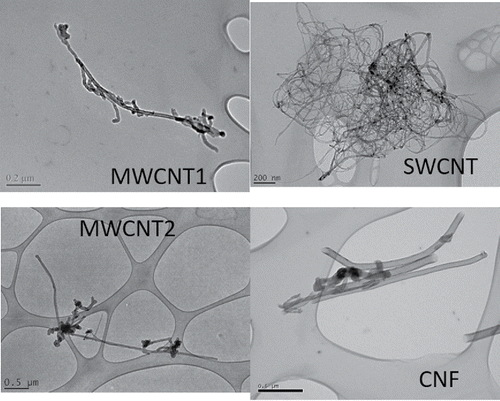
shows typical TEM images of airborne nanotubes and nanofibers particles used in this study. Two MWCNT material agglomerates and one CNF material agglomerates have fibrous structures, while SWCNT agglomerates have many nanoropes of entangled nanotubes and overall low aspect ratios. Figure S2 shows typical images and their binary images processed by ImageJ software for two different types of MWCNT agglomerates. It is worth noting that dry dispersed MWCNT agglomerates (Figure S2b) have open structures while pneumatically atomized MWCNT agglomerates (Figure S2c) of the same material have compact and somewhat agglomerated structure.
Figure 3. Typical images of airborne nanotube and nanofiber particles collected on TEM grids.
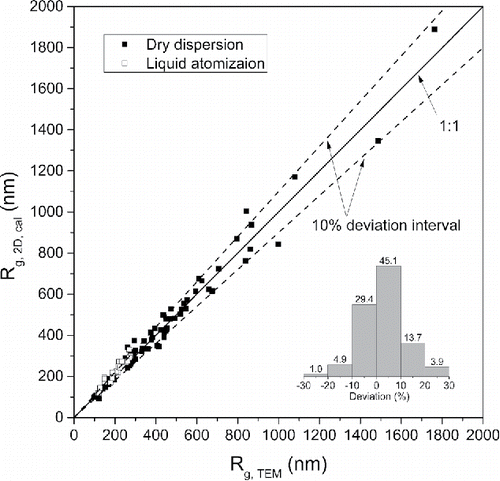
shows radius of gyration (Rg-TEM) obtained from TEM binary images using ImageJ software compared to that (Rg, 2D, cal) calculated based on a relationship for fractal agglomerates given by Koylu et al. (Citation1995), as shown in Equations (Equation6[6] )–(Equation8
[8] ) in the previous section. The two radii of gyration obtained from different approaches are in excellent agreement with each other; the correlation between these are R2 = 0.992 and the prediction of best fit line is within 2% of that from the one-to-one line (the slope of the fitting line is 1.011). The difference between the two radii of gyration is within 10–20% for most data, as shown in . These results indicate that the MWCNT agglomerates have radius of gyration similar to fractal agglomerates and that the parameterization developed for fractal agglomerates of spherical primary particles could be applied to MWCNT-like fibrous agglomerates. also shows that radius of gyration (Rg-TEM) obtained from TEM binary images of pneumatically atomized MWCNT agglomerates is smaller than that calculated based on the fractal parameterization (open symbols in ), which may be due to relatively higher fraction of overlapping of particles in the TEM image.
Figure 4. Comparison of radius of gyration obtained from TEM binary images of CNT and CNF particles with that calculated from fractal theory (Koylu et al. Citation1995; refer to text for assumptions made in the calculations). One-to-one line and 10% deviation line (arbitrarily-chosen) between two radii of gyration are included. The inset histogram shows % of total samples with % deviation from the TEM-based radius of gyration. Linear curve fit for all data (both dry dispersed and liquid atomized particles) gives excellent agreement with one-to-one line: Rg, 2D = 1.011Rg, TEM, R2 = 0.9916 (not shown).
4.2. Estimation of aerodynamic diameter and mobility diameter
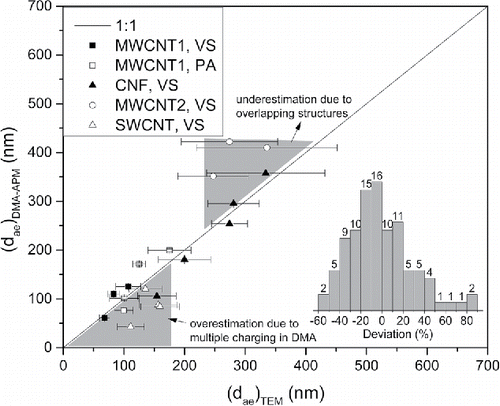
shows aerodynamic diameters obtained from TEM images for different types of nanotubes and nanofibers compared to measured values measured by a DMA-APM technique. The aerodynamic diameters estimated from TEM images for most agglomerates are in reasonable agreement with the measured values for most CNT and CNF agglomerates within 30–40%. Especially, the estimated aerodynamic diameters of MWCNT1 (VS) agglomerates are within 30% for the size range studied, as shown in . For particle sizes smaller than 200 nm aerodynamic diameter, the aerodynamic diameters of MWCNT1 (PA), CNF (VS), and SWCNT (VS) agglomerates tend to be overestimated while those of Mitsui MWCNT agglomerates are underestimated for particle sizes larger than 350 nm. The reason that the MWCNT1 (VS) agglomerates show better agreement in the whole size range than the other agglomerates may be due to their open and less overlapping structure, which is evidenced by TEM images shown in Figure S1b. also shows two distinct regions with experimental artifacts involving under- and overestimation of diameters. Overestimation of aerodynamic diameter is caused by multiple charging of the agglomerates during classification, while the underestimation of diameter is the result of excessive overlap of particle structures in the TEM image. It has been shown that the CNTs show greater propensity for multiple charging (Kulkarni et al. Citation2009).
Figure 5. Aerodynamic diameter calculated from TEM images for different types of nanotubes and nanofibers compared to direct measurements using a DMA-APM technique. Legend: VS: vortex shaking dry dispersion method; PA: pneumatic atomization method. One-to-one line is shown for comparison. The inset histogram shows percentage of total samples measured (on y-axis) that had a corresponding % deviation (on x-axis) from directly measured aerodynamic diameter using DMA-APM technique. For nanotube and nanofiber particles with relatively smaller aerodynamic diameters, a large fraction of multiply charged particles cause overestimation of the aerodynamic diameters. However, for particles with larger aerodynamic diameters, TEM image-based estimation gives underestimation of the diameters due to overlapping of the images.
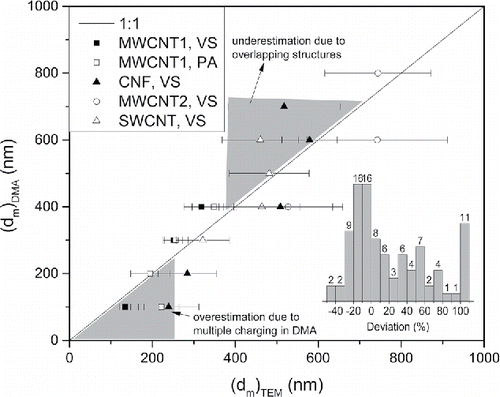
shows mobility diameter calculated from TEM images for different types of nanotubes and nanofibers compared to direct measurements using the DMA, assuming that the agglomerates follow a fractal relationship between mobility diameter and number of primary particles reported by Sorensen et al. (Citation2011). For MWCNT1 (VS) agglomerates the estimates from TEM images are within 60% for mobility diameters in the range of 100–400 nm, and within 40% for mobility diameter in the range of 200–400nm. For 100 and 200 nm mobility diameters, the diameters of MWCNT (PA) and CNF (VS) agglomerates are overestimated by up to 170% and 200%. Figure S3 shows mobility size distributions of DMA-classified CNF agglomerates with 200 nm mobility diameter. Compared to spherical particles (size standard polystyrene latex particles), it is evidenced that the CNF agglomerates have significant amount of multiple charge, i.e, double, triple, and even quadruple charge, which correspond to mobility diameters with single charge, 300, 414, and 496 nm, respectively. These larger multiply charged agglomerates may be collected on TEM grid as well with singly charged agglomerates, causing overestimation of the mobility diameter. However, it should be noted that the multiple charging is rather an experimental artifact of our measurement system, and not a limitation of the proposed approach. Compared to the deviation of the aerodynamic diameter, the deviation of the mobility diameter from the measured value is relatively large in the smaller particle size range. Based on the results of CitationFigures 5 and , the aerodynamic diameter is less sensitive to the uncertainty of estimation, probably due to it being less sensitive to multiple charging.
Figure 6. Mobility diameter calculated from TEM images for different types of nanotubes and nanofibers compared to direct measurements using a DMA. Legend: VS: vortex shaking dry dispersion method; PA: pneumatic atomization method. One-to-one line is shown for comparison. The inset histogram shows percentage of total samples measured (on y-axis) that had a corresponding % deviation (on x-axis) from the measured mobility diameter (using DMA-APM method). For carbon nanofiber particles with 100 and 200 nm in mobility diameter, a large fraction of multiply charged particles cause overestimation of the mobility diameters.
4.3. Limitations of this approach
The estimated diameters for most of the CNT and CNF agglomerates were found to agree with the measured values in the size ranging from 100 to 800 nm in mobility diameter (corresponding to 60–430 nm in aerodynamic diameter) within a range of −55% to 85%. For MWCNT1 (VS), the estimated aerodynamic diameter was within a range of −33% to 34% of measured reference value; whereas, the mobility diameter was within a range of −36% to 40%. The underestimation caused by overlapping particle structures is indeed the limitation of the proposed approach in this study. In addition, there are several other sources of uncertainties: variation in tube diameter across agglomerates, amount of nonfibrous components (such as catalyst particles) in the agglomerate structure, and accuracy of a priori estimation of particle material density. In this study, we measured tube diameter for each material and an average value was used for each material type. A wider distribution of tube diameters could affect the uncertainty of estimation of particle volume from TEM image, while presence of nonfibrous catalyst particles could lead to deviation of particle material density from that assumed in the calculation.
Knowledge of accurate particle material density is important for accurate estimation of aerodynamic diameter (however, not mobility diameter). We probed the extent of uncertainty caused by such variation in particle density for the particles studied in this work. We estimated the deviation of aerodynamic diameter with density variation, assuming that target particles (e.g., nanotubes) change their material density (typically, 2.0 g cm−3) by coagulation (through mainly diffusional transport) with background particles (e.g., from outdoor that are not fibrous) by 10%, 50%, and 100% (i.e., 2.2 g cm−3, 3.0 g cm−3, and 4.0 g cm−3). Figure S4 in the online SI shows mean error of estimated aerodynamic diameter as a function of error in particle density value. As the error in particle density increases (i.e., the difference in actual and assumed density), the error in aerodynamic diameter increases, because aerodynamic diameter increases with increasing particle density (see Figure S5 for deviation distributions of dae in the SI). When the assumed and actual particle density is same, the mean error in dae estimation is about 24.2%. As the error in density value increases up to 100%, the mean error in dae estimation increases by 33.5%. These calculations suggest that the estimation of aerodynamic diameter (using the proposed approach in this study) is less sensitive to variation in particle density, when the assumed density is different from the actual density by a factor of up to 2.
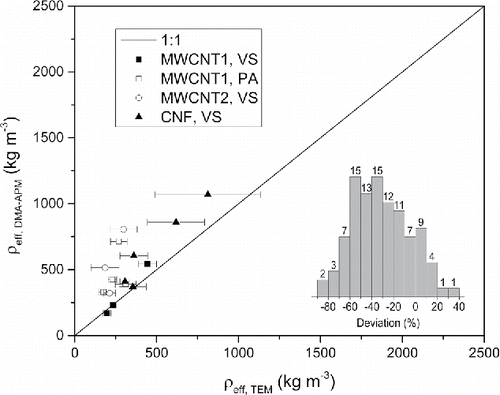
shows comparison of effective density, which is defined as particle mass divided by its volume based on mobility diameter, obtained using the proposed approach with that measured directly using tandem mobility-mass method. It was found that the estimated effective densities (using the proposed approach) were lower by up to 80% of the measured experimental values. This may be due to the fact that the particle mass was underestimated or mobility diameter was overestimated. It is worth noting that MWCNT1 (VS) agglomerates have the estimated effective density within 40% of the experimentally measured values.
Figure 7. Effective density, defined as mass divided by volume based on mobility diameter, calculated from TEM images for different types of nanotubes and nanofibers compared to direct measurements using an DMA-APM technique. The inset histogram shows % of total samples with % deviation from experimentally measured effective density. It is worth noting that for most of the particles studied in this work, the effective density was underestimated, probably due to overestimated mobility diameter.
4.4. Comparison of estimated aerodynamic diameters of fibrous aerosol agglomerates with those directly measured by impactors
The proposed approach for estimating diameters was extended to nanotube/nanofiber TEM morphologies of particles reported in the literature. Birch et al. (Citation2011) conducted exposure monitoring at a CNF production facility. They collected filter, cascade impactor, and microscopy samples and analyzed them to obtain particle mass, size, morphology, and chemistry. They used Sioutas personal cascade impactors (Cat. No. 225–370; SKC Inc., Eighty Four, PA, USA) to collect size-classified aerosol for TEM analysis. It classifies particles into five size ranges according to aerodynamic diameter: <0.25 µm (after filter), 0.25–0.50 µm (Stage D), 0.5–1.0 µm (Stage C), 1.0–2.5 µm (Stage B), and 2.5–10 µm (Stage A).
Chen et al. (Citation2012) collected filter, cascade impactor, and microscopy samples of airborne MWCNTs from an exposure chamber (used for inhalation studies). The cascade impactor Micro-orifice Uniform Deposit Impactors (MOUDI) were used to acquire size-classified samples for aerodynamic size distribution and particle morphology analysis. The MOUDI allowed the collection of size-classified samples of particles from 18 μm (cutoff diameter of the 1st stage) down to 10 nm (cutoff diameter of the 14th stage).
We used microscopy images reported by Birch et al. (Citation2011) and Chen et al. (Citation2012) to compute aerodynamic and mobility diameters using the estimation approach proposed in this study. For the Chen et al. data, MWCNT particles collected by the MOUDI Stages 6–9 (cut points are 1.0, 0.56, 0.32, and 0.18 µm on stages 6–9 for MOUDI, respectively) were used to evaluate the estimation of aerodynamic diameters. The aerodynamic diameter was also obtained using size distribution data measured in both these studies as the geometric mean diameter obtained as (di × di−1)0.5, where di is the 50% cut-off diameter on the ith stage of the corresponding impactor.
Figure S6 shows comparison of aerodynamic diameters obtained from impactor data (Chen et al.: stages 6–9 of the MOUDI; Birch et al.: stages C and D of the Sioutas impactors) to that using the proposed approach. Selected stages of MOUDI and Sioutas impactors were chosen depending on the availability (and suitability) of the TEM images of isolated agglomerates for corresponding stages. The difference between the calculated and measured aerodynamic diameters at each stage is about 91%, 47%, 1%, and 33%, respectively, for Chen et al. data; whereas, for the Birch et al.'s data, the difference between impactor and estimated aerodynamic diameters is about 8% and 32% for stages D and C, respectively. The comparison shown in Figure S6 would be more meaningful if the uncertainty of measured aerodynamic diameter is lower. Both the MOUDI and Sioutas impactors have very few number of impactor stages in the diameter range studied. Availability of high size resolution field data will allow probing applicability of the proposed approach to real-world particle morphologies. Nonetheless, comparison in Figure S6 suggests that the approach can provide approximate estimates.
5. Conclusions
On the basis of the fractal theory, an approach has been employed for approximate estimation of aerodynamic- and diffusion-equivalent (or mobility) diameters of CNT and CNF aerosols using their morphological information available from EM. The results show that most estimated aerodynamic diameters of the laboratory-generated test particles agreed with those from the direct measurements within 30–40%; while the estimated diffusion diameters agreed with the measured values within 40–50% in the size range of 100–800 nm. The uncertainty of these estimates depends on several factors including: (i) the degree of overlapping features in the particle structures, (ii) hidden internal volume, (iii) distribution of tube diameter, and (iv) a priori knowledge of particle density. Application of the proposed approach to actual workplace CNT/CNF aerosol from published studies (Birch et al. Citation2011; Chen et al. Citation2012) showed that estimates within 91% of the measured values can be obtained for agglomerates in the submicrometer size range. Recent studies (Birch et al. Citation2017) have shown that EM images of CNT particles from actual workplace samples are typically agglomerates larger than 1 µm (compared to the submicron particles studied in this work). It is likely that the uncertainty of diameter estimates may increase for such large agglomerates due to increased overlapping and/or structures. Judicious use of the approach can yield approximate but useful results.
Nomenclature
| a | = | primary particle radius in a fractal agglomerate |
| C | = | Cunningham slip correction factor |
| dae | = | aerodynamic diameter |
| dae,corr | = | aerodynamic diameter with correction of particle shape factor |
| Df | = | fractal dimension |
| di | = | 50% cut-off diameter on the ith stage of an impactor |
| Dm | = | mass-mobility scaling exponent |
| dm | = | mobility diameter |
| dproj | = | projected area diameter |
| k0 | = | scaling prefactor (or structural coefficient) |
| Kn | = | Knudsen number ( = molecular mean free path/agglomerate equivalent radius) |
| Kng | = | Knudsen number based on radius of gyration from TEM image |
| Knm | = | Knudsen number based on mobility radius |
| Knproj | = | Knudsen number based on projected area equivalent radius |
| Knve | = | Knudsen number based on volume equivalent radius |
| Lm | = | maximum projected length |
| m | = | primary particle mass |
| mp | = | agglomerate mass |
| Np | = | number of primary particles in an agglomerate |
| Npx | = | number of pixels in the image |
| = | location of a center of mass on the image | |
| = | location of the center of the kth pixel in an image | |
| Rg | = | radius of gyration |
| Rg,TEM | = | TEM image-based (2D) radius of gyration |
| ri | = | distance of the ith primary particles from the center of mass of the agglomerate |
| Rm | = | mobility radius |
| Rproj | = | projected area radius |
| Rve | = | volume equivalent radius |
| Rg,2D | = | two-dimensional (2D) radius of gyration |
| Rg,3D | = | three-dimensional (3D) radius of gyration |
Greek symbols
| χ | = | dynamic shape factor |
| ρ0 | = | standard density ( = 1 g cm−3) |
| ρp | = | material density |
| ρeff | = | effective density defined as particle mass divided by volume based on mobility diameter |
Disclaimer
The mention of any company or product does not constitute an endorsement by the Centers for Disease Control and Prevention. The findings and conclusions in this article are those of the authors and do not necessarily represent the views of the National Institute for Occupational Safety and Health.
UAST_1441974_Supplementary_File.zip
Download Zip (2.3 MB)Acknowledgments
The authors would like to thank Chen Wang and Lina Zheng for their helpful comments on this work and thank Joe Fernback for taking some TEM images.
Additional information
Funding
Related Research Data
References
- Baron, P. A., Deye, G. J., Chen, B. T., Schwegler-Berry, D. E., Shvedova, A. A., and Castranova, V. (2008). Aerosolization of Single-Walled Carbon Nanotubes for an Inhalation Study. Inhal. Toxicol., 20:751–760. doi:10.1080/08958370801975303.
- Baron, P., Sorensen, C. M., and Brockman, J. (2001). Nonspherical Particle Measurements: Shape Factors, Fractals and Fibers, in Aerosol Measurement, P. Baron and K. Willeke eds., Wiley-Interscience, New York.
- Birch, M. E., Ku, B. K., Evans, D. E., and Ruda-Eberenz, T. A. (2011). Exposure and Emissions Monitoring during Carbon Nanofiber Production-Part I: Elemental Carbon and Iron-Soot Aerosols. Ann. Occup. Hyg., 55:1016–1036.
- Birch, M. E., Wang, C., Fernback, J. E., Feng, H. A., Birch, Q. T., and Alan, K. Dozier (2017). Analysis of Carbon Nanotubes and Nanofibers on Mixed Cellulose Ester Filters by Transmission Electron Microscopy. NIOSH Manual of Analytical Methods (NMAM), 5th Edition: https://www.cdc.gov/niosh/nmam/pdf/chapter-cn.pdf.
- Brasil, A. M., Farias, T. L., and Carvalho, M. G. (1999). A Recipe for Image Characterization of Fractal-like Agglomerates. J. Aerosol Sci., 30:1379–1389. doi:10.1016/S0021-8502(99)00026-9.
- Cai, J., Lu, N., and Sorensen, C. M. (1995). Analysis of Fractal Cluster Morphology Parameters: Structural Coefficient and Density Autocorrelation Function Cutoff. J. Coll. Int. Sci., 171:470–474.
- Chen, B. T., Schwegler-Berry, D., McKinney, W., Stone, S., Cumpston, J. L., Friend, S., Porter, D. W., Castranova, V., and Frazer, D. G. (2012). Multi-Walled Carbon Nanotubes: Sampling Criteria and Aerosol Characterization. Inhal. Toxicol., 24(12):798–820. doi:10.3109/08958378.2012.720741.
- Donaldson, K., Murphy, F. A., Duffin, R., and Poland, C. A. (2010). Asbestos, Carbon Nanotubes and the Pleural Mesothelium: A Review of the Hypothesis Regarding the Role of Long Fibre Retention in the Parietal Pleura, Inflammation and Mesothelioma. Particle Fibre Toxicol., 7:5. doi:10.1186/1743-8977-7-5.
- Ehara, K., Hagwood, C., and Coakley, K. J. (1996). Novel Method to Classify Aerosol Particles According to Their Mass-to-Charge Ratio-Aerosol Particle Mass Analyzer. J. Aerosol Sci., 27:217–234. doi:10.1016/0021-8502(95)00562-5.
- Evans, D. E., Ku, B. K., Birch, M. E., and Dunn, K. H. (2010). Aerosol Monitoring during Carbon Nanofiber Production: Mobile Direct-Reading Sampling. Ann. Occup. Hyg., 52:9–21. doi:10.1093/annhyg/mem056.
- Friedlander, S. K. (2000). Smoke, Dust and Haze. Fundamentals of Aerosol Dynamics. Oxford University Press, New York.
- Heitbrink, W. A., Evans, D. E., Ku, B. K., Maynard, A. D., Slavin, T. J., and Peters, T. M. (2009). Relationships among Particle Number, Surface Area, and Respirable Mass Concentrations in Automotive Engine Manufacturing. J. Occup. Environ. Hyg., 6:19–31. doi:10.1080/15459620802530096.
- Jullien, R. and Botet, R. (1987). Aggregation and Fractal Aggregates. World Scientific, Singapore.
- Kisin, E. R., Murray, A. R., Sargent, L., Lowry, D., Chirila, M., Siegrist, K. J., Schwegler-Berry, D., Leonard, S., Castranova, V., Fadeel, B., Kagan, V. E., and Shvedova, A. A. (2011). Genotoxicity of Carbon Nanofibers: Are they Potentially More or Less Dangerous than Carbon Nanotubes or Asbestos? Toxicol. Appl. Pharm., 252:1–10. doi:10.1016/j.taap.2011.02.001.
- Koylu, U. O., Faeth, G. M., Farias, T. L., and Carvalho, M. G. (1995). Fractal and Projected Structure Properties of Soot Aggregates. Combust. Flame, 100:621–633. doi:10.1016/0010-2180(94)00147-K.
- Ku, B. K. and Maynard, A. D. (2005). Comparing Aerosol Surface-Area Measurements of Monodisperse Ultrafine Silver Agglomerates by Mobility Analysis, Transmission Electron Microscopy and Diffusion Charging. J. Aerosol Sci., 36:1108–1124. doi:10.1016/j.jaerosci.2004.12.003.
- Ku, B. K. and Kulkarni, P. (2015). Measurement of Transport Properties of Aerosolized Nanomaterials. J. Aerosol Sci., 90:169–181. doi:10.1016/j.jaerosci.2015.09.001.
- Ku, B. K., Deye, G., and Turkevich, L. A. (2013). Characterization of a Vortex Shaking Method for Aerosolizing Fibers. Aerosol Sci. Technol., 47:1293–1301. doi:10.1080/02786826.2013.836588.
- Ku, B. K., Emery, M. S., Maynard, A. D., Stolzenburg, M. R., and McMurry, P. H. (2006). In Situ Structure Characterization of Airborne Carbon Nanofibres by a Tandem Mobility-Mass Analysis. Nanotechnology, 17:3613–3621. doi:10.1088/0957-4484/17/14/042.
- Ku, B. K. and Kulkarni, P. (2012). Measurement of Transport Properties of Aerosolized Nanomaterials. 2012 AAAR Conference, Minneapolis, MN, p. 343, October 8–12.
- Ku, B. K. and Kulkarni, P. (2013). Physical and Transport Properties of Aerosolized Nanomaterials: Their Relation to Morphological Descriptor. The 6th International Symposium on Nanotechnology, Occupational and Environmental Health (NanOEH) Conference, Nagoya, Japan, p. 32, October 28–31.
- Kulkarni, P., Baron, P. A., Sorensen, C. M., and Harper, M. (2011). Nonspherical Particle Measurement: Shape Factor, Fractals and Fibers, in Aerosol Measurement, P. Kulkarni, P. Baron and K. Willeke eds., Wiley-Interscience, New York.
- Kulkarni, P., Deye, G. J., Baron, P. A. (2009). Bipolar Diffusion Charging Characteristics of Single-Wall Carbon Nanotube Aerosol Particles. J. Aerosol Sci., 40:164–179. doi:10.1016/j.jaerosci.2008.09.008.
- Lam, C. W., James, J. T., McCluskey, R., and Hunter, R. L. (2004). Pulmonary Toxicity of Single-Wall Carbon Nanotubes in Mice 7 and 90 Days after Intratracheal Instillation. Toxicol. Sci., 77:126–134. doi:10.1093/toxsci/kfg243.
- Maynard, A. D., Baron, P. A., Foley, M., Shvedova, A. A., Kisin, E. R., and Castranova, V. (2004). Exposure to Carbon Nanotube Material: Aerosol Release During the Handling of Unrefined Single-Walled Carbon Nanotube Material. J. Toxicol. Environ. Health A, 67:87–107. doi:10.1080/15287390490253688.
- Maynard, A. D., Ku, B. K., Emery, M., Stolzenburg, M., and McMurry, P. H. (2007). Measuring Particle Size-Dependent Physicochemical Structure in Airborne Single Walled Carbon Nanotube Agglomerates. J. Nanopart. Res., 9:85–92. doi:10.1007/s11051-006-9178-2.
- McMurry, P. H., Wang, X., Park, K., and Ehara, K. (2002). The Relationship between Mass and Mobility for Atmospheric Particles: A New Technique for Measuring Particle Density. Aerosol Sci. Technol., 36:227–238. doi:10.1080/027868202753504083.
- Meakin, P. and Fractal Aggregates. (1988). Adv. Coll. & Interface Sci., 28:249–331. doi:10.1016/0001-8686(87)80016-7.
- NIOSH. (2009). Approaches to Safe Nanotechnology: Managing the Health and Safety Concerns Associated with Engineered Nanomaterials [DHHS (NIOSH) Publication No. 2009-125]. http://www.cdc.gov/niosh/docs/2009-125/pdfs/2009-125.pdf.
- NIOSH. (2013). Occupational Exposure to Carbon Nanotubes and Nanofibers: Current Intelligence Bulletin 65 [DHHS (NIOSH) Publication No. 2013–145].http://www.cdc.gov/niosh/docs/2013–145/pdfs/2013–145.pdf.
- Park, K, Cao, F, Kittelson, D. B., and McMurry, P. H. (2003). Relationship between Particle Mass and Mobility for Diesel Exhaust Particles. Environ. Sci. Technol., 37:577–583. doi:10.1021/es025960v.
- Poland, C. A., Duffin, R., Kinloch, I., Maynard, A., Wallace, W. A., Seaton, A., Stone, V., Brown, S., Macnee, W., and Donaldson, K. (2008). Carbon Nanotubes Introduced into the Abdominal Cavity of Mice Show Asbestos-Like Pathogenicity in a Pilot Study. Nat. Nanotechnol., 3:423–428. doi:10.1038/nnano.2008.111.
- Rasband, W. S. (2014). Image J, U. S. National Institutes of Health, Bethesda, Maryland, USA, pp. 1997–2014. http://imagej.nih.gov/ij/.
- Rogak, S. N., Flagan, R. C., and Nguyen, H. V. (1993). The Mobility and Structure of Aerosol Agglomerates. Aerosol Sci. Technol., 18:25–47. doi:10.1080/02786829308959582.
- Sargent, L. M., Porter, D. W., Staska, L. M., Hubbs, A. F., Lowry, D. T., Battelli, L., Siegrist, K. J., Kashon, M. L., Mercer, R. R., Bauer, A. K., Chen, B. T., Salisbury, J. L., Frazer, D., McKinney, W., Andrew, M., Tsuruoka, S., Endo, M., Fluharty, K. L., Castranova, V., and Reynolds, S. H. (2014). Promotion of Lung Adenocarcinoma Following Inhalation Exposure to Multi-Walled Carbon Nanotubes. Particle Fibre Toxicol., 11:3. doi:10.1186/1743-8977-11-3.
- Shvedova, A. A., Kisin, E. R., Mercer, R., Murray, A. R., Johnson, V. J., Potapovich, A. I., Tyurina, Y. Y., Gorelik, O., Arepalli, S., Schwegler-Berry, D., Hubbs, A. F., Antonini, J., Evans, D. E., Ku, B. K., Ramsey, D., Maynard, A., Kagan, V. E., Castranova, V., and Baron, P. (2005). Unusual Inflammatory and Fibrogenic Pulmonary Responses to Single-Walled Carbon Nanotubes in Mice. Am. J. Physiol.-Lung C., 289:L698–L708. doi:10.1152/ajplung.00084.2005.
- Sorensen, C. M. (2011). The Mobility of Fractal Aggregates: A Review. Aerosol Sci. Tech., 45:765–779. doi:10.1080/02786826.2011.560909.
- Sorensen, C. M. and Roberts, G. C. (1997). The Prefactor of Fractal Aggregates. J. Coll. Interface Sci., 186:447–452. doi:10.1006/jcis.1996.4664.
- Takagi, A., Hirose, A., Nishimura, T., Fukumori, N., Ogata, A., Ohashi, N., Kitajima, S., and Kanno, J. (2008). Induction of Mesothelioma in p53+/- Mouse by Intraperitoneal Application of Multi-Wall Carbon Nanotube. J. Toxicol. Sci., 33:105–116. doi:10.2131/jts.33.105.
- Vicsek, T. (1992). Fractal Growth Phenomena, 2nd Ed. World Scientific, Singapore.
- Wang, J., Bahk, Y. K., Chen, S. C., and Pui, D. Y. H. (2015). Characteristics of Airborne Fractal-Like Agglomerates of Carbon Nanotubes. Carbon, 93:441–450. doi:10.1016/j.carbon.2015.05.079.