
Abstract
The objective of this study is to investigate the particle effective density of aerosol measurements in a railway tunnel environment. Effective density can serve as a parameter when comparing and calibrating different aerosol measurements. It can also be used as a proxy parameter reflecting the source of particles. Effective density was determined using two different methods. Method one defined it by the ratio of mass concentration to apparent volume size distribution. Method two relied on a comparison of aerodynamic and mobility diameter size distribution measurements. The aerodynamic size range for method one was 0.006–10 µm, and for method two, it was 10–660 nm. Using the first method, a diurnal average value of about 1.87 g/cm3 was observed for the measurements with tapered element oscillating microbalance (TEOM) in tandem with aerodynamic particle sizer + scanning mobility particle sizer (SMPS), and 1.2 g/cm3 for the combination of TEOM with electrical low pressure impactor plus (ELPI+) in the presence of traffic. With method two, the effective density was 1.45 g/cm3 estimated from the size distribution measurements with ELPI + and fast mobility particle sizer (FMPS), and 1.35 g/cm3 from ELPI + in tandem with SMPS. With both calculation methods, the effective density varied for conditions with and without traffic, indicating different sources of particles. The proportion of particles with small sizes (10–660 nm) had a significant effect on the value of the effective density when no traffic was operating. The responses of different instruments to the railway particle measurements were also compared.
Copyright © 2018 The Authors. Published with license by Taylor & Francis Group, LLC
EDITOR:
1. Introduction
As underground railways are one of the major public transportation choices for an increasing number of people in most metropolitan areas worldwide, air quality in underground tunnels is of great concern. Particulate matter (PM) is one of the main factors influencing indoor air quality in tunnel environments. Railway stations in tunnels have been reported to have higher particle concentrations than those above ground (Kam et al. Citation2011; Cartenì et al. Citation2015; Cha et al. Citation2018a). The railway particles are commonly characterized as containing metal elements (e.g., iron, copper, manganese, zinc, and chromium) in a wide size range. Potential detrimental health effects have been investigated for long-term exposure to railway particles (Karlsson et al. Citation2008; Klepczyńska Nyström et al. Citation2010). Characterization of their effective density is required to properly evaluate the effects of railway particles on human health, as well as their concentration, size distribution, chemical composition, and morphology.
The effective density, also called apparent density, is a quantity that reflects the physiochemical properties of particles (e.g., their bulk density, chemical composition, particle shape factor, and porosity). Various definitions of effective density can be found in the literature, resulting in different values for a given particle or a given population of particles (DeCarlo et al. Citation2004). One commonly used definition is the ratio of mass to apparent volume of the particle, assuming a spherical particle. In this case, the effective density of particles is related to their interaction with the surrounding environment and their deposition in the human respiratory tract (Ristimäki et al. Citation2002). Alternatively, the effective density can be estimated by comparing the size distribution of aerodynamic and mobility diameters. Aerodynamic diameter is defined as the diameter of a spherical particle of unit density (1 g/cm3) having the same settling velocity as the actual particle. Mobility equivalent diameter
is defined as the diameter of a spherical particle having the same electrical mobility and the same bulk density as the irregular particle in question (Kumar et al. Citation2010). The effective density links these two types of diameters in the second definition. For most commercial aerosol instruments, the reported mass concentrations are converted from the measured number concentrations using effective density. Usually, a unit density is assumed for simplicity either for the conversion between the particle number and mass concentration or for the estimation of particle deposition in the respiratory system (Leskinen et al. Citation2014; Rissler et al. Citation2014). These assumptions may lead to incorrect conclusions.
In addition to studies of specific particles with given compositions and material densities (Virtanen et al. Citation2004; Zelenyuk et al. Citation2006), effective density has also been used to characterize different types of aerosol particles with heterogeneous components. For example, wood combustion particles were characterized using APS-SMPS (aerosol particle mass analyzer and a scanning mobility particle sizer) (Leskinen et al. Citation2014); diesel exhaust was studied with ELPI-SMPS (electrical low pressure impactor and SMPS) (Virtanen et al. Citation2002), and with DMA-CPMA (differential mobility analyzer and centrifugal particle mass analyzer) in terms of the size resolved effective density (Olfert et al. Citation2007; Quiros et al. Citation2015); wear particles generated from car brake materials were investigated with ELPI-FMPS (ELPI and fast mobility particle sizer) (Nosko and Olofsson Citation2017). Ambient air particles have been measured with DMPS-MOUDI (differential mobility particle sizer and micro-orifice uniform deposit impactor) (Hu et al. Citation2012) using DMA-APM (DMA and aerosol particle mass analyzer) (Rissler et al. Citation2014), and with DMA-UFATOFMS (DMA with ultrafine aerosol time-of-flight mass spectrometer) (Spencer et al. Citation2007). These studies using different methods reported different values for different aerosols, but the common factor is that the effective density was related to particle origin and morphology.
In a railway tunnel environment, aerosols are a complex mixture of particles from the outdoors, mechanical wear particles from train components (e.g., wheel-rail, wheel-brake, and pantograph catenary or third-rail systems), re-suspension dust, and passenger-induced particles. Thus, the properties of railway particles can be different from those of other types of aerosols. To date, there is no published data on the effective density of the aerosols in a railway tunnel. When such information is required for the evaluation of mass concentration, it is assumed or simply estimated to be 4–5 g/cm3 (Fridell et al. Citation2010; Cha et al. Citation2018a). When investigating deposition of subway particles in the human respiratory tract, a density of 2–3 g/cm3 was used based on an estimation of the chemical composition of the aerosols (Martins et al. Citation2015). In this study, the effective density of the particles measured in a railway tunnel was evaluated using two different methods. Method one is defined by the ratio of mass concentration to apparent volume size distribution; and method two is based on the comparison of aerodynamic and mobility diameter size distribution measurements.
2. Methodology
2.1. Algorithm for the estimation of effective density
2.1.1. Approach 1, using mass and number concentration measurements
A common definition of the effective density of a single particle is the ratio of the particle mass and apparent volume, assuming a spherical particle (Pitz et al. Citation2003; DeCarlo et al. Citation2004). Instead of measuring single particles, we measured particle populations with simultaneous measurements of mass concentration and number concentration, as other authors have done (Pitz et al. Citation2003; Nosko and Olofsson Citation2017). We calculate the effective density as the ratio between the particle mass concentration and the apparent volume concentration calculated from the number concentrations, assuming the particles to be spherically shaped, using the following equation:
(1)
where m is the mass concentration measured with a TEOM;
is the midpoint size (aerodynamic diameter in this study) of stage i of the instruments (an ELPI and an APS in tandem with a SMPS), and ni is the number concentration at that stage. The expression of the numerator (
) is particle apparent volume concentration (Pitz et al. Citation2003). Only PM10 values from TEOM are available for this study. Hence, the effective density calculated here is an average value for particle sizes up to 10 µm.
2.1.2. Approach 2, using mobility and aerodynamic distribution measurements
An alternative estimate of effective density can be performed by taking simultaneous measurements with mobility and aerodynamic instruments. The theory is described in DeCarlo et al. (Citation2004). The connection between effective density , mobility equivalent diameter
, and aerodynamic diameter
is shown in the following equation (Kelly and McMurry Citation1992)
(2)
where Cc is the slip correction factor of the corresponding particle size, and
is the unit density. The effective density
is affected by the particulate shape factor
and the bulk density
(Ristimäki et al. Citation2002).
Effective density can be obtained from EquationEquation (2)(2) either by simultaneously measuring the vacuum aerodynamic and mobility diameters of the target particles (Dinar et al. Citation2006; Spencer et al. Citation2007) or by simultaneous measurements of the mobility and aerodynamic size distributions (Ristimäki et al. Citation2002; Virtanen et al. Citation2004; Nosko and Olofsson Citation2017). In the current study, the aerosol in question was measured by combining number concentrations obtained from mobility instruments (FMPS and SMPS) and an aerodynamic instrument (ELPI+). The method used to determine the effective density here is the same as that used by Ristimäki et al. (Citation2002), Virtanen et al. (Citation2004), and Nosko and Olofsson (Citation2017). In the calculation introduced by those authors, the effective density can be obtained by fitting the mobility size distribution to the aerodynamic size distribution. Specifically, the ELPI + measures real-time number concentration and aerodynamic size distribution. The particles are first charged in a corona charger, with charge depending on the mobility diameter of the particles. The charged particles are then classified according to aerodynamic diameter into 14 impactor stages (n = 14). The electrical current
(
= 1, 2…, 14) carried by the charged particles at each stage can be measured by a multi-channel electrometer. Meanwhile, the number of mobility size distributions
are measured using mobility instruments, an FMPS and an SMPS. With the help of kernel functions, the simulated electrical current
can be calculated from the measured mobility size distribution
, as outlined in the calculation procedure given below.
First, by multiplying with the charger efficiency function of ELPI+, the current distribution can be calculated as a response function of the number size distribution
using EquationEquation (3)
(3) . It is assumed that the ELPI + charger efficiency function
is also a function of the mobility diameter
and can be expressed as
(Virtanen et al. Citation2004).
(3)
The calculated current distribution function is then passed through ELPI + impactor kernel functions to simulate the particle collection in the impactor (Ristimäki et al. Citation2002). The simulated electrical current at each stage can be obtained from a set of integral equations in the interval (minimum
, maximum
) with the help of the kernel functions, as in the equations given below:
(4)
where
are the kernel functions, which are functions of particle size and effective density and can be calculated from the collection efficiency functions using the following equations (Marjamäki et al. Citation2005):
(5)
The collection efficiency functions for each stage depend on the aerodynamic particle size (Marjamäki et al. Citation2005). Therefore, the aerodynamic particle size needs to be converted to the mobility equivalent size using EquationEquation (2)
(2) .
The last step in the method is to minimize the error ε between the simulated calculated from EquationEquation (4)
(4) , and the directly measured currents
in the ELPI + for each stage. By varying the
value, the error ε can be minimized. The density yielding the minimum error ε is accepted as the effective density of the studied particles, in other words,
. With this approach, the effective density is an average value for the particle sizes in the interval of (minimum
, maximum
), with the assumption of steady sources for the particles being studied. This means that the effective density obtained with this approach covers the particle sizes depending on the measurement range of FMPS for the ELPI – FMPS method, or SMPS for the ELPI – SMPS measurement. Methods that are commonly used for the fitting here include a cost function and least squares approach (Ristimäki et al. Citation2002; Nosko and Olofsson Citation2017). In this study, a least squares approach was used to calculate the error ε:
(6)
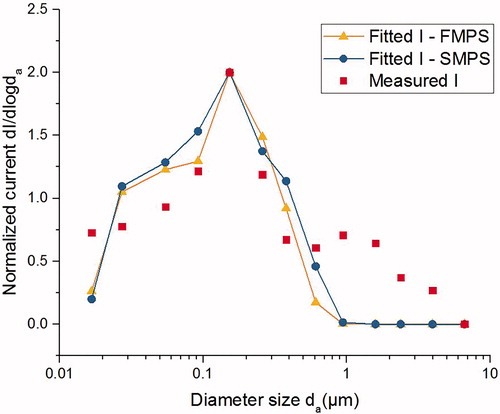
presents an example of the result as a function of varying the density by fitting FMPS with ELPI+. It can be seen that the calculation converges with only one minimum error value. The resulting simulated current from the measurements with FMPS and SMPS is compared to the current measured directly with the ELPI in . Since the simulated current is a function of the mobility diameter measured with the FMPS or SMPS, the data for the sizes larger than the detection upper limits of those instruments are approximately zeros. It should be noted that normalized responses were used in the fitting procedure in in order to exclude the effect of experimental errors between the instruments mainly due to differences in the flow rates (Ristimäki et al. Citation2002).
Figure 1. Deviation error as a function of density
.
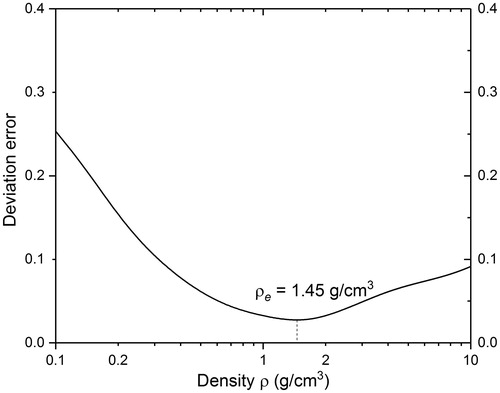
Figure 2. Measured ELPI current (red rectangles) compared to the current response from FMPS (yellow line with triangles) and SMPS (blue line with circles); the biggest peak is at around 0.2 µm.
2.2. Field measurements
2.2.1. Measurement instruments
2.2.1.1. Particle mass concentration
A tapered element oscillating microbalance (TEOM from Thermo Fischer Inc., Waltham, MA, USA) equipped with a PM10 inlet was used to determine PM10 level (mass concentration of particles of 10 µm aerodynamic diameter and less) every 1 min. The sample flow rate was set to 3 L/min. The TEOM is a gravimetric-based method of directly measuring particle mass concentration. It was equipped with a filter dynamics measurement system (FDMS) to reduce mass loss if the particles are composed of volatile components. According to the manufacturer, the minimum detection limit is 5 µg/m3. For PM10 measurement, the TEOM has been approved by the United States Environmental Protection Agency (USEPA) with an accuracy of 10% (Cowen et al. Citation2001; Alberta Environment Citation2009). According to a Swedish standard on measuring systems (Svensk standar Citation2014), the TEOM is reliable that different pieces of TEOM gives stable performance with only a few percent deviation between each other.
2.2.1.2. Particulate number size distributions
Particle number size distribution was measured using aerodynamic and mobility instruments. The aerodynamic measurement was done with an electrical low pressure impactor (Dekati ELPI+) and an aerodynamic particle sizer (TSI APS 3321). Simultaneously, mobility measurements were performed with a fast mobility particle sizer spectrometer (TSI FMPS 3091) and a scanning mobility particle sizer (TSI SMPS 3080, combining an electrostatic classifier with a condensation particle counter CPC).
The ELPI + measures real-time number concentration and size distribution for particles between 6 nm and 10 µm in aerodynamic diameter. Thus, in the tandem measurement with TEOM, the effective density can be estimated for the size range of 6 nm–10 µm. The measured particles are first charged in a corona charger, with charging depending on the mobility diameter of the particles. The charged particles are then classified according to the aerodynamic diameter into 14 impactor stages, and then are collected on those stages for chemical analysis. The electrical current carried by the charged particles at each stage can be measured by a multi-channel electrometer. Finally, particle number concentration and size distribution are calculated from the measured current. In order to prevent particle bounce and blow-off, all filter substrates were coated with DS-515 grease spray before impactor measurements. The sampling flow rate was set to 10 L/min with a time resolution of 1 min. Unlike the ELPI+, the APS counts single particles and classifies their sizes based on the time-of-flight for transport between two laser beams. Due to inertia, particles with small aerodynamic diameters accelerate faster than larger particles and thus have shorter time-of-flight. The APS enables the measurement of particles in a wide aerodynamic diameter size range of between 0.523 and 14.86 µm in up to 48 channels. The combination of APS with a mobility instrument is commonly used to also cover ultrafine particles below 0.5 µm, for example using APS + TDMPS (Pitz et al. Citation2008; Hu et al. Citation2012), or APS + SMPS (Khlystov et al. Citation2004). In our study, the APS was used in combination with an SMPS to cover particle sizes of 0.015–9.65 µm.
The FMPS measures particles with a mobility diameter size between 6 nm and 523 nm in 32 size channels, while the SMPS measures particles of mobility diameter size between 10 nm and 660 nm with a higher size resolution up to 107 size channels. With the SMPS, particles are first classified and separated according to their mobility in an electric field produced by the electrostatic classifier and then passed to the CPC to measure particle number concentration. The electrical mobility size depends on the particle cross-section, which for a spherical particle is the same as the physical size. A single size distribution was recorded every 2.5 min. The sample flow rate was 0.3 L/min. Like the SMPS, the FMPS spectrometer classifies particle size based on differential electrical mobility. The charged particles enter the analyzer column and are deflected radially outward and collected on electrically isolated electrodes. The particle number concentration is then determined by the measurement of electrical current collected on the electrodes. The FMPS is a fast-response instrument of the SMPS. It enables the measurement of a single size distribution with one-second resolution.
2.2.2. Measurement site and campaign
The stationary measurements were carried out at the Arlanda Central (Arlanda C) station as part of a measurement campaign supported by the Swedish Transport Administration. Arlanda C is a railway station completed in 1999 and located directly below Arlanda Airport in Stockholm, Sweden. The platform () on which the test apparatus was mounted lies inside a wide tunnel with an approximate length of 5000 m. The test instruments were placed at the end of the platform in order to have less influence from passengers. The tunnel ceiling is about 7.5 m above the platform level. The platform is approximately 354 m in length and 11 m in width, and is 0.5–1 m above the track level. It separates the two rail tracks on which southbound and northbound trains operate everyday. The traffic passing through this tunnel is a mix of different types of electric trains. They are all powered by electrical pantograph-catenary systems. The brake systems used by most of those trains are disc brakes combined with electric braking. Normally disc brakes are the main braking system at speeds of 30 km/h and slower. Note that there are still type of locomotive train sets that do not use electric braking but instead combine disc brakes and block brakes. The main brakes on the locomotives are disc brakes, but block brakes can also be used for drag braking, in which a small constant load is applied to clean and roughen the wheels during periods of low-adhesion or to control the train speed when going downhill. There were no mechanical ventilation and equalization shafts on the platform at Arlanda C station. More details on the measurement site can be found in Cha et al. (Citation2018b) and Gustafsson et al. (Citation2016, Citation2017).
Figure 3. A diagram of the Arlanda C platform showing the placement of the measurement instruments.
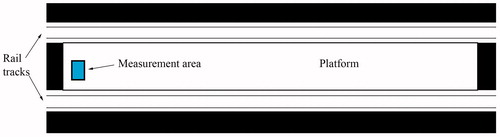
For the purpose of determination of effective density, an intensive stationary measurement was carried out firstly with different types of instruments covering aerodynamic, mobility, and gravimetrical measurements, over 24 h (from 20:00 on 31 January 2013 to 08:00 on 1 February 2013), at the Arlanda C station. Aerodynamic measurements were taken with an ELPI + and an APS and mobility measurements with an FMPS and an SMPS, while PM10 was determined with a TEOM, as detailed above. All of those instruments were placed in the measurement area in with the protection of guard fence. Separate inlets were used for every single device, but all of those inlets were placed at the same altitude with a height of about 1.5 m away from the platform floor. Additionally, in order to investigate the daily variation of the effective density, the APS, SMPS, and TEOM measurements were continued from 1 February 2013 until 11 February 2013. During the whole measurement campaign, the TEOM, ELPI+, and FMPS data were recorded every 1 min, and the time resolution of the APS was 20 s the SMPS was 2.5 min.
2.3. Data quality and uncertainty
Errors may arise from various sources of uncertainty. There were three types of uncertainties in this study: Uncertainty 1 relates to the efficiency of the instruments used to generate the data. Uncertainty 2 is associated with the measurement conditions (e.g., humidity, temperature, pressure, and aerosol type monitored). Uncertainty 3 is produced in the calculation due to simplifying assumptions; for example, the aerosol source was assumed to be steady for each case and thus the effective density was calculated as an average value independent of particle diameter size. In addition, the use of aerodynamic diameter in the calculation in EquationEquation (1)(1) may result in underestimates of the effective density due to larger sizes of aerodynamic diameter than real particles. Since many of these uncertainties may affect the accuracy of the effective density, the result should be considered carefully with due regard for the measurement systems used.
To maintain the accuracy of the instruments within acceptable limits, the TEOM was calibrated according to manufacturer-provided calibration procedures. The ELPI + was calibrated about 2 months before this study according to the manufacturer’s standards. The APS and SMPS were size calibrated by using polystyrene latex (PSL) aerosols by the manufacturer. The FMPS was calibrated according to the manufacturer in the factory and it did not permit self-calibration for sizing by changes to any settings of the device. Before the start of the measurements, a set of cleaned filters were prepared for the ELPI impactor. The impactor and charger needles of the FMPS were cleaned as recommended by the manufacturer. All of the size spectrometers (APS, SMPS, FMPS, and ELPI+) were zero calibrated, and the detection signals were checked carefully to ensure the validity of the measurements. More than 95% of the data were able to be used to determine the hourly averaged effective density. The outliers (<1%) occurred near the detection limit of the TEOM (<5 µg/m3) and were regarded as invalid.
2.4. Morphology characterization
Particles collected on the size-resolved filters of the ELPI + were further analyzed with scanning electron microscopy (SEM) and energy dispersive spectrometers (EDs). All samples were gold sputter coated to be prepared for the analysis. A conventional high-vacuum electron microscope was used for the SEM observations. The accelerating voltage was set to 15 keV. Other observation conditions such as beam current and magnification were selected based on the specific requirements for different sized samples.
3. Results
3.1. Effective density of the particles by approach 1
The effective density was firstly determined with EquationEquation (1)
(1) by using the measurement data of mass concentration
(from TEOM) and number size distributions
and
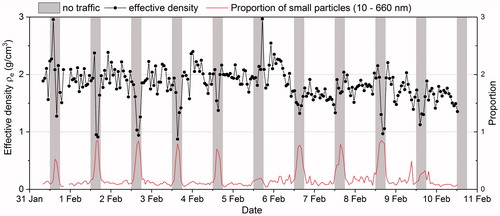
(from the combination of APS + SMPS). The daily pattern of the effective density is shown in . A mean value of 1.81 g/cm3 was observed for the whole period (31 January to 11 February), with some values going down to as small as around 0.9 g/cm3 or up to as large as about 3.0 g/cm3. The value was relatively stable during traffic operation, with a level of 1.87 ± 0.22 g/cm3 (mean ± standard deviation). Note that the values from the occasions with no traffic in operation show a large deviation from the average level. The results were also strongly influenced by the quantity of small particles measured with the SMPS (10–660 nm). When there was no traffic, the small particles accounted for about 0.7–0.85 of the total population of the particles in volume concentrations for most days, as can be seen in (red line without circles) with respect to the proportion of small particles (10–660 nm) out of the total (10 nm–10 µm). Similarly, the amount of larger particles measured with the APS dropped remarkably (Figure S1).
Figure 4. Hourly average effective density evaluated from the measurements by TEOM with APS + SMPS (black line with circles), and the proportion of small particles (10–660 nm) in volume concentration (µm3/cm3) measured with the SMPS to the total particle volume concentrations in the sizes of 0.01–10 µm with APS + SMPS (red line without circles). Grey bars represent the period without traffic operation between 00:00–06:00 each day.
For comparison purposes, the effective density was evaluated simultaneously by TEOM-ELPI + and TEOM-APS + SMPS for the measurements conducted between 20:00 on 31 January 2013 and 08:00 on 1 February 2013. The mobility diameter for the SMPS measurement was converted to aerodynamic diameter by using an effective density of 1.35 g/cm3 calculated using approach 2 (). Thus, a size range of aerodynamic diameter between about 0.01 and 10 µm was covered for both the ELPI and the combination of APS with SMPS. shows the resulting estimated effective density. An average value of 1.93 g/cm3 was obtained from the TEOM-APS + SMPS, which is about twice the value calculated from the measurements with TEOM-ELPI+ (0.99 g/cm3). A peak was observed in the time interval of 02:00–03:00 for both when there was no traffic operating. The whole measurement period was divided into four time intervals (20:00–00:00; 00:00–03:00; 03:00–06:00; 06:00–08:00) to correspond to conditions with traffic, the transition from traffic to no traffic, a steady period without traffic, and a transition period from out of service to in service. The corresponding effective densities for these four intervals were calculated separately and are summarized in . Factor 1 is the effective densities for the measurement by TEOM with APS + SMPS, and factor 2 represents the values calculated from TEOM-ELPI + measurements.
Figure 5. Hourly effective density of particles at Arlanda station on 1 February 2013, calculated from the measurements with TEOM-ELPI (mean value of 0.99 g/cm3) and with TEOM-APS + SMPS (mean value of 1.93 g/cm3)
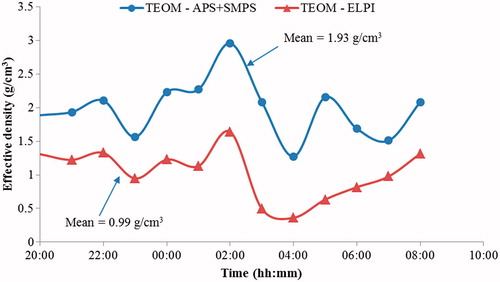
Table 1. The effective density of the railway particles measured at Arlanda station using approach 2, with conditions with traffic (20:00–00:00) and without traffic (03:00–06:00) calculated separately.
Table 2. Average effective density for four time intervals for measurements with TEOM-APS + SMPS and TEOM-ELPI.
3.2. Effective density of the particles determined with approach 2
Due to the interest in characterizing small particles, approach 2 was utilized to evaluate the effective density of those small particles. In the size range of 0.006–0.523 µm, ELPI + was used in combination with FMPS, and in the size range 0.015–0.66 µm, ELPI + was used in tandem with SMPS. Since the results using approach 1 showed that the values for effective density varied between times with and without traffic, these conditions were investigated separately using approach 2. Times between 20:00–00:00 and 03:00–06:00 were chosen to correspond to the two conditions. The estimated values of the effective density are summarized in . With traffic, the effective density was 1.45 g/cm3 for particle sizes of 0.006–0.523 µm of mobility diameter. It appeared to be slightly lower (1.35 g/cm3) when a wider size range was covered with the SMPS. In contrast, it was greater with ELPI-SMPS (1.64 g/cm3) than with ELPI-FMPS (1.25 g/cm3) for conditions without traffic. This result can be interpreted by considering the size distributions for the two conditions (Figure S2): the proportion of larger particles is much greater with traffic than without traffic for measurements with SMPS. This will be discussed later.
3.3. Fitting of the measurements
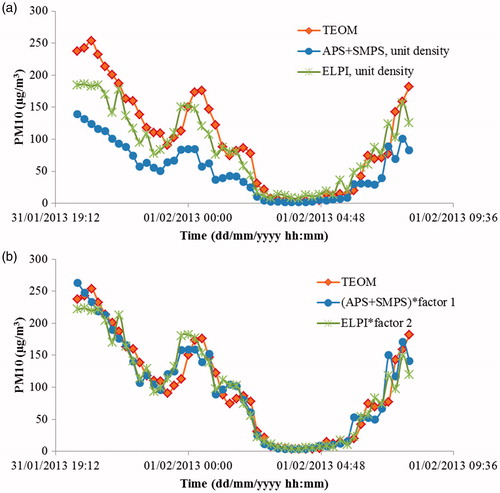
shows the PM10 levels for the measurements with different instruments. Since a unit density is commonly used for many instrument measurements (Leskinen et al. Citation2014; Rissler et al. Citation2014), for comparison purposes the PM10 values for the measurements with ELPI + and with APS + SMPS were first calculated based on unit density. The results are shown in . It can be seen that the ELPI result shows good agreement with the gravimetrically determined PM10 with the TEOM, although a slight underestimation can be observed. A correlation coefficient value R2 = 0.89 was obtained. Detailed results of the linear regression analysis are shown in Figure S3. The ELPI measured PM10 was about 0.7–1.0 of the TEOM levels for the case with traffic operation. The APS combined with the SMPS underestimated even more of the mass concentration, with a proportion of about 0.4–0.7 of the TEOM PM10. A strong correlation between the APS + SMPS and the TEOM result was also observed (R2 = 0.89). The R2 values were increased if the effective densities were used for the calculation instead. Values of R2 = 0.91 were found when comparing ELPI to TEOM, and R2 = 0.92 when comparing APS + SMPS and TEOM. shows the recalibrated result. Factor 1 and factor 2 used in the recalculation are the values of effective density estimated in Section 3.1 presented in .
Figure 6. PM10 values for the measurements performed with TEOM, APS, and ELPI: (a) assuming a density of unit (1 g/cm3) for the measurements with APS + SMPS and with ELPI and (b) recalculated using the effective densities in for ELPI and APS + SMPS.
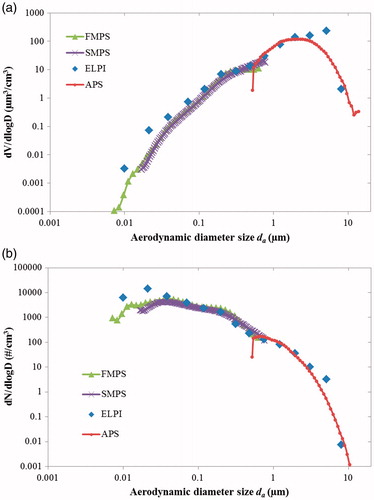
The average particle volume and number size distributions are shown in , representatively, as a function of aerodynamic diameter for the case with traffic (20:00–00:00). For volume concentration, good agreement was noted between 40 nm and 1.95 µm for all the instruments, with the exception of the smallest size channel of APS. Below 40 nm, the FMPS and SMPS agreed with each other, but a higher level was detected with the ELPI. Above 1.95 µm, the APS measured lower concentrations than the ELPI did. For the number distribution, , a unimodal distribution was observed for the APS, a bimodal distribution for the SMPS and ELPI measurement, and a trimodal distribution for the FMPS.
Figure 7. Comparison of volume (a) and number (b) size distributions of aerodynamic diameter size for the measurements by ELPI, FMPS, SMPS, and APS. The effective density used for the conversion from mobility diameter to aerodynamic diameter for the FMPS and SMPS data is 1.45 g/cm3 and 1.35 g/cm3, respectively.
4. Discussion
The effective density reflects the composition of particles and their shape factor. It is thus affected by the processes that influence at least one of these aspects. The PM in a railway system differs significantly from an ambient aerosol or diesel exhaust soot in terms of the chemical composition, owing to the different contributing sources. Emission sources of railway aerosol mainly include mechanical wear processes of metal parts, outdoor particles due to air exchange or wind effect, and resuspension dust due to the moving of trains and passengers (Branĭ Citation2006; Kim et al. Citation2008; Cha et al. Citation2018b). Owing to significant contribution from the wear of metal parts, railway aerosols are commonly characterized by an enrichment of metals (e.g., Fe, Mn, Cr, Ba, Cu, Zn, Ni, Mo, and so on) used in the production of rails, wheel, brakes, and electrical power supply systems. In terms of the shape or structure of the railway aerosol, roughly spherical, flaky, acicular, and curly crackled slice particles have been reported from the wear processes of train components (Sundh and Olofsson Citation2011; Liu et al. Citation2016; Nosko et al. Citation2017). An agglomerated form is commonly observed in the wear particles. Different chemical compositions and structures of the particles can result in variations in the effective density. It is instructive to consider the effect of those parameters on the effective density.
No published literature can be found on the study of effective density of railway particles. However, effective density has been widely investigated for individual particles (e.g., NaCl, Ag, and Zn), diesel exhaust particles, urban atmosphere, and combustion soot (McMurry et al. Citation2002; Ristimäki et al. Citation2002; Park et al. Citation2003; Zelenyuk et al. Citation2006; Khalizov et al. Citation2012; Rissler et al. Citation2014). Diesel emissions, which are characterized by high concentrations of elemental carbon (EC) and organic carbon (OC), have low effective density (from ∼1.2 g/cm3 at 30 nm–0.3 g/cm3 at 300 nm) (Maricq and Xu Citation2004). Similar levels (roughly 1 g/cm3 for small particles and down to 0.25 g/cm3 at 400 nm) have been shown for the combustion soot of wood fuels, which contains high concentrations of organic aerosol and refractory black carbon (Leskinen et al. Citation2014). In a near-traffic urban environment, a low effective density (∼1.3 g/cm3) was reported with high organic content in the particles. A higher value (∼1.4–1.5 g/cm3) was reported for periods with higher concentration of inorganic content (Rissler et al. Citation2014). In addition to the chemical composition, particle size and shape also play important roles in the value of the effective density. For example, different structures of NaCl particles give different effective densities (∼2.1 g/cm3 for roughly spherical particles, 1.6–2.0 g/cm3 for cubic particles, and 1.2–1.4 g/cm3 for agglomerated particles) (Zelenyuk et al. Citation2006). For agglomerated particles, a decreasing effective density is commonly obtained as a function of mobility diameter size (Virtanen et al. Citation2004). Another study on the effective density of wear particles emitted from car brake material presents a value of 0.75 ± 0.2 g/cm3 (Nosko and Olofsson Citation2017). Such a low-effective density was found to have a stronger dependency on the shape factor than the porosity factor by subsequent analysis of cross-sectional images (Nosko et al. Citation2017).
4.1. Variation of the effective density
The daily pattern of the effective density depends on the level of particle concentration, which is related to traffic intensity. A stable level (average ± standard deviation: 1.87 ± 0.22 g/cm3) was shown with traffic operational (08:00–00:00, see ). However, lower levels were observed from 6–8 February. At that time, rain and snow events were recorded and precipitation was reported in the VTI report (Gustafsson et al. Citation2016). It seems that the suspension of particles inside the tunnel is affected by the outdoor meteorological conditions and thus affects the effective density. The minimum value during the inoperative period without traffic between 03:00–06:00 seems to be due to the lack of traffic. No traffic was running in that period and the corresponding particle level was dramatically reduced, particularly for particles above 0.6 µm using the APS measurements (Figure S1). The aerosol was thus dominated by small particles below 0.6 µm (). An exceptional case occurred on 6 February, when the particle level of large sizes did not decrease as much as on other days, resulting in an increased value of the effective density. The reason for this exceptional case is not clear, but it may be due to maintenance work in the tunnel. The elements that occurred most in the aerosol particles measured are those associated with wear particles from train and rail metal parts (Fe, Cu, Mn, Cr, Ca, and Zn) in the mode of around 2.0 µm (Figure S4). Although published information is limited on the comparison of the chemical components in railway particles for periods with traffic and without traffic, those elements in the mode of around 2 µm are expected to dramatically decrease since the mechanical wear of metal components does not occur during the inoperative period.
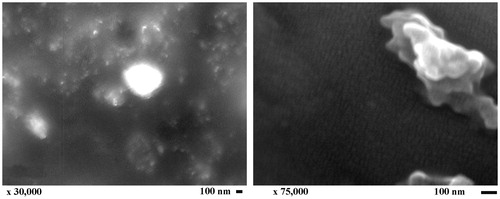
Railway particles are usually not perfectly spherical. An example is shown in the SEM image in . They can be flaky, angular, acicular, or roughly spherical. Most of the particles are in the form of agglomerate and may contain inner and outer porosities. Therefore, their effective density can be underestimated compared to the bulk density or material density. With the result of weight% of chemical elements for area detection with the EDs (Table S1), it is possible to simply estimate the particle density of the bulk material by summing up the products of corresponding weight% and the density of each chemical element (Alemani et al. Citation2015). Particle density of the bulk material for a particle size of 200 nm is estimated to be about 2.57 g/cm3. The estimated average effective density is smaller than this bulk density.
Figure 8. An example of SEM images of the collected railway particles for diameter sizes of 30 nm (left panel) and 200 nm (right panel).
4.2. Comparison between the measurements with different instruments
In addition to the effect of chemical composition and particle shapes related to the origin of the particles on their density, the effective density value may differ if determined with different algorithms or different detection systems (DeCarlo et al. Citation2004). It hence can be used in return to calibrate mass concentrations of particles measured with number-based instruments to obtain comparable levels of the results measured simultaneously with gravimetrical methods. Commonly used instruments for field measurements use aerodynamic, mobility, optical, and gravimetric techniques. Although optical measurement were not included in our study, further studies on effective density involving the calibration or comparison of optical size measurements to aerodynamic and mobility diameter measurements would be interesting. In this study, parallel measurements were performed with aerodynamic, mobility, and gravimetrical instruments. When it came to aerodynamic size distributions and gravitational mass concentrations, similar hourly variations in the effective density were estimated using the measurements with the TEOM-ELPI and the TEOM-APS + SMPS, except that the former shows a lower level than the latter (). For the comparison between aerodynamic and mobility diameter detection techniques, the fitting of the FMPS to the ELPI gives a slightly higher value of effective density than that produced by the comparison between SMPS and ELPI. To better interpret those results, it would be beneficial to consider the performance of the different instruments.
4.2.1. Aerodynamic measurements: ELPI vs. APS + SMPS
The ELPI generally showed good agreement with the measurement performed with the APS + SMPS for particle sizes between 40 nm and 2 µm (). However, this agreement appeared to be poor below 40 nm and above 2 µm, which may be due to the different efficiencies of the instrument at these sizes. The ELPI overestimated the particle concentration at both ends of the size range compared to the combination of APS with SMPS, thus resulting in a lower level of effective density. Similar comparisons have been made between the ELPI and other instruments for different particles (Price et al. Citation2014). Price showed that the ELPI overestimated the number concentration of TiO2 particles and fumed silica particles at both the lower and upper ends of its working range, compared to the measurement with APS combined with SMPS. It has been reported that the overestimation of particle levels greater than 2.5 µm can be attributed to remaining uncertainties in regard to the collection of particles smaller than the cut-off point and the charger efficiency of the ELPI+ (Pagels et al. Citation2005). In addition, particle bounce at small size bins has been identified as causing the increase of particles at the corresponding sizes (Leskinen et al. Citation2012). On the other hand, the APS was found to underestimate the concentration of particles above 4 or 5 µm (Pagels et al. Citation2005; Price et al. Citation2014). The main reason for the underestimation by an APS may relate to its poor performance with loose agglomerates (Tsai et al. Citation2009), which are common in railway aerosols.
4.2.2. Mobility diameter measurements: FMPS vs. SMPS
The FMPS size distribution measured in this study in general correlates well with the SMPS (), despite the fact that the FMPS is considered to be less sensitive than the SMPS (Price et al. Citation2014 and reference therein). Given the fact that the FMPS measurement is based on unipolar charger and the measured particle concentration is morphology dependent while the SMPS is bipolar charger based and is morphology independent, discrepancies can be expected from the measurement with the FMPS compared to true particles or to the SMPS result. For the detection of railway particles in this study, the FMPS estimated a higher number concentration as compared to the SMPS (Figure S5). A mode of 34 nm was observed for both instruments, except that an extra mode around 10 nm was shown for the FMPS. Owing to the different working ranges for the two devices, more small particles but fewer large particles can be measured with the FMPS. As a consequence, the effective density calculated based on the FMPS and the SMPS varied (1.45 g/cm3 for the FMPS and 1.35 g/cm3 for the SMPS for the case with traffic). When there was no traffic, the effective density decreases with the FMPS test, but increases with the SMPS. This is due to the greater number of larger particles above 500 nm detected with the SMPS for the period with traffic in operation. Those particles (above 500 nm) reduced greatly when there was no traffic and thus led to the increase in the effective density (Figure S2). Different from the SMPS result, the particle fraction greater than 500 nm is at the end of the size range of the FMPS, the reliability would be weaker for the FMPS measurement at those sizes.
4.2.3. Gravimetrically mass determination: TEOM
The hourly averaged effective density was relatively steady, with a standard deviation of ±0.22 g/cm3 for the periods with traffic (). Variations in the levels for the period without traffic can be traced back to the effect of instrument noise when the particle concentrations were near the detection limit of the TEOM/FDMS system (around or below 5 µg/m3). Unstable results can also be expected at the transition period (00:00–03:00 when a decrease in the mass concentration occurred). An example of the increase in effective density is shown in . It can be attributed to the automatic adjustment function for the measurement of mass change with the TEOM/FDMS system. In other words, when the FDMS measured a decrease of filter mass during the purging period (every 6 min), the mass decrease was added back into the mass measurement (Wilson et al. Citation2006). Thus, the decrease in mass concentration determined with the TEOM/FDMS was slower than the decrease in the number concentration measurements by the APS + SMPS or by the ELPI. Consequently, an increase in the effective density was obtained.
4.3. Comparison of the average value to other studies with same instrument
Since effective density is related to particle source, morphology, and determination methods, difficulties arise when comparing values in different studies. To the best of our knowledge, no similar studies have been carried out elsewhere to investigate the effective density of particles in a railway tunnel environment. Instead, most of the literature focuses on the urban environment and diesel emissions. When comparing our results to those from studies using the same measurement system, the effective density of railway particles is found to be higher than that measured for urban environments, and even higher than that measured for diesel exhaust. It was found that the urban atmosphere (in Pittsburgh, PA, USA) had an effective density of 1.5 ± 0.26 g/cm3 determined with TEOM – APS + SMPS (Khlystov et al. Citation2004), while an average diurnal value of 1.87 ± 0.22 g/cm3 is achieved in our study with the same instruments. With the method comparing ELPI with SMPS, the aerosol in a boreal forest environment was found to have an average density of ∼1.0 g/cm3 (for particles in the size of 30–100 nm) (Kannosto et al. Citation2008). Diesel exhaust particles were estimated to have a density of 1.1–1.2 g/cm3 (Virtanen et al. Citation2002) compared to ∼1.35 g/cm3 for the particles characterized by inorganic metals from railway particles in our study. Different chemical components could be the reason for the differences in the values of the effective density for the different aerosols.
5. Conclusion
The effective density of aerosol particles in an underground railway tunnel was investigated using two different methods. Method one is based on measuring mass concentration in tandem with number size distribution measurements, while method two is based on the comparison of simultaneous aerodynamic and mobility measurements. Different results were found for the different methods. Deviations even arise when using the same algorithm but different combinations of instruments, owing to their different performance as regards working size ranges. In spite of this, similar diurnal variation in the effective density was found using method one measured by different instruments. The values of the effective density were found to be traffic-related. A relatively steady value (1.87 ± 0.22 g/cm3) was obtained for the period with traffic operation, while the value fluctuated dramatically (between 0.9 and 3 g/cm3) when there was no traffic.
In addition, the measurement of railway particles with different techniques (aerodynamic, mobility, and gravimetric) was compared with respect to the performance of the instruments.
| Nomenclature | ||
| d | = | diameter |
| i | = | current (continuous) |
| k | = | kernel function |
| m | = | mass concentration |
| n | = | number concentration |
| ρ | = | density |
| ε | = | error |
| χ | = | shape factor |
| D | = | midpoint size |
| E | = | collection efficiency |
| I | = | current (discrete) |
| Cc | = | slip correction factor |
| Ech | = | charger efficiency |
| APM | = | aerosol particle mass analyzer |
| APS | = | aerodynamic particle sizer |
| CPMA | = | centrifugal particle mass analyzer |
| DMA | = | differential mobility analyzer |
| ELPI+ | = | electrical low pressure impactor plus |
| FMPS | = | fast mobility particle sizer |
| SMPS | = | scanning mobility particle sizer |
| TEOM | = | tapered element oscillating microbalance |
| UFATOFMS | = | ultrafine aerosol time-of-flight mass spectrometer |
| Subscripts | ||
| a | = | aerodynamic |
| b | = | mobility equivalent |
| e | = | effective |
| i | = | stage number |
| p | = | particle |
| s | = | simulated |
| 0 | = | unit |
Supplemental Material
Download Zip (479.3 KB)Acknowledgments
We greatly appreciate the support of Dr. Christer Johansson, Dr. Michael Norman from SLB Analys, and Dr. Mats Gustafsson from VTI for this study. In addition, the authors are grateful for the advice of Dr. Oleksii Nosko from Bialystok University of Technology. This research represents parts of the regular research activities of the Railway Group, KTH Royal Institute of Technology, Stockholm, Sweden.
Related Research Data
References
- Abbasi, S., Jansson, A., Olander, L., Olofsson, U., and Sellgren, U. (2012). A Pin-on-Disc Study of the Rate of Airborne Wear Particle Emissions from Railway Braking Materials. Wear, 284–285:18–29.
- Alberta Environment. (2009). Standard Operating Procedure for the Tapered Element Oscillating Microbalance (TEOM), AEVN Air Monitoring and Audit Centre. https://www3.epa.gov/ttnamti1/files/ambient/pm25/sop_project/905505_TEOM_SOP_Draft_Final_Sept09.pdf.
- Alemani, M., Nosko, O., Metinoz, I., and Olofsson, U. (2015). A Study on Emission of Airborne Wear Particles from Car Brake Friction Pairs. SAE Int. J. Mater. Manuf., 9:147–157.
- Branĭ, M. (2006). The Contribution of Ambient Sources to Particulate Pollution in Spaces and Trains of the Prague Underground Transport System. Atmos. Environ., 40:348–356.
- Cartenì, A., Cascetta, F., and Campana, S. (2015). Underground and Ground-Level Particulate Matter Concentrations in an Italian Metro System. Atmos. Environ., 101:328–337.
- Cha, Y., Abbasi, S., and Olofsson, U. (2018a). Indoor and Outdoor Measurement of Airborne Particulates on a Commuter Train Running Partly in Tunnels. Proc. Inst. Mech. Eng. Part F J. Rail Rapid Transit., 232:3–13.
- Cha, Y., Hedberg, Y., Mei, N., and Olofsson, U. (2016). Airborne Wear Particles Generated from Conductor Rail and Collector Shoe Contact: Influence of Sliding Velocity and Particle Size. Tribol. Lett., 64:40.
- Cha, Y., Olofsson, U., Gustafsson, M., and Johansson, C. (2018b). On Particulate Emissions from Moving Trains in a Tunnel Environment. Transp. Res. Part D Transp. Environ., 59:35–45.
- Cowen, K., Kelly, T., Coutant, B., and Riggs, K. (2001). Environmental Technology Report, ETV Advanced Monitoring Systems Center, Rupprecht & Patashnick Co., Series 1400a TEOM Particle Monitor with Sample Equilibration System.
- DeCarlo, P. F., Slowik, J. G., Worsnop, D. R., Davidovits, P., and Jimenez, J. L. (2004). Particle Morphology and Density Characterization by Combined Mobility and Aerodynamic Diameter Measurements. Part 1: Theory. Aerosol Sci. Technol., 38:1206–1222.
- Dinar, E., Mentel, T. F., and Rudich, Y. (2006). The Density of Humic Acids and Humic Like Substances (HULIS) from Fresh and Aged Wood Burning and Pollution Aerosol Particles. Atmos. Chem. Phys. Discuss., 6:7835–7867.
- Fridell, E., Ferm, M., and Ekberg, A. (2010). Emissions of Particulate Matters from Railways – Emission Factors and Condition Monitoring. Transp. Res. Part D Transp. Environ., 15:240–245.
- Gustafsson, M., Abbasi, S., Blomqvist, G., Cha, Y., Gudmundsson, A., Janhäll, S., Johansson, C., Norman, M., and Olofsson, U. (2016). Particles in Road and Railroad Tunnel Air – Sources, Properties and Abatement Measures. VTI report 917A, 15–20.
- Gustafsson, M., Blomqvist, G., Gudmundsson, A., Janhäll, S., Johansson, C., Norman, M., and Olofsson, U. (2017). Particle Mass Size Distribution Relation to Train Traffic and Type in a Railway Tunnel. J. Earth Sci. Geotech. Eng., 7:119–126.
- Gustafsson, M., Blomqvist, G., Swietlicki, E., Dahl, A., and Gudmundsson, A. (2012). Inhalable Railroad Particles at Ground Level and Subterranean Stations – Physical and Chemical Properties and Relation to Train Traffic. Transp. Res. Part D Transp. Environ., 17:277–285.
- Hu, M., Peng, J., Sun, K., Yue, D., Guo, S., Wiedensohler, A., and Wu, Z. (2012). Estimation of Size-Resolved Ambient Particle Density Based on the Measurement of Aerosol Number, Mass, and Chemical Size Distributions in the Winter in Beijing. Environ. Sci. Technol., 46:9941–9947.
- Kam, W., Cheung, K., Daher, N., and Sioutas, C. (2011). Particulate Matter (PM) Concentrations in Underground and Ground-Level Rail Systems of the Los Angeles Metro. Atmos. Environ., 45:1506–1516.
- Kannosto, J., Lemmetty, M., Virtanen, a., Mäkelä, J. M., Keskinen, J., Junninen, H., Hussein, T., Aalto, P., and Kulmala, M. (2008). Mode Resolved Density of Atmospheric Aerosol Particles. Atmos. Chem. Phys. Discuss., 8:7263–7288.
- Karlsson, H. L., Holgersson, A., and Möller, L. (2008). Mechanisms Related to the Genotoxicity of Particles in the Subway and from Other Sources. Chem. Res. Toxicol., 21:726–731.
- Kelly, W. P., and McMurry, P. H. (1992). Measurement of Particle Density by Inertial Classification of Differential Mobility Analyzer–Generated Monodisperse Aerosols. Aerosol Sci. Technol., 17:199–212.
- Khalizov, A. F., Hogan, B., Qiu, C., Petersen, E. L., and Zhang, R. (2012). Characterization of Soot Aerosol Produced from Combustion of Propane in a Shock Tube. Aerosol Sci. Technol., 46:925–936.
- Khlystov, A., Stanier, C., and Pandis, S. N. (2004). An Algorithm for Combining Electrical Mobility and Aerodynamic Size Distributions Data When Measuring Ambient Aerosol. Aerosol Sci. Technol., 38:229–238.
- Kim, K. Y., Kim, Y. S., Roh, Y. M., Lee, C. M., and Kim, C. N. (2008). Spatial Distribution of Particulate Matter (PM10 and PM2.5) in Seoul Metropolitan Subway Stations. J. Hazard. Mater., 154:440–443.
- Klepczyńska Nyström, a, Svartengren, M., Grunewald, J., Pousette, C., Rödin, I., Lundin, a, Sköld, C.M., Eklund, a, and Larsson, B.-M. (2010). Health Effects of a Subway Environment in Healthy Volunteers. Eur. Respir. J., 36:240–8.
- Kumar, P., Robins, A., Vardoulakis, S., and Britter, R. (2010). A review of the Characteristics of Nanoparticles in the Urban Atmosphere and the Prospects for Developing Regulatory Controls. Atmos. Environ., 44:5035–5052.
- Leskinen, J., Ihalainen, M., Torvela, T., Kortelainen, M., Lamberg, H., Tiitta, P., Jakobi, G., Grigonyte, J., Joutsensaari, J., Sippula, O., Tissari, J., Virtanen, A., Zimmermann, R., and Jokiniemi, J. (2014). Effective Density and Morphology of Particles Emitted from Small-Scale Combustion of Various Wood Fuels. Environ. Sci. Technol., 48:13298–13306.
- Leskinen, J., Joutsensaari, J., Lyyränen, J., Koivisto, J., Ruusunen, J., Järvelä, M., Tuomi, T., Hämeri, K., Auvinen, A., and Jokiniemi, J. (2012). Comparison of Nanoparticle Measurement Instruments for Occupational Health Applications. J. Nanoparticle Res., 14.
- Liu, H., Cha, Y., Olofsson, U., Jonsson, L. T. I., and Jönsson, P. G. (2016). Effect of the Sliding Velocity on the Size and Amount of Airborne Wear Particles Generated from Dry Sliding Wheel–Rail Contacts. Tribol. Lett., 63:30.
- Maricq, M. M. and Xu, N. (2004). The Effective Density and Fractal Dimension of Soot Particles from Premixed Flames and Motor Vehicle Exhaust. J. Aerosol Sci., 35(10):1251–1274.
- Marjamäki, M., Lemmetty, M., and Keskinen, J. (2005). ELPI Response and Data Reduction I: Response Functions. Aerosol Sci. Technol., 39:575–582.
- Martins, V., Cruz Minguillón, M., Moreno, T., Querol, X., de Miguel, E., Capdevila, M., Centelles, S., and Lazaridis, M. (2015). Deposition of Aerosol Particles from a Subway Microenvironment in the Human Respiratory Tract. J. Aerosol Sci., 90:103–113.
- McMurry, P. H., Wang, X., Park, K., and Ehara, K. (2002). The Relationship Between Mass and Mobility for Atmospheric Particles: A New Technique for Measuring Particle Density. Aerosol Sci. Technol., 36:227–238.
- Nosko, O., Borrajo-Pelaez, R., Hedström, P., and Olofsson, U. (2017). Porosity and Shape of Airborne Wear Microparticles Generated by Sliding Contact Between a Low-Metallic Friction Material and a Cast Iron. J. Aerosol Sci., 113:130–140.
- Nosko, O. and Olofsson, U. (2017). Effective Density of Airborne Wear Particles from Car Brake Materials. J. Aerosol Sci., 107:94–106.
- Olfert, J. S., Symonds, J. P. R., and Collings, N. (2007). The Effective Density and Fractal Dimension of Particles Emitted from a Light-Duty Diesel Vehicle with a Diesel Oxidation Catalyst. J. Aerosol Sci., 38:69–82.
- Olofsson, U. (2011). A Study of Airborne Wear Particles Generated from the Train Traffic—Block Braking Simulation in a Pin-on-Disc Machine. Wear, 271:86–91.
- Pagels, J., Gudmundsson, A., Gustavsson, E., Asking, L., and Bohgard, M. (2005). Evaluation of Aerodynamic Particle Sizer and Electrical Low-Pressure Impactor for Unimodal and Bimodal Mass-Weighted Size Distributions. Aerosol Sci. Technol., 39:871–887.
- Park, K., Cao, F., Kittelson, D. B., and McMurry, P. H. (2003). Relationship Between Particle Mass and Mobility for Diesel Exhaust Particles. Environ. Sci. Technol., 37:577–583.
- Pitz, M., Cyrys, J., Karg, E., Wiedensohler, A., Wichmann, H. E., and Heinrich, J. (2003). Variability of Apparent Particle Density of an Urban Aerosol. Environ. Sci. Technol., 37:4336–4342.
- Pitz, M., Schmid, O., Heinrich, J., Birmili, W., Maguhn, J., Zimmermann, R., Wichmann, H. E., Peters, A., and Cyrys, J. (2008). Seasonal and Diurnal Variation of PM2.5 Apparent Particle Density in Urban Air in Augsburg, Germany. Environ. Sci. Technol., 42:5087–5093.
- Price, H. D., Stahlmecke, B., Arthur, R., Kaminski, H., Lindermann, J., Däuber, E., Asbach, C., Kuhlbusch, T. A. J., BéruBé, K. A., and Jones, T. P. (2014). Comparison of Instruments for Particle Number Size Distribution Measurements in Air Quality Monitoring. J. Aerosol Sci., 76:48–55.
- Quiros, D. C., Hu, S., Hu, S., Lee, E. S., Sardar, S., Wang, X., Olfert, J. S., Jung, H. S., Zhu, Y., and Huai, T. (2015). Particle Effective Density and Mass During Steady-State Operation of GDI, PFI, and Diesel Passenger Cars. J. Aerosol Sci., 83:39–54.
- Rissler, J., Nordin, E. Z., Eriksson, A. C., Nilsson, P. T., Frosch, M., Sporre, M. K., Wierzbicka, A., Svenningsson, B., Löndahl, J., Messing, M. E., Sjogren, S., Hemmingsen, J. G., Loft, S., Pagels, J. H., and Swietlicki, E. (2014). Effective Density and Mixing State of Aerosol Particles in a Near-Traffic Urban Environment. Environ. Sci. Technol., 48:6300–6308.
- Ristimäki, J., Virtanen, A., Marjamäki, M., Rostedt, A., and Keskinen, J. (2002). On-Line Measurement of Size Distribution and Effective Density of Submicron Aerosol Particles. J. Aerosol Sci., 33:1541–1557.
- Spencer, M. T., Shields, L. G., and Prather, K. A. (2007). Simultaneous Measurement of the Effective Density and Chemical Composition of Ambient Aerosol Particles. Environ. Sci. Technol., 41:1303–1309.
- Sundh, J. and Olofsson, U. (2011). Relating Contact Temperature and Wear Transitions in a Wheel–Rail Contact. Wear, 271:78–85.
- Svensk standar (2014). Utsläpp och utomhusluft - Kvalitetssäkring av automatiska mätsystem. Available at https://sis.se/produkter/miljo-och-halsoskydd-sakerhet/luftkvalitet/ssen141812014/
- Tsai, C. J., Wu, C. H., Leu, M. L., Chen, S. C., Huang, C. Y., Tsai, P. J., and Ko, F. H. (2009). Dustiness Test of Nanopowders Using a Standard Rotating Drum with a Modified Sampling Train. J. Nanoparticle Res., 11:121–131.
- Virtanen, A., Ristimäki, J., and Keskinen, J. (2004). Method for Measuring Effective Density and Fractal Dimension of Aerosol Agglomerates. Aerosol Sci. Technol., 38:437–446.
- Virtanen, A., Ristimaki, J., Marjamaki, M., Vaaraslahti, K., Keskinen, J., and Lappi, M. (2002). Effective Density of Diesel Exhaust Particles as a Function of Size. SAE Tech. Pap., 2002-01-0056. https://doi.org/10.4271/2002-01-0056
- Wilson, W. E., Grover, B. D., Long, R. W., Eatough, N. L., and Eatough, D. J. (2006). The Measurement of Fine Particulate Semivolatile Material in Urban Aerosols. J. Air Waste Manag. Assoc., 56:384–397.
- Zelenyuk, A., Cai, Y., and Imre, D. (2006). From Agglomerates of Spheres to Irregularly Shaped Particles: Determination of Dynamic Shape Factors from Measurements of Mobility and Vacuum Aerodynamic Diameters. Aerosol Sci. Technol., 40:197–217.