
Abstract
This article describes the modification of a laminar flow, thermally diffusive universal-fluid condensation particle counter (standard operation: 50% detection efficiency at 5 nm) to rapidly measure the size distribution of sub 3 nm aerosol. Sub 3 nm detection was achieved by using diethylene glycol as the working fluid, which enabled high instrument super-saturations while minimizing homogenous nucleation of the working fluid; a detection efficiency of 50% was achieved at 1.6 nm with laboratory-generated ammonium sulfate (AS) aerosol. Rapid aerosol sizing beneath 3 nm was achieved by inverting the measured grown droplet size distribution (1 s sampling) to recover the sampled aerosol size distribution. The developed inversion algorithm utilizes analytical kernel functions determined from the instrument response to pseudo-monodisperse AS aerosol from 1.5 nm to 20 nm, generated by a high-resolution DMA and a nano DMA. The inversion algorithm was tested numerically with assumed, idealized aerosol size distributions consistent with observed new particle formation events, yielding a reasonable agreement between inverted and assumed aerosol size distributions below 3 nm. This technique provides a measure of the aerosol size assuming an aerosol composition identical to that of the aerosol used to generate the experimentally determined kernel function.
Copyright © 2018 American Association for Aerosol Research
EDITOR:
Introduction
Atmospheric particle nucleation is an important environmental nano-scale process, with field measurements and modeling studies indicating that freshly nucleated particles can contribute significantly to the global population of aerosol and cloud condensation nuclei (Lihavainen et al. Citation2003; Kerminen et al. Citation2005; Spracklen et al. Citation2008; Kuang et al. Citation2009). Butanol-based ultrafine condensation particle counters (CPCs) have traditionally been used to detect nanoparticles with diameters down to about 3 nm (Stolzenburg and McMurry Citation1991). However, detailed understanding of atmospheric nucleation and its influence on climate requires aerosol measurements below 3 nm, in order to gain a process-level understanding of the formation of new aerosol around 1 nm from gaseous precursors. Recent advances in the development of CPCs have enabled the detection of gas-phase single molecules and molecular clusters down to 1 nm diameter and below through the use of new working fluids and varying operating conditions (Iida et al. Citation2009; Sipilä et al. Citation2009; Vanhanen et al. Citation2011; Kuang et al. Citation2012a; Wimmer et al. Citation2013). This new capability has enabled the direct measurement of aerosol nucleation from trace-gas precursors in both laboratory experiments (Kirkby et al. Citation2011) and the ambient environment (Jiang et al. Citation2011b; Chen et al. Citation2012; Kuang et al. Citation2012b), providing information necessary to understand and constrain the nucleation mechanism. While there have been an increasing number of atmospheric cluster measurements from surface-based platforms, there have been very few measurements of the vertically-resolved ambient cluster size distribution from aerial platforms, which are needed to connect atmospheric nucleation with large-scale boundary layer transport processes. To address this measurement need, a universal-fluid (UF) CPC manufactured by Palas (Karlsruhe, Germany) has been adapted to rapidly measure (∼1 Hz sampling time resolution) the atmospheric cluster size distribution (<3 nm) through inversion of the size distribution of the grown droplets detected inside the UF-CPC optical sensor. This measurement technique has been developed previously using butanol-based CPCs (Saros et al. Citation1996; Weber et al. Citation1998; Dick et al. Citation2000; Sipilä et al. Citation2009), and this work further advances the technique by using diethylene glycol (DEG) as the working fluid, which has seen widespread use in commercial 1 nm CPCs (Vanhanen et al. Citation2011; Kuang et al. Citation2012a). This aerosol sizing technique is based on the observation that, in an aerosol size range that is typically in the cut-off region of the CPC size-dependent detection efficiency curve, the size of the grown droplet detected in the CPC optical sensor increases as the size of the aerosol sampled into the CPC increases. This monotonic relationship between sampled aerosol size and grown droplet size is due to the shape of the super-saturation profile that sampled aerosol are exposed to as they traverse the CPC condenser and are activated for growth (Saros et al. Citation1996). Consequently, the relationship between sampled aerosol size and grown droplet size will be strongly affected by variables that affect aerosol activation, including aerosol composition. The resulting measure of aerosol size that this technique provides is sensitive to aerosol composition and can be thought of more as an “activation” size. This is in contrast to other aerosol sizing techniques in the 1–3 nm size range which are not sensitive to aerosol composition, such as electrical mobility-based sizing used in air ion spectrometers (Mirme and Mirme Citation2013) and high-resolution differential mobility analyzers (de la Mora and Kozlowski Citation2013). This work presents: laboratory characterizations of the instrument particle detection efficiencies and grown droplet size distributions for size-resolved calibration aerosol, development of the inversion algorithm to invert droplet size distributions to recover the sampled aerosol size distribution, and numerical testing of the inversion algorithm with assumed, idealized aerosol size distributions consistent with observed new particle formation.
Experimental methods
Instrument description
The Palas UF-CPC is a laminar flow, thermally diffusive CPC in which the working fluid is continuously cycled within the saturator, and where an optical sensor with an LED white light source enables the monitoring of the grown droplet size distribution (Baltzer et al. Citation2014). The white light source is essential for this work since it enables the generation of smooth, uni-modal droplet size distributions with distribution peaks that increase monotonically with increasing sampled aerosol size (Marti et al. Citation1996). In this work, the following reversible modifications were applied to the UF-CPC to enable aerosol detection below 3 nm and sizing of the resulting grown droplets: (1) the use of DEG as the working fluid; (2) increasing the saturator temperature to 60 °C (standard saturator temperature = 37 °C) and decreasing the condenser temperature to 10 °C (standard condenser temperature = 15 °C); and (3) increasing the photo-detector gain. The standard operating flow-rate of 0.9 L/min was maintained. The use of DEG as a working fluid enables sub 2 nm aerosol detection due to its high surface tension and low vapor pressure (Iida et al. Citation2009; Vanhanen et al. Citation2011). The temperature difference between the saturator and condenser was adjusted to maximize the instrument super-saturation while minimizing the detection of droplets formed through the homogeneous nucleation of DEG. In commercial DEG-based CPCs, super-saturated vapor of DEG heterogeneously nucleates and condenses onto sampled aerosol, leading to the formation of DEG droplets (∼100 nm in diameter) of a size that is below the detection limit of the optical photo-detectors in those particular commercial DEG CPCs (Iida et al. Citation2009; Vanhanen et al. Citation2011). The relatively small size of the DEG droplets (compared to butanol droplets formed in a butanol CPC) results from the rather low vapor pressure of DEG (Iida et al. Citation2009). Consequently, a second, “booster” CPC is needed to complete the growth of the DEG droplets to an optically-detectable size. In this work, only one CPC is needed due in large part to the unique optical photo-detector of the Palas UF-CPC, where the detector gain can be increased so as to enable direct detection of the grown DEG droplets within the scattering volume of the UF-CPC optical sensor. Current, commercial DEG-based CPCs utilize fixed-gain detectors, which lead to the scattered light signal from the DEG droplets over-lapping with the electronic noise of the photo-detector. With the Palas-UF-CPC, the photo-detector gain was systematically increased until the scattered light signal from the DEG droplets were clearly discernible from the photo-detector noise. Instrument super-saturations in the DEG UF-CPC are comparable to those achieved in commercial DEG CPCs.
Instrument characterization
The response of the DEG UF-CPC to particles of known size, charge, and composition was evaluated using a calibration system similar to those described in other studies of sub 3 nm CPCs (Jiang et al. Citation2011a; Kuang et al. Citation2012a; Hering et al. Citation2017). Two methods for producing calibration aerosols were used in this study: (1) electrospray generation of molecular ion mobility standards (tetra-heptyl ammonium bromide ions) (Ude and De la Mora Citation2005); and (2) evaporation of atomized ammonium sulfate (AS) in a tube furnace followed by rapid vapor condensation (Scheibel Citation1983). All chemicals were purchased and used as received from Sigma Aldrich (St. Louis, MO, USA). The calibration aerosols were charged with a TSI soft X-ray neutralizer (Model 3088) and were mobility classified with a half-mini high-resolution differential mobility analyzer (de la Mora and Kozlowski Citation2013), producing true monodisperse molecular ion mobility standards and pseudo-monodisperse AS aerosols. The monodisperse tetra-heptyl ammonium bromide (THABr) molecular ions have a mobility equivalent diameter of 1.47 nm and 1.78 nm for the monomer and the dimer, respectively (Ude and De la Mora Citation2005), and the pseudo-monodisperse AS aerosol has a size uncertainty of ±0.03 nm at 1.47 nm (de la Mora and Kozlowski Citation2013). The detection efficiency at a given particle size was determined from the ratio of the particle concentration measured by the DEG UF-CPC to that measured by a TSI aerosol electrometer (Model 3068b). In order to increase the AS aerosol signal in the sub 3 nm size range, diffusional losses were minimized and the aerosol residence time within the tube furnace was optimized, resulting in concentrations of mobility-classified sub 3 nm AS aerosol in the range of 1000–10,000 particles/cm3.
Results and discussion
Detection efficiency
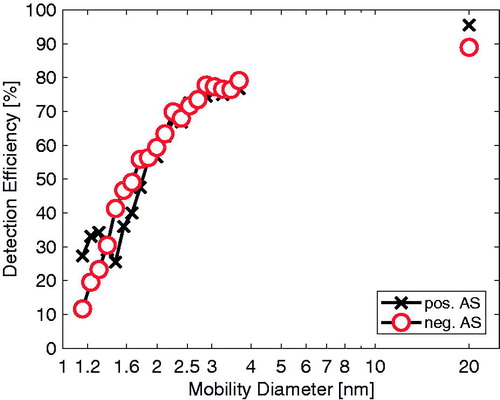
The size-dependent detection efficiencies for positive and negative, singly-charged AS are presented in . The DEG UF-CPC has a (size at which detection efficiency = 50%) at around 1.6 nm for negatively charged AS, which compares reasonably well with reported cut-sizes for commercial, DEG-based CPCs: TSI 3777
= 1.4 nm (Kuang et al. Citation2012a; Wimmer et al. Citation2013); Airmodus PSM
= 1.4 nm (Kangasluoma et al. Citation2014). Detection efficiencies for the THABr monomer (1.47 nm) and dimer (1.78 nm) were determined to be 1.8% and 10.8%, respectively. The DEG UF-CPC displays a marked improvement over the normal UF-CPC which, running under standard operating conditions with butanol as the working fluid, has a 50% cut-size at 5 nm (Baltzer et al. Citation2014). The relative uncertainty for each measurement of detection efficiency is less than 10%.
Figure 1. Particle size-dependent detection efficiencies for negative and positive, singly charged AS aerosol, determined as the ratio of the DEG UF-CPC concentration to the electrometer concentration. The relative uncertainty for each measured of detection efficiency is less than 10%.
Droplet size distributions
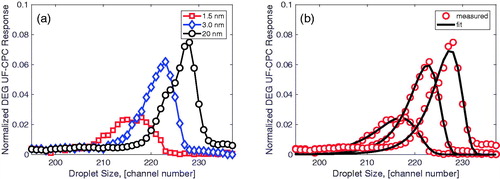
shows a set of measured droplet size distributions (instrument response functions normalized to the electrometer concentration) for negatively-charged AS particles of selected sizes (1.5, 3.0, and 20 nm). The droplet size distributions are uni-modal and skewed with a long tail – characteristics that provide guidance regarding appropriate analytical distribution functions for subsequent fitting. As the size of the sampled calibration AS aerosol increases from 1.5 nm to 20 nm, the resulting size of the grown DEG droplets also increases, as evidenced in by the shift of the droplet size distribution mode to larger channel numbers. This size-dependent droplet growth is attributed to the shape of the super-saturation profile inside the condenser (monotonically increasing with axial distance), which results in small aerosol having less time for condensational growth compared to large aerosol, since small aerosol are activated at a distance downstream of where large aerosol are activated for growth inside the instrument condenser (Weber et al. Citation1998).
Figure 2. (a) Measured DEG droplet size distributions as a function of droplet size (channel number) for sampled negative charged AS aerosol of size 1.5, 3.0, and 20 nm. (b) Comparison of measured droplet size distributions (from sampled negative charged AS aerosol of size 1.5, 3.0, and 20 nm) with modeled kernel functions defined by EquationEquations (2)(2) and Equation(3)
(3) , and values in .
The dispersity (width) of the measured droplet size distribution will be, in general, impacted by the dispersity of the sampled aerosol and the processes that contribute to non-uniform droplet growth within the CPC such as a non-uniform distribution of particle growth residence times and spatial heterogeneity in the condensing vapor concentration and super-saturation. To examine the extent to which sampled particle size dispersity would affect grown droplet size dispersity, the droplet size distribution dispersity of the THABr dimer (true monodisperse, 1.78 nm) was compared to the droplet size distribution dispersity of pseudo-monodisperse 1.78 nm AS. Droplet size distribution dispersities were comparable, suggesting that particle size dispersity had minimal impact on droplet size dispersity compared to other factors affecting droplet growth in the CPC. The dispersity of each the measured droplet size distribution was captured in the kernel function analytical fits.
Data inversion
The relationship between the sampled aerosol size distribution and the resulting grown droplet size distribution
as measured by the optical sensor of DEG UF-CPC is defined as follows:
(1)
where
is the distribution of droplet counts
as a function of droplet size
(where
is the channel number of the optical detector and is proportional to the droplet size), and where
is the instrument response, or kernel function, which describes the probability that a sampled particle of size
is activated and grown to a droplet with a size that is binned into channel
. Kernel functions for inversion were obtained by fitting smooth, analytical distribution functions to the measured droplet size distribution obtained from the size-resolved AS calibration aerosol, a subset of which is shown in . Inversion of EquationEquation (1)
(1) to obtain a unique, physically meaningful solution of
for a given measurement of
is facilitated by using smooth, analytical fits to the measured kernel functions (Weber et al. Citation1998; Sipilä et al. Citation2009). Analytical kernel functions were obtained by fitting the measured droplet size distributions with a generalized extreme value distribution of the form:
(2)
yielding best-fit values of the parameters
,
, and
, which are associated, respectively, with the peak, scale, and location of the measured droplet size distribution for a given sampled particle of diameter
;
is a shape parameter that was set to 0.1 to capture the skewness of the measured droplet size distribution. In order to obtain their dependence on particle diameter, the resulting best-fit values of
,
, and
were then fit to functions of the following form:
(3)
Resulting best-fit values of ,
,
, and
for each parameter of
,
, and
are shown in , and were used to generate the modeled kernel functions that form the basis of inverting the measured droplet size distribution to obtain the sampled aerosol size distribution according to EquationEquation (1)
(1) . shows the size-dependent best-fit values of
,
, and
, and the corresponding best-fit functions generated from values in . The inversion algorithm employed in this work obtains solutions for the sampled aerosol distribution by using a package of MATLAB tools that utilize constrained regularization and generalized cross-validation (Hansen Citation2007).
Figure 3. Comparison of best-fit parameter values (open circle) for the analytical kernel function defined in EquationEquation (2)(2) as a function of size for negative, singly charged AS aerosol, with resulting fit (solid line) of EquationEquation (3)
(3) using values in .
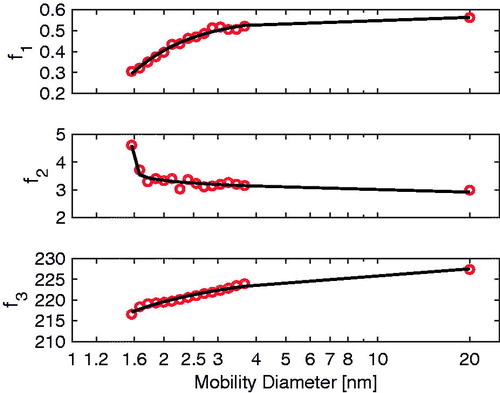
Table 1. Best-fit values of ,
,
, and
to obtain the explicit size-dependence of the parameters
,
, and
according to EquationEquation (3)
(3) .
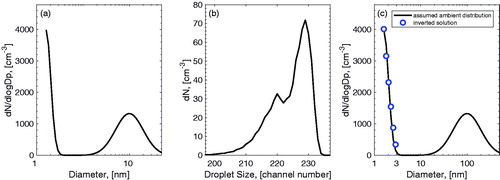
The inversion algorithm was tested numerically by first generating a number of bimodal, lognormal aerosol-size distributions, each containing an Aitken and a nucleation mode with corresponding modal number concentrations, diameters, and standard deviations consistent with what is observed in the atmosphere during a new particle formation event (Kulmala et al. Citation2004; Kuang et al. Citation2010; Seinfeld and Pandis Citation2016), an example of which is shown in . The idealized, “measured” aerosol size distribution in was then converted to a “measured” droplet size distribution according to EquationEquation (1)(1) with the analytical kernel functions defined by EquationEquations (2)
(2) and Equation(3)
(3) , and parameters in . Random noise, up to ±10% of the droplet size distribution
at a particular channel i, was then added to the measured droplet size distribution, which is shown in . The resulting “measured” droplet size distribution was then inverted according to the algorithm described earlier, yielding an inverted aerosol size distribution, which is shown in . The inverted aerosol size distribution agrees reasonably well with the assumed aerosol size distribution below 3 nm, and diverges at larger sizes – there is little sizing information at larger, sampled aerosol sizes since the resulting DEG droplets grow to essentially the same size.
Figure 4. (a) Assumed, idealized multi-modal aerosol size distribution, with a nucleation mode (geometric mean diameter = 1.6 nm, number concentration = 1000 cm−3) and Aitken mode (geometric mean diameter = 100 nm, number concentration = 1000 cm−3), used for numerical testing of inversion algorithm. (b) Droplet size distribution calculated from assumed, idealized distribution in (a), with up to ±10% noise added to the droplet size distribution at each channel. (c) Comparison of assumed ambient distribution (from a) with size distribution obtained from inversion of droplet size distribution (from b).
Limitations
Accurate inversion of atmospheric observations using this technique requires accurate kernel functions, which ideally would be determined from the sampled atmospheric aerosol, itself. This is necessary since the kernel functions are likely sensitive to aerosol composition, charge, and concentration, as well as other environmental parameters that would impact activation and condensational growth inside the CPC such as relative humidity and pressure (Saros et al. Citation1996).
The impact of aerosol composition on this sizing technique cannot be understated, as evidenced by studies that demonstrate a strong dependence of aerosol activation on aerosol composition in DEG-based CPCs (Iida et al. Citation2009; Kuang et al. Citation2012a; Wimmer et al. Citation2013). For a given size, an aerosol with a composition that activates well in a DEG-based CPC will grow to a larger droplet size due to activation at a lower super-saturation, which occurs early in the condenser resulting in a longer residence time for growth. Conversely, an aerosol at the same with a composition that activates poorly will grow to a smaller droplet size due to activation at a higher super-saturation, which occurs late in the condenser resulting in a shorter residence time for growth. While this sensitivity of the droplet size distribution to aerosol composition complicates the measurement of ambient sub 3 nm clusters, it can be used as a powerful tool to provide insights into the composition of sub 3 nm clusters in laboratory and field studies (O'Dowd et al. Citation2002; Citation2004).
Vapor depletion and its impact on shifting the droplet size distribution is a serious issue for pulse height sizing in CPCs. At high enough aerosol number concentrations, the droplet size distribution decreases in size due to a decreased amount of working fluid vapor available for condensation. The effect of vapor depletion on the droplet size distribution for the DEG UF-CPC was examined by measuring the droplet size distributions for a range of concentrations at a number of fixed sizes. Within the concentration range of 2000–10,000 particles/cm3, the largest shift in the droplet size distribution was 1 channel number.
Accurate inversion would be facilitated by the constraints provided by complementary, independent measurements of the aerosol size distribution down to 3 nm. Operationally, long-term, continuous measurement with the DEG UF-CPC would require further instrument modifications to limit working fluid condensation within the optical sensor, and to limit water contamination of the DEG working fluid, which impacts the instrument detection efficiency (Iida et al. Citation2009).
Ambient measurement
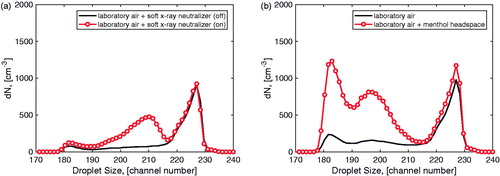
In spite of the limitations described earlier, this cluster sizing technique can be a powerful tool to measure the atmospheric cluster distribution (<3 nm), particularly at low concentrations. presents measurements of the droplet size distribution where the DEG UF-CPC is sampling laboratory air mixed with ions generated by a TSI soft X-ray neutralizer (TSI Model 3088), and laboratory air mixed with vapor sampled from the headspace above solid menthol at room temperature. shows the clear presence of a bimodal droplet size distribution when the soft X-ray neutralizer is turned on and generating ions: the droplet mode larger than channel 215 results from the activation and growth of the ambient Aitken mode aerosol (>20 nm), and the droplet mode below channel 215 results from the activation and growth of the neutralizer ions, which have a modal diameter of 1.2 nm (negatively charged) and 1.5 nm (positively charged), verified by SMPS. shows a dominant droplet mode (>channel 215) when sampling just laboratory air resulting from the activation and growth of the Aitken mode, and a multi-modal droplet size distribution when sampling laboratory air mixed with the vapor from the headspace above solid menthol at room temperature. While further study will be needed to verify the size and the composition of the vapor-phase species that are in equilibrium with solid menthol at room temperature, the results indicate the possibility for the detection and sizing of sub 1 nm, low-volatility, single molecule species.
Figure 5. (a) Droplet size distribution acquired when sampling laboratory air, and when sampling laboratory air mixed with sub-3 nm ions generated by a soft X-ray neutralizer. (b) Droplet size distribution acquired when sampling laboratory air, and when sampling laboratory air mixed with vapor sampled from the headspace above solid menthol at room temperature.
Conclusions
In this work, a commercial UF-CPC ( = 5 nm) was adapted to: utilize DEG as the working fluid; enable direct detection of grown DEG droplets within the instrument optical sensor; and enable detection and sizing of laboratory generated AS aerosol below 3 nm in diameter (
= 1.6 nm). Analytical kernel functions were obtained by fitting to measured droplet size distributions resulting from the activation and growth of AS aerosol of select sizes from 1.5 nm to 20 nm in diameter. Using these kernel functions, an inversion algorithm was developed to obtain the sampled aerosol size distribution from the measured, grown droplet size distribution. Numerical tests of the inversion algorithm with modeled aerosol size distributions representative of observed atmospheric new particle formation yielded a reasonable comparison between the assumed and inverted aerosol size distributions below 3 nm. Because instrument kernel functions are likely sensitive to sampled aerosol composition (and other factors that would impact droplet condensational growth within the DEG UF-CPC), accurate inversion of ambient data requires additional measurement constraints – e.g., independent measures aerosol size distribution down to 3 nm.
Acknowledgments
Generous technical support from Frederik Weiss of Palas is gratefully acknowledged.
Additional information
Funding
References
- Baltzer, S., S. Onel, M. Weiss, and M. Seipenbusch. (2014). Counting Efficiency Measurements for a New Condensation Particle Counter. J. Aerosol Sci., 70:11–14.
- Chen, M., M. Titcombe, J. Jiang, C. Jen, C. Kuang, M. L. Fischer, F. L. Eisele, J. I. Siepmann, D. R. Hanson, J. Zhao, and P. H. McMurry. (2012). Acid–Base Chemical Reaction Model for Nucleation Rates in the Polluted Atmospheric Boundary Layer. Proc. Natl. Acad. Sci., 109:18713–18718.
- de la Mora, J. F., and J. Kozlowski. (2013). Hand-Held Differential Mobility Analyzers of High Resolution for 1–30 nm Particles: Design and Fabrication Considerations. J. Aerosol Sci., 57:45–53.
- Dick, W. D., P. H. McMurry, R. J. Weber, and F. R. Quant. (2000). White-Light Detection for Nanoparticle Sizing with the TSI Ultrafine Condensation Particle Counter. J. Nanopart. Res., 2:85–90.
- Hansen, P. C. (2007). Regularization Tools Version 4.0 for Matlab 7.3. Numer. Algor, 46:189–194.
- Hering, S. V., G. S. Lewis, S. R. Spielman, A. Eiguren-Fernandez, N. M. Kreisberg, C. Kuang, and M. Attoui. (2017). Detection near 1-nm with a Laminar-Flow, Water-Based Condensation Particle Counter. Aerosol Sci. Technol., 51:354–362.
- Iida, K., M. R. Stolzenburg, and P. H McMurry. (2009). Effect of Working Fluid on Sub-2 nm Particle Detection with a Laminar Flow Ultrafine Condensation Particle Counter. Aerosol Sci. Technol., 43:81–96.
- Jiang, J., M. Chen, C. Kuang, M. Attoui, and P. H. McMurry, (2011a). Electrical Mobility Spectrometer Using a Diethylene Glycol Condensation Particle Counter for Measurement of Aerosol Size Distributions Down to 1 nm. Aerosol Sci. Technol., 45:510–521.
- Jiang, J., J. Zhao, M. Chen, F. L. Eisele, J. Scheckman, B. J. Williams, C. Kuang, and P. H. McMurry. (2011b). First Measurements of Neutral Atmospheric Cluster and 1-2 nm Particle Number Size Distributions During Nucleation Events. Aerosol Sci. Technol., 45:2–5.
- Kangasluoma, J., C. Kuang, D. Wimmer, M. P. Rissanen, K. Lehtipalo, M. Ehn, D. R. Worsnop, J. Wang, M. Kulmala, and T. Petäjä. (2014). Sub-3 nm Particle Size and Composition Dependent Response of a Nano-CPC Battery. Atmos. Meas. Tech., 7:689–700.
- Kerminen, V. M., H. Lihavainen, M. Komppula, Y. Viisanen, and M. Kulmala. (2005). Direct Observational Evidence Linking Atmospheric Aerosol Formation and Cloud Droplet Activation. Geophys. Res. Lett., 32:L14803.
- Kirkby, J., J. Curtius, J. Almeida, E. Dunne, J. Duplissy, S. Ehrhart, A. Franchin, S. Gagné, L. Ickes, and A. Kürten. (2011). Role of Sulphuric Acid, Ammonia and Galactic Cosmic Rays in Atmospheric Aerosol Nucleation. Nature, 476:429.
- Kuang, C., M. Chen, P. H. McMurry, and J. Wang. (2012a). Modification of Laminar Flow Ultrafine Condensation Particle Counters for the Enhanced Detection of 1 nm Condensation Nuclei. Aerosol Sci. Technol., 46:309–315.
- Kuang, C., M. Chen, J. Zhao, J. Smith, P. H. McMurry, and J. Wang. (2012b). Size and Time-Resolved Growth Rate Measurements of 1 to 5 nm Freshly Formed Atmospheric Nuclei. Atmos. Chem. Phys., 12:3573–3589.
- Kuang, C., P. H. McMurry, and A. V. McCormick. (2009). Determination of Cloud Condensation Nuclei Production from Measured New Particle Formation Events. Geophys. Res. Lett., 36:L09822.
- Kuang, C., I. Riipinen, S. L. Sihto, M. Kulmala, A. V. McCormick, and P. H. McMurry. (2010). An Improved Criterion for New Particle Formation in Diverse Atmospheric Environments. Atmos. Chem. Phys., 10:8469–8480.
- Kulmala, M., H. Vehkamäki, T. Petäjä, M. Dal Maso, A. Lauri, Kerminen, V. M., W. Birmili, and McMurry, P. H. (2004). Formation and Growth Rates of Ultrafine Atmospheric Particles: A Review of Observations. J. Aerosol Sci., 35:143–176.
- Lihavainen, H., Kerminen, V. M., M. Komppula, J. Hatakka, V. Aaltonen, M. Kulmala, and Y. Viisanen. (2003). Production of “Potential” Cloud Condensation Nuclei Associated with Atmospheric New-Particle Formation in Northern Finland. J. Geophys. Res., 108:8.
- Marti, J., R. Weber, M. Saros, J. Vasiliou, and P. McMurry. (1996). Modification of the TSI 3025 Condensation Particle Counter for Pulse Height Analysis. Aerosol Sci. Technol., 25:214–218.
- Mirme, S., and A. Mirme. (2013). The Mathematical Principles and Design of the NAIS – A spectrometer for the Measurement of Cluster Ion and Nanometer Aerosol Size Distributions. Atmos. Meas. Tech., 6:1061–1071.
- O'Dowd, C. D., P. Aalto, K. Hameri, M. Kulmala, and T. Hoffmann. (2002). Aerosol Formation: Atmospheric Particles from Organic Vapours. Nature, 416:497–498.
- O'Dowd, C. D., P. P. Aalto, Y. J. Yoon, and K. Hämeri. (2004). The Use of the Pulse Height Analyser Ultrafine Condensation Particle Counter (PHA-UCPC) Technique Applied to Sizing of Nucleation Mode Particles of Differing Chemical Composition. J. Aerosol Sci., 35:205–216.
- Saros, M. T., R. J. Weber, J. J. Marti, and P. H. McMurry. (1996). Ultrafine Aerosol Measurement Using a Condensation Nucleus Counter with Pulse Height Analysis. Aerosol Sci. Technol., 25:200–213.
- Scheibel, H. G. (1983). Generation of Monodisperse Ag-and NaCl-Aerosols with Particle Diameters Between 2 and 300 nm. J. Aerosol Sci., 14:113–126.
- Seinfeld, J. H., and S. N. Pandis. (2016). Atmospheric Chemistry and Physics: From Air Pollution to Climate Change. Hoboken, NJ: John Wiley & Sons.
- Sipilä, M., K. Lehtipalo, M. Attoui, K. Neitola, T. Petäjä, P. P. Aalto, C. D. O'Dowd, and M. Kulmala. (2009). Laboratory Verification of PH-CPC's Ability to Monitor Atmospheric Sub-3 nm Clusters. Aerosol Sci. Technol., 43:126–135.
- Spracklen, D. V., K. S. Carslaw, M. Kulmala, V. M. Kerminen, S.-L. Sihto, I. Riipinen, J. Merikanto, G. W. Mann, M. P. Chipperfield, A. Wiedensohler, W. Birmili, and H. Lihavainen. (2008). Contribution of Particle Formation to Global Cloud Condensation Nuclei Concentrations. Geophys. Res. Lett., 35:L06808.
- Stolzenburg, M. R., and P. H. McMurry. (1991). An Ultrafine Aerosol Condensation Nucleus Counter. Aerosol Sci. Technol., 14:48–65.
- Ude, S., and J. F De la Mora. (2005). Molecular Monodisperse Mobility and Mass Standards from Electrosprays of Tetra-Alkyl Ammonium Halides. J. Aerosol Sci., 36:1224–1237.
- Vanhanen, J., J. Mikkilä, K. Lehtipalo, M. Sipilä, H. E. Manninen, E. Siivola, T. Petäjä, and M. Kulmala. (2011). Particle Size Magnifier for Nano-CN Detection. Aerosol Sci. Technol. 45:533–542.
- Weber, R. J., M. R. Stolzenburg, S. N. Pandis, and P. H. McMurry. (1998). Inversion of Ultrafine Condensation Nucleus Counter Pulse Height Distributions to Obtain Nanoparticle (3–10 nm) Size Distributions. J. Aerosol Sci., 29:601–615.
- Wimmer, D., K. Lehtipalo, A. Franchin, J. Kangasluoma, F. Kreissl, A. Kürten, A. Kupc, A. Metzger, J. Mikkilä, and T. Petäjä. (2013). Performance of Diethylene Glycol-Based Particle Counters in the Sub-3 nm Size Range. Atmos. Meas. Tech., 6:1793.