
Abstract
A water condensation-based ion charging system has been developed to enhance both the charging efficiency and the concentration of sub-20 nm particles. This NanoCharger consists of a bipolar ion source followed by a parallel plate water-based condensation system, an embedded ion scavenger, and an aerodynamic focusing stage. Sufficient numbers of ions are transported through the system to attach to the formed droplets. An ion scavenger removes the ions immediately after the droplet formation to minimize multiple charging. A subsequent cold-walled condensation stage removes most of the water vapor, lowering the dew point to below 16 °C, while a set of focusing nozzles concentrates the droplets into ∼10% of the flow. The flow is then slightly heated to evaporate the droplets. The physical enhancement of electrical charging was evaluated in the laboratory using mobility-selected particles, and found to provide ∼40-fold enhancement over bipolar charging for 6–15 nm particles. Chemical artifacts were evaluated through thermal desorption chemical ionization mass spectrometry. Data comparing ion spectra for flow that passed through the NanoCharger to that obtained without it showed nearly equivalent ion spectra, indicating that no significant artifacts were introduced from the condensation–evaporation process.
Copyright © 2018 American Association for Aerosol Research
EDITOR:
Introduction
One of the important questions in elucidating the role of atmospheric particles in global climate is chemical pathway by which nanometer-sized particles grow to sufficient size to become cloud condensation nuclei. These nanoparticles, which may be directly emitted through various sources or formed through atmospheric nucleation processes, are the most abundant by number, even though they comprise a small fraction of the aerosol mass. When their growth rates are high relative to depletion, these nanoparticles can become cloud condensation nuclei (Kulmala et al. Citation2004; Kerminen et al. Citation2005; Laaksonen et al. Citation2005; Stolzenburg et al. Citation2005; Iida et al. Citation2008; Kuang, McMurry, and McCormick Citation2009), and thereby can affect the physical characteristics and lifetime of clouds. This in turn affects radiation balances and precipitation, both of which are important components of climate dynamics.
A key question is what chemical mechanisms contribute to this growth. The challenge is not only one of chemical sensitivity, but efficient, size-selective sampling. Because most of the atmospheric aerosol mass is associated with larger particles, chemical assays in the nanometer range mandates the absolute exclusion of all larger particles from the sample. The Thermal Desorption Chemical Ionization Mass Spectrometer (TDCIMS) (Voisin et al. Citation2003; Smith et al. Citation2005, Citation2008, Citation2010) uses electrical mobility size-classification to sample nanoparticles over a narrow size range. A unipolar charger, combined with low-resolution electrostatic classification, allows the delivery of size-selected, electrically charged nanoparticles to the TDCIMS metal filament collector (McMurry et al. Citation2009). Unlike impactors, where bounce of just a few large particles would likely contaminate nanoparticle samples, the mobility separation does not allow penetration of any less-mobile (i.e. large) particles.
While effective in excluding larger particles, electrical mobility classification is inefficient for nanoparticles. In the nanometer size range of interest, only a small fraction of particles is charged. For instance, bipolar charging efficiency is 5% at 10 nm and only 2% at 5 nm. Unipolar sources give 25% charging at 10 nm, decreasing to 4% at 5 nm, and is less efficient than bipolar charging below 3.5 nm (Jiang et al. Citation2011). Several investigators have explored the use of condensationally enhanced particle charging, wherein the particles above 10 nm are grown through condensation, charged and re-evaporated (Suh et al. Citation2005; Kim et al. Citation2006; Choi and Kim Citation2007; Han et al. Citation2008), but these methods produce high charging levels, of the order of 100 charges per particle, and thus are not suitable for mobility size-selection.
The objective of the research reported here is the development of a more efficient nanoparticle charger that produces predominantly singly charged particles, with minimal alteration of their chemical composition. Our approach uses a laminar-flow, water condensation growth system incorporating a bipolar ion source, ion scavenger, aerodynamic concentrator and droplet evaporator. The aerosol sample rate is 15 L min−1, and the output flow into which the aerosol is focused after growth and charging, is 1.5 L min−1. Through use of the “moderated” growth tube approach of Hering, Spielman, and Lewis (Citation2014), particles as small as 5 nm are activated to form droplets, while the water content of the output flow is subsaturated at typical laboratory temperatures (dew point <16 °C).
Several studies have shown chemical artifacts associated with condensation-based particle concentrators (Khlystov et al. Citation2009; McWhinney et al. Citation2012), while others indicate that these artifacts are minimal (Ning et al. Citation2006). With our approach we try to minimize these artifacts both by limiting the temperatures to which the aerosol is exposed, and limiting the residence time in the droplet phase. Yet, the extent of chemical artifacts could only be tested experimentally. Reported here is both the physical and chemical characterization of this system, including characterization of its charging and concentration efficiency with laboratory test aerosols, and the assessment of the extent of chemical artifacts via mass spectrometry.
Experimental methods
Instrument description
The nanoparticle charging system consists of an ion source coupled to a condensational growth tube equipped with ion scavenger, aerodynamic focusing stage, and evaporator. As illustrated in , the aerosol sample stream passes through the ion source, and both ions and aerosol are introduced into the growth tube region. Particles are enlarged through water condensation using the moderated approach described by Hering, Spielman, and Lewis (Citation2014). The initial “conditioner” section has cold walls to cool the flow. The second “initiator” stage is a short, wet-walled, warmed section that creates the supersaturation and initiates particle growth. This is immediately followed by a slightly warmer, dry-wall “ion scavenger” to remove unattached ions. The subsequent “moderator” stage has cooled walls that reduces both the temperature and the water vapor concentration. This is followed by a set of aerodynamic focusing nozzles to concentrate the droplets into the central portion of the flow. This core flow is extracted and passes through a set of warmed channels to slow the flow and evaporate the droplets.
Figure 1. Schematic of the NanoCharger system, including ion source, and NanoCharger with growth tube, ion scavenger, and concentrator/evaporator.
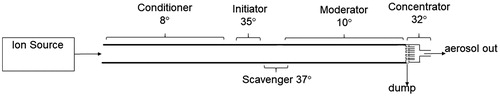
For simplicity, we refer to the growth tube – concentrator – evaporator as the “NanoCharger,” even though no charge enhancement is provided unless it is operated in conjunction with an upstream ion source. Although initial experiments of the water condensation-charging concept were explored with a tubular geometry, the NanoCharger presented here uses a parallel plate geometry, because this geometry is more readily scaled to higher flows. Total flow is 15 L min−1, and the exiting concentrated aerosol flow is 1.5 L min−1. Sizing of the system components comprising the NanoCharger is based on finite element calculations performed using the Comsol Multiphysics numerical modeling program. Overall system dimensions, excluding the ion source, are 100 × 50 × 500 mm in height, width, and length. The gap between the parallel plates, which forms the channel through which the aerosol flows, is 3.1 mm, and the channel height (the dimension into the paper in ) is 61 mm. The length of the conditioner, initiator, ion scavenger, and moderator sections are 183, 61, 23, and 120 mm, respectively. Details of construction are shown in the online supplementary information (SI).
The walls of the conditioner, initiator and moderator sections are composed of pairs of sealed panels lined on the air channel face with stainless-steel fiber filter wicks. Each panel section, six in total, are continuously wetted via a siphon method whereby water in the space behind the wicks is held at reduced pressure to prevent mass water flow across the wick but still allow the transport of water vapor. Heating and cooling for the three wet stages is applied externally via heat exchangers to the circulating wick water, which flows continuously at about 1 L min−1 using dedicated water pumps. Inline activated carbon water filters are used to remove dissolved organics that may build-up over time. To provide a cleanable system, all of the components exposed to the aerosol are made of stainless steel, with the removable wall panels fabricated with the stainless-steel filtration material welded to a frame with integrated water ports. Typical operating temperatures of these wet-walled sections are 8 °C, 35 °C, and 10 °C, respectively. The ion scavenger, located between the initiator and moderator stages has dry, stainless-steel walls to which a small voltage difference (5–30 V) can be applied to scavenge charging ions. The scavenger is heated typically to 37 °C, slightly warmer than the initiator to avoid condensation. For this geometry, and at these temperatures, numerical modeling shows that the centerline reaches a saturation ratio of 1.4, and for 70% of the flow, the peak saturation is greater than 1.3. At the exit of the moderator stage, the flow is still supersaturated (S = 1.08 at centerline), but because the flow has been cooled the water content is reduced to a dew point of less than 16 °C.
The final “concentrator” stage serves to both concentrate and warm the aerosol. It consists of a single row of eight circular focusing nozzles, evenly spaced at the exit of the channel, as shown in the SI. Each nozzle has a stepped profile (1.60 and 0.94 mm diameters). Within the narrow portion the flow is split into “side” and “core” flow streams, with 90% of the flow carried by the side flow stream which exits through a 0.1 mm gap in the side wall of the nozzle. The droplets exiting the growth region are aerodynamically focused into the “core” flow (De La Mora and Riesco-Chueca Citation1988; Fuerstenau, Gomez, and Fernández de la Mora Citation1994), providing ∼10:1 air-to-air concentration. The core flow from each nozzle is carried through a 23 mm long, 2.0 mm diameter channel to allow the flow to slow, and the droplets to evaporate, before being joined together in the exit tube. The focusing nozzles and downstream core-flow channels are heated to 32 °C.
Evaluation of charging and concentration efficiency
The particle concentration enhancement and charge distribution were evaluated using a tandem differential mobility system using both sulfate and metal oxide particles as shown in . Sulfate was generated via atomization (Topas atomizer with dry dilution air) with bipolar ion conditioning, and charged metal oxide aerosol was generated using a heated nichrome wire. Test aerosols were size classified with a nano differential mobility analyzer (model 3085, DMA#1, TSI, Inc., St. Paul, MN, USA) operated with dry sheath flow at 15 L min−1. The 1.5 L min−1 output is mixed with 14.5 L min−1 of partially humidified (RH∼40%), filtered house air with a vent to atmosphere. The combined flow is pulled through a mixing tube, through a bipolar ion source (either a TSI model 3087 soft X-ray or home-built 210Po-based aerosol neutralizer with a 10- to 14-month old 500µCi source), and into the NanoCharger. In the concentrator stage the flow is split into a 14.5 L min−1 “side flow” and the 1.5 L min−1 core flow containing the majority of the aerosol. For some experiments, the core flow passed through a postheater consisting of a 50 cm-long 50 °C coiled metal tube. This core flow is delivered to a second mobility sizing system consisting of a nano-DMA column (model 3085, DMA#2, TSI, Inc.) operated with a dry 15 L min−1 sheath, and a TSI model 3787 water condensation particle counter. NanoCharger operating temperatures were 8 °C, 35 °C, 37 °C, 10 °C, and 32 °C for the conditioner, initiator, ion scavenger, moderator and concentrator-evaporator, respectively.
Figure 2. (a) Tandem DMA setup for testing NanoCharger using a downstream water CPC switched between conditioned and bypass lines. (b) Experimental setup for assessing potential for chemical artifacts.
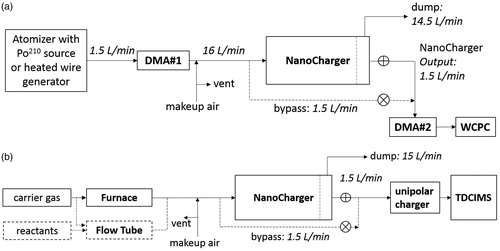
Upstream measurements are made by sampling through the bypass line that diverted 1.5 L min−1 of the flow at the inlet of the growth tube, while maintaining the 14.5 L min−1 side flow, and closing the concentrated output flow. Downstream measurements examined the mobility distribution of aerosol in the exiting core flow. Measurements were made with, and without, passing through the NanoCharger ion source, with varying voltages applied to the ion scavenger.
Evaluation of potential for chemical artifacts
Experiments were performed with the NanoCharger in order to assess the likelihood that chemical artifacts may be introduced into sampled aerosol during typical laboratory or field use. These investigations were comparative experiments, whereby particles that were concentrated and charged with the NanoCharger were compared to those that bypassed the NanoCharger. In both instances, measurements were performed of the molecular composition of generated nanoparticles using the Thermal Desorption Chemical Ionization Mass Spectrometer (TDCIMS). TDCIMS uses low-resolution electrostatic classification (McMurry et al. Citation2009) to select nanometer-sized charged particles, electrostatic precipitation to collect this fraction on a metal filament, and resistive heating to desorb the chemical constituents from the filament and into the gas phase. TDCIMS then performs soft chemical ionization of the desorbed gases from nanoparticulate samples using either protonated water clusters (“positive ion mode,” which is sensitive to bases and oxygenated and unsaturated organics) or solvated O2− anion (“negative ion mode,” which is sensitive to inorganic and organic acids), which are performed sequentially to obtain a comprehensive representation of particle composition. A High-resolution Time-of-Flight mass spectrometer (Tofwerk AG, Thun, Switzerland) allows an elemental analysis of ions in the mass spectra. Changes in the TDCIMS-derived mass spectra between particles that were sampled into the NanoCharger and particles that bypassed it were examined for evidence of uptake or loss of compounds that would indicate chemical artifacts.
Two experiments were performed to study potential chemical artifacts that could arise due to aerosol uptake of gas-phase contaminants. This was done by comparing the composition of laboratory-generated aerosol with and without the use of the NanoCharger. In the first experiment, 20 nm aerosol was generated by heating solid ammonium sulfate in a furnace with a flow of clean humidified air (Aadco), and particles were collected for 1 min before analysis. Possible sources of contaminants included the apparatus itself, the “clean” air, and the deionized water used for humidification. The second experiment used 25 nm diameter secondary organic aerosol (SOA) nanoparticles nucleated from the ozonolysis of α-pinene. Potential gas-phase contaminants were expected to originate from the α-pinene oxidation. For this experiment, aerosol was sampled for 20 min on bypass and 5 min via the NanoCharger to better match total signal intensities. In both experiments, the TDCIMS alternately sampled upstream of, and through, the nanocharger condensation system, as shown in . The unipolar charger placed upstream of the TDCIMS is required for the electrostatic collection in the TDCIMS.
Results
Modeling results
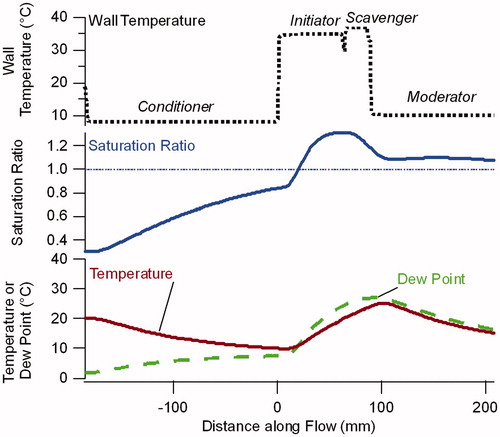
The dimensions of the NanoCharger, specifically the length of each section, were selected using numerical calculations of the saturation, temperature, and dew point profiles. Calculated values for the center plane between the two parallel plates are shown in for the final system configuration are shown in . The four sections of the condensational growth/scavenger are defined by the wall temperature, shown in the top panel. The saturation ratio increases in the initiator, and then remains above 1, even as the flow passes through the ion scavenger and moderator sections. These profiles indicate how difficult it is to dry the aerosol once the condensational growth has been initiated. Cooling the flow, as done in the moderator, lowers the water vapor pressure, but maintains supersaturated conditions, and thus the droplets do not evaporate. Hot, dry walls do indeed lead to droplet evaporation, but as the modeling results for the scavenger section indicate, this does not happen rapidly. These types of calculations led us to the conclusion that wall temperature alone was not sufficient to rapidly evaporate the droplets once formed. Thus, to reduce multiple charging, we introduced the ion scavenger to remove ions immediately after droplets are formed in the initiator section.
Figure 3. Model calculations of the saturation ratio, temperature and dew point in the center of the flow for the NanoCharger, with wall temperatures for the conditioner, initiator, scavenger and moderator of 8 °C, 35 °C, 37 °C, and 10 °C, respectively.
Particle concentration
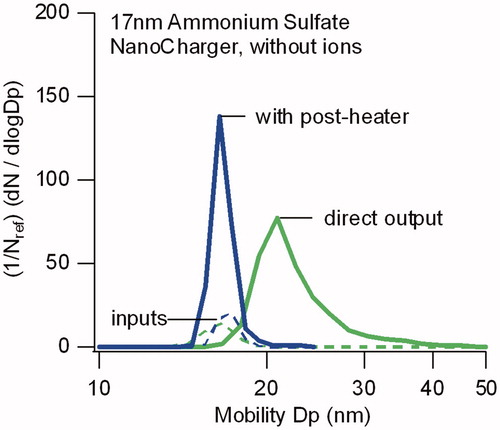
The effectiveness of the NanoCharger as a concentrator only, without charge enhancement, was evaluated in experiments conducted without the introduction of ions after DMA#1, that is, with the soft X-ray ion source of turned off. In this configuration, all particles entering the NanoCharger carry an electrical charge. This configuration tests both size recovery, as well as the concentration enrichment from the growth tube. As shown in , we found considerable enhancement in concentration, but the size recovery for pure ammonium sulfate aerosol particle was not complete. For the 17 nm ammonium sulfate shown, the NanoCharger output size distribution broadened, and the peak particle diameter increased to 21 nm. Passing the aerosol through a 50 °C postheater downstream of the NanoCharger returned the particles to their original size. The heating temporarily reduces the relative humidity, and the size recovery is consistent with that for a dry ammonium sulfate particle that has deliquesced at high humidity, but has not yet lost its water (effloresced).
Figure 4. Comparison of particle size distributions for 17 nm sulfate particles directly exiting the NanoCharger, and after passing through a 50 °C postheater. In both instances data are obtained without an ion source. Distributions are normalized by the input size distribution number concentration.
Data from three runs with this “post-heater” are shown in . For particle sizes from 6 to 20 nm, the particle size recovered within the 10% resolution of these measurements. For the larger two particle sizes the concentration enrichment is 8.5 ± 1.5, whereas the flow split for these experiments was 10:1. What appears to be a trend toward greater enrichment at smaller particle sizes may be an artifact of the measurements, as no correction was made for transport losses in the bypass line.
Figure 5. Comparison of input and output particle size distributions for operation of the NanoCharger without an ion source, and with postheater. Enrichment in particle concentration is due to the NanoCharger concentrator stage.
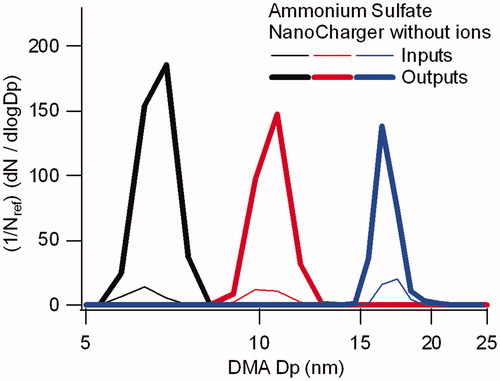
Particle charging
The combined effects of particle charging and aerodynamic concentration are shown in . Comparison is made between the particle mobility distributions of near-monodisperse, 10 nm particles immediately before entering the condensational growth section, and downstream of the NanoCharger. The mobility distributions are displayed in terms of the equivalent single-charged particle diameter at the selected mobility. Thus, the abscissa is a function of the inverse mobility such that singly charged particles appear at their nominal diameter, while more highly charged particles appear at smaller single-charge equivalent mobility diameters. The data are normalized by the number concentration of positively charged particles immediately downstream of the bipolar ion source, before entering the NanoCharger.
Figure 6. Single-charge equivalent mobility distribution for 10 nm ammonium sulfate particles exiting the NanoCharger operated with a soft X-ray bipolar ion source upstream. Distributions are normalized with respect to the bypass line, which sampled the aerosol downstream of the ion source, before entering the NanoCharger. Singly charged particles appear at the selected mobility size, multiply charged particles appear at smaller mobility diameters. Charge level for each peak is noted. Application of voltage to the ion scavenger reduces multiply charged particles.
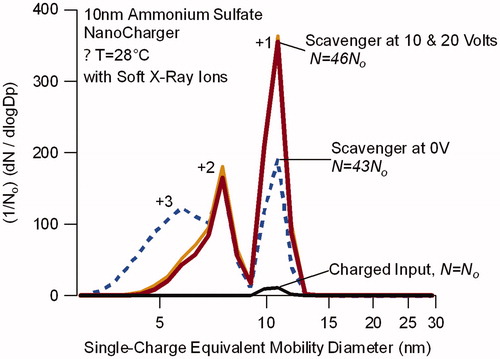
First, we note that most particles entering the NanoCharger no longer carry the charge with which they exited DMA#1. At 10 nm, the total number concentration for the upstream aerosol concentration with the X-Ray source turned on is 9% of that measured with the X-Ray source turned off. This fraction is higher than the ∼4% predicted from Fuchs theory, likely due to the higher than manufacture-specified flow rates through the soft X-ray source (As shown in , the flow through the ion source is 15 L min−1, whereas the highest recommended flow for charge conditioning is 7 L min−1). Nonetheless, the data show that the majority of the particles carry no charge before entering the growth section.
Second, we see that the total concentration of charged particles exiting the NanoCharger is more than 40 times that which entered, and is 5 times larger than can be attributed to the 8.5 concentration factor from the concentrator alone. The introduction of bipolar ions together with the aerosol increases the positively charged fraction to 38% of the total particle concentration, as determined by comparison to the data with the X-Ray source turned off. Although one expects rapid scavenging of the bipolar ions in the conditioner section of the NanoCharger, it is apparent that sufficient numbers of ions reach the condensational growth region to enhance the particle charging. It is also apparent that the particles retained their charge upon evaporation of the droplets.
Third, the data show that the ion scavenger affects the charge distribution. Without voltage applied to the ion scavenger, many particles are multiply charged, appearing as distinct mobility modes at smaller single-charge equivalent mobility diameters (marked by “+2,” “+3”). The level of charging observed, and distribution between singly and multiply charged particles, is consistent with that expected for steady state charging of particles in the 0.4 µm size range. Application of either 10 or 20 V potential across the dry-walled ion scavenger located immediately after the initiator section reduces the numbers of multiply charged particles, while increasing those that are singly charged. This is seen by comparing the heavy solid and dashed lines of . With the scavenger voltage, 60% of the positively charged particles carried a single charge, compared to 30% without.
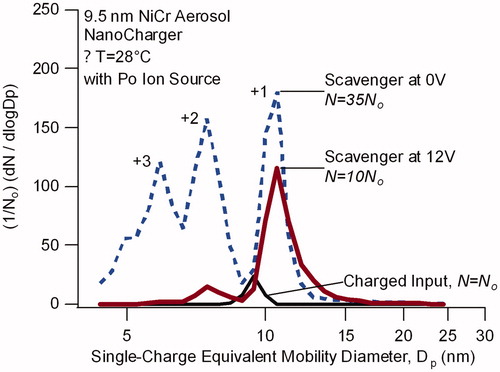
Similar results are found with aerosol generated from a heated nichrome (NiCr) wire. Example data, shown in , were obtained using a 210Po bipolar ion source placed immediately upstream of the NanoCharger. At 9.5 nm the singly charged aerosol exiting the NanoCharger was a factor of 35 more concentrated than in the bypass line (which sampled between the 210Po ion source and the NanoCharger). However, in contrast to what was observed above, ion scavenger reduced the overall concentration of the charged particles. The scavenger also reduced the multiple charging such that the particles carrying +1 charge increased from 33% to 90% of all positively charged particles. The apparent increase in particle size is not understood.
Figure 7. Single-charge equivalent mobility distribution for mobility-selected nichrome wire generated particles after passing through a 210Po bipolar ion source (charged input) and after subsequently passing through the NanoCharger (colored lines). Input particle size is 9.5 nm. Distributions are normalized with respect to the line bypassing the NanoCharger (labeled charged input). NanoCharger conditioner and initiator are at 8 °C and 35 °C.
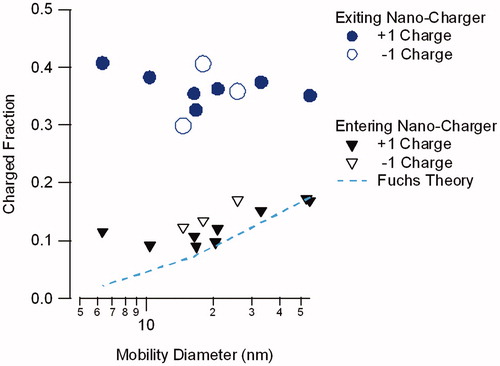
summarizes data for runs with initial particle sizes between 6 and 50 nm, obtained with the NanoCharger coupled to the soft X-ray ion source. These data are for ammonium sulfate particles for both positive and negative polarity, and were obtained at different times over the course of a one-year period. Shown are ratios between the flux of charged particles exiting the NanoCharger when operated with the ion source on, to that with the ion source off. As all particles exiting DMA#1 are charged, the data with the ion source off gives the total particle concentration exiting the NanoCharger. With the ion source on, only particles of selected charge polarity are detected. This flux comparison ignores the concentration enhancement from the aerodynamic focusing. Each point corresponds to a single set of runs. The data show the fraction of singly charged particles of the selected polarity is 36% ± 4% of all aerosol, independent of input particle size and polarity. With the same charging efficiency for either positive or negative polarity, the data indicate that ∼70% of the aerosol carries either +1 or −1 charge. By comparison, the fraction of charged particles of the selected polarity entering the NanoCharger is 9%–17%, increasing with particle size as expected. The increased charging efficiency from the NanoCharger is most pronounced at the smaller sizes, where bipolar charging is least efficient.
Figure 8. Fraction of ammonium sulfate particles exiting, and entering the NanoCharger that carry either +1 or –1 electrical charge.
summarizes the charged particle concentration enhancement from the combined effects of aerodynamic focusing and droplet charging in the sub-20 nm size range, as well as that from aerodynamics focusing alone. Data are shown with, and without, voltage applied to the ion scavenger, and are for positively charged particles only (for which the data set is most complete).
Table 1. Particle concentration ratios for the NanoCharger.
For the soft X-ray ion source with ammonium sulfate aerosol, the concentration of charged particles increases by a factor of 40. The ion scavenger shifts the charge distribution, giving more singly charged particles, without affecting the total concentration of charged particles. For the Po210 ion source and the nichrome wire aerosol, the fraction of particles carrying +1 charge is higher, but the ion scavenger reduced the enhancement in the concentration of charged particles from 40 to 20. In summary, the data show that the NanoCharger approach enhances overall charging efficiency, and that the use of the ion scavenger shifts the charge distribution toward singly charged particles.
Chemical characterization
A key question in the utility of the condensation enhanced particle charging is the extent of chemical artifacts, especially as may be relevant to atmospheric systems. To evaluate the potential for chemical artifacts, laboratory experiments were conducted using two types of seed aerosols: ammonium sulfate and particles formed from the ozonolysis of α-pinene. These were mixed with a source of condensable vapors, and the final chemical composition measured before, and after the NanoCharger using the TDCIMS.
Chemical analyses with ammonium sulfate aerosol
Ammonium sulfate nanoparticles generated in a furnace were mixed into humidified zero air for this contamination test of the NanoCharger. No gas-phase contaminants were purposefully added, but based previous experience, ammonia and oxidized nitrogen species can appear in otherwise clean spectra. This test served to identify any major sources of contamination within the apparatus itself.
and summarize the TDCIMS-derived chemical composition in negative ion mode for 20 nm diameter ammonium sulfate nanoparticles as they passed through the NanoCharger compared to the bypass. shows a representative negative ion mass spectrum of the NanoCharger-exposed aerosol and shows the same for the bypass aerosol. Total background-corrected integrated ion counts are reported for each high-resolution fitted ion. is a Kendrick mass defect analysis of the mass spectra (Junninen et al. Citation2010). Each plot shows four individual samples, two with the NanoCharger-exposed particles (green angled lines) and two via the Bypass (black horizontal and vertical lines). Ions that appear in both Bypass runs, or in both NanoCharger runs are plotted in ; the length of the line is the average of the two signals. If an ion appears in both NanoCharger runs and not in the Bypass runs (only a green cross), this is an indication that the ion appears from a chemical artifact in the NanoCharger-exposed particles. A “good result,” by contrast, would be ions that have similarly sized markers for all four runs (a green and black star symbol). shows the correlation between ion intensity for ions that were detected in both NanoCharger-exposed and bypass aerosol.
Figure 9. Representative TDCIMS negative ion mass spectra of 20 nm diameter ammonium sulfate aerosol particles charged with the nanocharger (a) and bypassing the nanocharger (b).
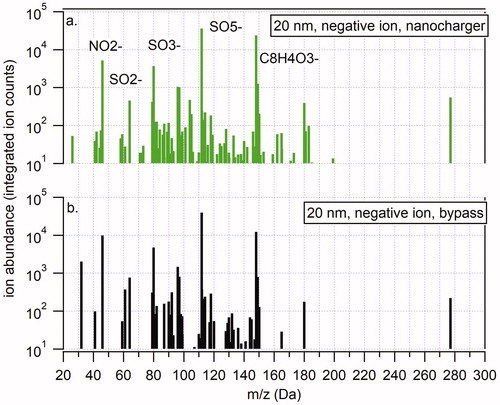
Figure 10. Analysis of 20 nm diameter ammonium sulfate negative ion mass spectra. (a) Kendrick mass defect analysis of nanocharger-exposed (green) and bypass aerosol mass spectra. Symbol size corresponds to ion intensity. (b) Correlation between nanocharger-exposed ion abundance and bypass aerosol ion abundance.
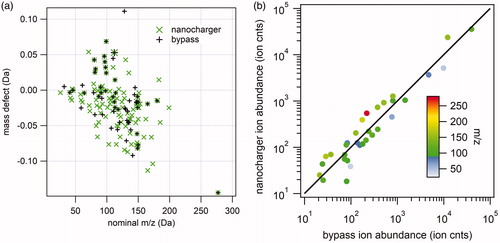
In general, more ion peaks were detected for the NanoCharger-exposed aerosol although in most cases the additional peaks were relatively low in intensity. One exception is phthalic anhydride, C8H4O3−, which appears in both NanoCharger-exposed and bypass aerosol but it more intense in the NanoCharger-exposed particles. Phthalic anhydride is a common constituent of plastics and is often seen as a background ion in TDCIMS negative ion mass spectra. Following these experiments, we noticed a steady decrease in phthalic anhydride and its eventual disappearance from both the Bypass and NanoCharger mass spectra. This observation indicates that there was no significant internal source of this compound and that the carbon filters used to clean the water as it circulated through the instrument were operating as designed. No significant enhancement of nitrate ion was observed in the NanoCharger spectra.
TDCIMS-derived chemical composition in positive ion mode for 20 nm diameter ammonium sulfate particles leads to the same overall conclusion (not shown). For the negative ions: NanoCharger-exposed particles appear to take up more vapors compared to bypass particles, but those species taken up in the NanoCharger are relatively minor compared to the major ions. In the case of positive ion mode, the major ions were water clusters of ammonium (H2O)NH4+ and (H2O)2NH4+, and in addition several ions that indicate some nitrogen-containing organic impurities in the generated nanoparticles that appear in equal amounts in both NanoCharger-exposed and Bypass aerosol. The ammonium ions were, in fact, 6% less intense in the NanoCharger-exposed particles compared to the Bypass particles. One possible explanation for this is that ammonia may have evaporated from aqueous droplets inside the NanoCharger (Benoit Citation1961).
Chemical analyses with SOA
Chemical artifacts were investigated using 25 nm diameter SOA nanoparticles nucleated from the ozonolysis of α-pinene. Earlier investigations by the TDCIMS found that 20 nm diameter nanoparticles derived from α-pinene ozonolysis contain a large fraction of multifunctional carboxylic acids (Winkler et al. Citation2012), many of which are likely to be at least partially water soluble. By combining the results from these studies of possible artifacts from a purely organic system with those discussed above from an inorganic system, we hope to span a range of conditions that might typically be used with the NanoCharger. Using the flow reactor of , α-Pinene (400 ppb) was mixed with ozone (2 ppm) and clean air (“zero air”). Nanoparticles exited the flow reactor together with semi-volatile vapors, both of which were formed from this chemical system. These semivolatile compounds were the source of condensable vapors. The NanoCharger was operated under normal flow and temperature conditions but without an ion source, so that sampled particles nucleate water droplets and then evaporate as they exit the charger.
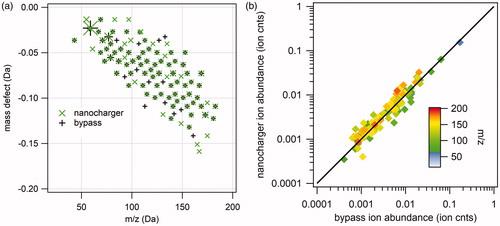
Due to the complexity of the high-resolution mass spectra, in which several ions often appear at the same nominal mass, we show only the Kendrick mass defect analysis and correlation diagram for the negative ion () and positive ion () mass spectra of NanoCharger-exposed and bypass 25 nm diameter α-pinene SOA nanoparticles. In negative ion mode, 370 individual peaks were observed in the mass spectra for both replicate experiments of NanoCharger-exposed aerosol, compared to 209 individual peaks for the bypass aerosol. In positive ion mode, the number of individual peaks were approximately equal: 166 for NanoCharger-exposed particles compared to 142 for bypass. These observations support the statement made above that negative ion mode is sensitive to water-soluble organic compounds with carboxylic acid moieties. As in the case of the ammonium sulfate experiments, the ion abundance correlation diagrams ( and ), in which the data span ∼5 orders of magnitude, show good agreement between the measured ion abundance of NanoCharger-exposed and bypass aerosol and no systematic bias either in the enrichment or the depletion of ions caused by the NanoCharger.
Figure 11. Analysis of 25 nm diameter α-pinene SOA negative ion mass spectra. (a) Kendrick mass defect analysis of nanocharger-exposed (green) and bypass aerosol mass spectra. Symbol size corresponds to ion intensity. (b) Correlation between nanocharger-exposed ion abundance and bypass aerosol ion abundance.
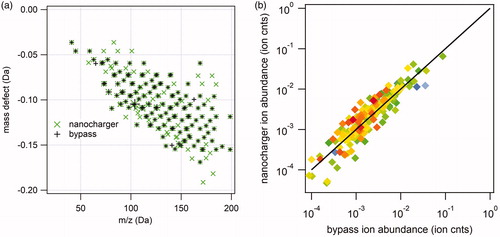
Figure 12. Analysis of 25 nm diameter α-pinene SOA positive ion mass spectra. (a) Kendrick mass defect analysis of nanocharger-exposed (green) and bypass aerosol mass spectra. Symbol size corresponds to ion intensity. (b) Correlation between nanocharger-exposed ion abundance and bypass aerosol ion abundance.
Summary
In summary, for 6–20 nm particles, the NanoCharger system, operated with a bipolar ion source, provides enhancement of a factor of 40 ± 5 in the total charged particle fraction. Further, incorporation of an ion scavenger minimizes multiple charging, such that the singly charged particles dominate. However, there is scatter in the extent of charge enhancement, and after condensational growth the particles did not completely recover their initial size. One suspects the size shift may be due to residual water associated with the particle, but this was not verified. Yet measurements with the TDCIMS demonstrate that the chemical composition of sampled nanoparticles are not greatly affected by the NanoCharger. Initial investigations with ammonium sulfate particles exposed to room air showed major contamination from phthalic anhydride, which has disappeared over time, as well as minor contamination from other organic compounds. Investigations of α-pinene derived SOA nanoparticles also show some additional ions for NanoCharger-exposed particles, especially in negative ion mode, where TDCIMS mass spectra are more sensitive to multifunctional carboxylic acids. The NanoCharger did not impart any systematic ion intensity bias into the mass spectra that would significantly affect any interpretations one would make for these experiments. We conclude that the NanoCharger approach is promising, as it increases the concentration of singly charged particles in the 6–20 nm size range with minimal chemical artifacts.
Disclaimer
Neither the United States Government nor any agency thereof, nor any of their employees, makes any warranty, express or implied, or assumes any legal liability or responsibility for the accuracy, completeness, or usefulness of any information, apparatus, product, or process disclosed, or represents that its use would not infringe privately owned rights. Reference herein to any specific commercial product, process, or service by trade name, trademark, manufacturer, or otherwise does not necessarily constitute or imply its endorsement, recommendation, or favoring by the United States Government or any agency thereof. The views and opinions of authors expressed herein do not necessarily state or reflect those of the United States Government or any agency thereof.
Supplemental Material
Download Zip (499 KB)Acknowledgments
The authors thank Prof. Peter McMurry for inspiring this research and providing valuable guidance in its early stages.
Disclosure statement
No potential conflict of interest was reported by the authors.
Additional information
Funding
Related Research Data
References
- Benoit, R. L. 1961. Ammonia Vapor Pressures of Ammoniacal Solutions of Ammonium and Copper (II) Sulfates. J. Chem. Eng. Data 6 (2):161–6. doi:10.1021/je60010a001.
- Choi, Y., and S. Kim. 2007. An Improved Method for Charging Submicron and Nano Particles with Uniform Charging Performance. Aerosol Sci. Technol. 41 (3):259–65.
- De La Mora, J. F., and P. Riesco-Chueca. 1988. Aerodynamic Focusing of Particles in a Carrier Gas. J. Fluid Mech. 195:1–21.
- Fuerstenau, S., A. Gomez, and J. Fernández de la Mora. 1994. Visualization of Aerodynamically Focused Subsonic Aerosol Jets. J. Aerosol Sci. 25 (1):165–73.
- Han, B. W., N. Hudda, Z. Ning, and C. Sioutas. 2008. Enhanced Unipolar Charging of Concentration-Enriched Particles Using Water-Based Condensational Growth. J. Aerosol Sci. 39 (9):770–84.
- Hering, S. V., S. R. Spielman, and G. S. Lewis. 2014. Moderated, Water-Based, Condensational Particle Growth in a Laminar Flow. Aerosol Sci. Technol. 48 (4):401–8.
- Iida, K., M. R. Stolzenburg, P. H. McMurry, and J. N. Smith. 2008. Estimating Nanoparticle Growth Rates from Size-Dependent Charged Fractions: Analysis of New Larticle Formation Events in Mexico City. J. Geophys. Res. Atmos. 113 (D5):15.
- Jiang, J., M. Chen, C. Kuang, M. Attoui, and P. H. McMurry. 2011. Electrical Mobility Spectrometer Using a Diethylene Glycol Condensation Particle Counter for Measurement of Aerosol Size Distributions Down to 1 nm. Aerosol Sci. Technol. 45 (4):510–21.
- Junninen, H., M. Ehn, T. Petäjä, L. Luosujärvi, T. Kotiaho, R. Kostiainen, U. Rohner, M. Gonin, K. Fuhrer, M. Kulmala, et al. 2010. A High-Resolution Mass Spectrometer to Measure Atmospheric Ion Composition. Atmos. Meas. Tech. 3 (4):1039–53.
- Kerminen, V. M., H. Lihavainen, M. Komppula, Y. Viisanen, and M. Kulmala. 2005. Direct Observational Evidence Linking Atmospheric Aerosol Formation and Cloud Droplet Activation. Geophys. Res. Lett. 32 (14):L14803.
- Khlystov, A., M. Lin, M. A. Bolch, and Y. Ma. 2009. Investigation of the Positive Artifact Formation During Sampling Semi-Volatile Aerosol Using Wet Denuders. Atmos. Environ. 43 (2):364–70.
- Kim, D. S., D. S. Lee, C. G. Woo, and M. Choi. 2006. Control of Nanoparticle Charge via Condensation Magnification. J. Aerosol Sci. 37 (12):1876–82.
- Kuang, C., P. H. McMurry, and A. V. McCormick. 2009. The Production of Cloud 1 Condensation Nuclei from New Particle Formation Events. Geophys. Res. Lett. 36 (9):L09822.
- Kulmala, M., H. Vehkamäki, T. Petäjä, M. Dal Maso, A. Lauri, V.-M. Kerminen, W. Birmili, and P. H. McMurry. 2004. Formation and Growth Rates of Ultrafine Atmospheric Particles: A Review of Observations. J. Aerosol Sci. 35 (2):143–76.
- Laaksonen, A., A. Hamed, J. Joutsensaari, L. Hiltunen, F. Cavalli, W. Junkermann, A. Asmi, S. Fuzzi, and M. C. Facchini. 2005. Cloud Condensation Nucleus Production from Nucleation Events at a Highly Polluted Region. Geophys. Res. Lett. 32 (6):L06812.
- McMurry, P. H., A. Ghimire, H. K. Ahn, H. Sakurai, K. Moore, M. Stolzenburg, and J. N. Smith. 2009. Sampling Nanoparticles for Chemical Analysis by Low Resolution Electrical Mobility Classification. Environmental Sci. Technol. 43 (13):4653–8.
- McWhinney, R. D., N. Rastogi, B. Urch, F. Silverman, J. R. Brook, G. J. Evans, and J. P. D. Abbatt. 2012. Characterization of the University of Toronto Concentrated Aerosol Particle Exposure Facility (CAPEF)—Effects on Fine and Ultrafine Nonrefractory Aerosol Composition. Aerosol Sci. Technol. 46 (6):697–707.
- Ning, Z., K. F. Moore, A. Polidori, and C. Sioutas. 2006. Field Validation of the New Miniature Versatile Aerosol Concentration Enrichment System (mVACES). Aerosol Sci. Technol. 40 (12):1098–110.
- Smith, J. N., K. C. Barsanti, H. R. Friedli, M. Ehn, M. Kulmala, D. R. Collins, J. H. Scheckman, B. J. Williams, and P. H. McMurry. 2010. Observations of Aminium Salt Formation in Atmospheric Nanoparticles: Implications for Aerosol Growth. Proc. Nat. Acad. Sci. USA. 107 (15):6634–6639. doi:10.1073/pnas.0912127107.
- Smith, J. N., M. J. Dunn, T. M. VanReken, K. Iida, M. R. Stolzenburg, P. H. McMurry, and L. G. Huey. 2008. Chemical Composition of Atmospheric Nanoparticles Formed from Nucleation in Tecámac, Mexico: Evidence for an Important Role for Organic Species in Nanoparticle Growth. Geophys. Res. Lett. 35 (4):L04808.
- Smith, J. N., K. F. Moore, F. L. Eisele, D. Voisin, A. K. Ghimire, H. Sakurai, and P. H. McMurry. 2005. Chemical Composition of Atmospheric Nanoparticles During Nucleation Events in Atlanta. J. Geophys. Res. Atmos. 110 (D22):D22S03.
- Stolzenburg, M. R., P. H. McMurry, H. Sakurai, J. N. Smith, R. L. Mauldin, F. L. Eisele, and C. F. Clement. 2005. Growth Rates of Freshly Nucleated Atmospheric Particles in Atlanta. J. Geophys. Res. Atmos. 110 (D22):D22S05.
- Suh, J., B. Han, D. S. Kim, and M. Choi. 2005. A Method for Enhanced Charging of Nanoparticles via Condensation Magnification. J. Aerosol Sci. 36 (10):1183–93.
- Voisin, D., J. N. Smith, H. Sakurai, P. H. McMurry, and F. L. Eisele. 2003. Thermal Desorption Chemical Ionization Mass Spectrometer for Ultrafine Particle Chemical Composition. Aerosol Sci. Technol. 37 (6):471–5.
- Winkler, P. M., J. Ortega, T. Karl, L. Cappellin, H. R. Friedli, K. Barsanti, P. H. McMurry, and J. N. Smith. 2012. Identification of the Biogenic Compounds Responsible for Size-Dependent Nanoparticle Growth. Geophys. Res. Lett. 39 (20):L20815. doi:10.1029/2012GL053253.