
Abstract
We show that for spherical particles with real refractive index and diameters greater than ca. 10 microns, the differential scattering cross-section is only independent of the refractive index at angles near 37 ± 5°. We built a device with a modified Gaussian incident beam profile so that the beam transit time of a particle passing through the beam can determine the true incident intensity for the scattering of the particle. By combining the modified Gaussian incident beam profile with detection of scattered light near 37 ± 5°, we demonstrate a refractive-index independent measurement of single spherical particles as they pass through the beam.
Copyright © 2018 American Association for Aerosol Research
EDITOR:
Introduction
The purpose of this article is to report on the study and improved accuracy of particle detection and size measurement for particles larger than one micron. Supra-micron particles, often referred to as coarse-mode particles, occur as dusts—such as wind-blown mineral dusts that represent the largest mass fraction of aerosols in the Earth’s atmosphere, grain and coal dusts, bio-aerosols, indoor cooking aerosols, large combustion particles from wildfires, and volcanic ash. Given their prevalence, it is important to be able to detect and accurately size the particles because particulate matter (PM) has adverse effects on human health (Kelly et al. Citation2017; Pope, Ezzati, and Dockery Citation2009), and the harm to human beings from PM is related to its size (Tianhua and Ying Citation2014).
The application of light-scattering to measure particle sizes began more than a century ago. Mie (Citation1908) developed the basic theory for scattering by spheres. Following the Mie theory, early optical particle counters (OPCs) were developed. Gucker et al. (Citation1947) built the first modern OPC in 1940s. Since then, there have been gradual improvements in this field. For example, Wang et al. (Citation2009) described a light-scattering instrument that combined photometry and single-particle sizing into one optical device, which could detect photometric signal and single-particle scattering at the same time, but analyzed only one of the mentioned signals. Karnowski et al. (Citation2005) presented an optical system to measure 1,000-micron pellets in which the particle blocked the light beam as the beam size was smaller than the particle.
Particle-sizing instruments range from expensive to low-cost sensors to measure the size and concentration of PM. An important aspect of any optical detector is to know the incident intensity on the particle. Most light sources, a laser beam for example, have an intensity profile across the beam. For many laser sources, the profile is Gaussian. Thus the position of the particle in that profile must be known and controlled. Some advanced instruments introduce a sheath flow to keep the particle stream centered as it passes through the beam. The disadvantage of sheath flow is that it can contribute to the dilution of the actual aerosol concentration and it adds cost to the detector. Another tactic is to detect the light at two or more angles and then use the ratio of the scattering for size determination; see, for example, (Hirleman and Wittig Citation1980). The ratio eliminates the uncertainty of the incident intensity. In low-cost sensors, particles move through the sensing volume without precise control of the aerosol stream. Generally, it is assumed that particles are passing through the center of the sensing volume, but a particle can be sized significantly differently if it passes through the very center or off-center.
Most particle-sizing instruments measure the number or mass concentration for a size-distribution bin. The uncertainty in concentration measurement can vary for each bin. Wang et al. (Citation2015) calibrated three low-cost particle sensors for PM measurement, measuring only the mass concentration with no size information. Volckens and Peters (Citation2005) calibrated the expensive TSI aerodynamic particle sizer (Model 3321) independently by collecting fluorescent polystyrene latex (PSL) spherical particles, ranging from 1 µm to 4 µm, on a filter in parallel with APS measurements. Error bars in the calibration plots indicated an uncertainty of 3–8% in the number concentration measurements. Eidhammer, Montague, and Deshler (Citation2008) developed a twin-angle OPC that measured the forward scattering at 40° and 74° to determine particle size and refractive index, respectively. Measurement uncertainties for size here were between 4% and 10% for particles greater than 3 µm in diameter. This uncertainty was measured for a small range of refractive indices, i.e., (1.35–1.60). However, for a larger range of refractive indices, for example, (1.33–2.0), the range of uncertainty would be larger as well. According to Budde et al. (Citation2013), even certified optical measurements show a deviation of within ±10% uncertainty.
Beam shaping has also been used to minimize the particle sizing uncertainty. Leander and Friedrich (1998) used a T-shaped diaphragm aperture with the T-leg oriented in the particle flow direction. The scattered light pulse of particles flying through close to the edge of the wider diaphragm area (i.e., T-crossbar) had a shorter time period than particles flying centrally through the diaphragm. Therefore, the first-mentioned particles were excluded during the measurement.
In our research, a diamond-shaped beam is used to make a correction for the Gaussian intensity distribution of a typical laser. With the diamond shape centered on the Gaussian profile, the time of fight of a particle through the beam is related to where the particle’s path is positioned relative to the Gaussian center. Thus by measuring the time of flight, the incident intensity for the scattering is determined regardless of where the particle passes through the beam, and the particle can be sized accurately. In addition, we show that for spherical particles an optimum scattering angle of 37°, particles can be sized independently of their refractive indices. In our apparatus, photodiodes positioned at ±37° scattering angle were used to record the scattered light intensity of the particle instantaneously for as long as the particle was inside the beam. Then total time of flight and scattered light-peak intensity were used to predict particle size. This system can be used to size any type of spherical particle in a wide range of diameters (1–1,000 µm) with an uncertainty less than 10% for particles greater than 10 µm in diameter. For particles smaller than 10 µm, the uncertainty is greater than 10% but the method still has some merit down to 1 micron. This method can also be used to improve low-cost sensor technology by adding size information into concentration measurements. Then the low-cost sensor will be able to determine particle size within a similar uncertainty range as a more expensive instrument.
We limit this work to spheres. Calculations for nonspherical particles are more labor intensive and will be pursued in the future. Nevertheless, it is worthwhile to note that nonspherical particle light scattering has many properties semiquantitatively similar to those of spheres including a strong forward scattering diffraction regime, a hump regime (as uncovered by Q-space analysis (Sorensen Citation2013)) and enhanced backscattering. See for example (Heinson et al. Citation2016).
Optimum scattering angle for refractive index independency
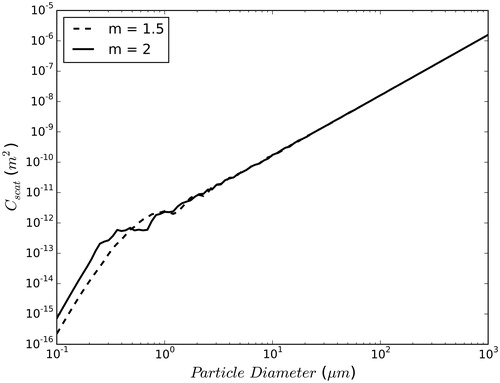
When a particle passes through an optical beam, it scatters light over a steradian solid angle. The amount of light scattered by the particle is characterized by the scattering cross-section. The scattering cross-section can be a function of many variables including scattering angle, excitation wavelength, particle size, and refractive index. The total scattering cross-section for different spherical particle sizes and two refractive indices is presented in . This figure was plotted for 0.532 μm wavelength using the MiePlot online program developed by Laven (Citation2010). The figure shows the total scattering cross-section to be strongly dependent on particle size and weakly dependent on the real refractive index when the particle diameter is d ≥ 1 μm. The total scattering cross-section also depends on the refractive index for particles smaller than the wavelength, i.e., in the Rayleigh scattering regime; however, it is independent of the refractive index for particles much greater than the wavelength.
Figure 1. Total scattering cross-section for spherical particles scattering light with a wavelength of 0.532 μm.
In practical light-scattering systems, only a portion of the scattered light is gathered by a photodiode, which rests at a given angle. Such measurements are related to the differential scattering cross-section. In our current work, the photodiode collects light over a 10° scattering-angle range. It is instructive to check and see if the same dependence on particle size and refractive index holds for the smaller scattering angles.
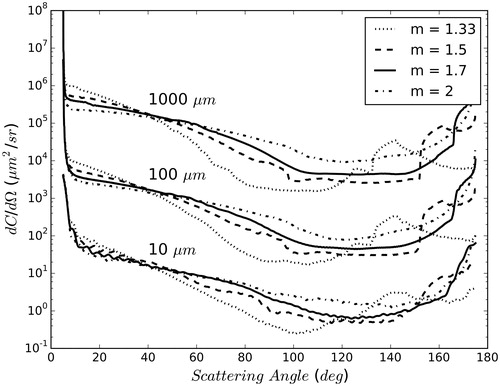
shows the differential scattering cross-section averaged over the 10° range when the detector is centered at the angle indicated. The situation is shown to be much more complex as a strong functional relationship with the refractive index is now seen. For particle-sizing applications, the refractive index is not known ahead of time, so this dependence is problematic. Fortunately, at a scattering angle of 37 ± 5°, the differential cross-section still shows relative independence of the refractive index. On the other hand, the differential scattering cross-section shows a strong dependence on the real refractive indices for scattering angles other than 37°. Therefore, a good strategy to build an optical particle-sizing instrument is to use a 37° scattering angle so that the refractive index, hence particle composition, need not be known.
Figure 2. Average differential scattering cross-section over a 10° scattering angle for four different refractive indices and three different particle diameters (10, 100, and 1,000 µm).
Here it is important to acknowledge that the refractive index can be complex and hence written as m = n + iκ. In our analysis above we have taken the imaginary part to be zero, i.e., κ = 0. We intend to expand this study to complex refractive indices. Preliminary results indicate that the effects of κ > 0 are only significant when κπD/λ > 1, where D is the particle diameter and λ is the wavelength of light.
Correction for the Gaussian beam
The nature of a radial Gaussian laser beam profile can make the light scatter of a large particle passing through the edge of the beam, and a small particle passing through the center of the beam, indistinguishable. This nonuniform profile significantly contributes to the uncertainty or cost of sizing particles based on light scattering.
One might think that for a particle passing through a cylindrical beam, the time of flight would indicate whether or not the particle passed through the center of the beam along a diameter, or along a cord of the cylindrical cross-section. However, for a true Gaussian beam, all particle paths have the same time of flight; in fact, the Gaussian profile is unique in this respect. Here we modify the Gaussian shape with a diamond-shaped aperture so that time of flight can indicate the precise position of the particle, and hence the precise incident intensity. The diamond profile is shown in .
Figure 3. Diamond-shaped beam aperture.
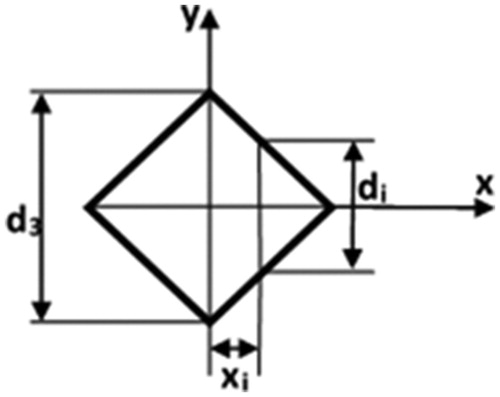
In , assuming particles move vertically through any position xi for a given average velocity, the time of flight varies linearly from the center toward the edge. Using time of flight and the known velocity, the cord length di can be found and then xi calculated. Light-scattering intensity is maximum on the x axis at any position xi where the particles are dropped.
Theoretical analysis
Many parameters play a role in predicting particle size. These parameters can be related to the laser, cut-beam geometry, photodiode, photodiode amplifier, and so on. In this section, all parameters are related to each other in order to present a general equation for predicting particle size.
For a Gaussian beam,
(1)
where
is the intensity as a function of the beam radius,
is the peak intensity at the center of the beam,
is the radial distance from the beam center, and w is the beam waist. The radial distance in rectangular coordinates is
(2)
Total power in the beam is the integral of EquationEquation (1)(1) .
(3)
Combining EquationEquations (1)(1) and Equation(3)
(3) and integrating, one finds the total power in the beam.
(4)
is generally a known parameter. Then EquationEquation (4)
(4) can be solved for
To obtain the scattered power on the photodiode, EquationEquation (1)(1) can be multiplied by the differential scattering cross-section and integrated with a solid angle.
(5)
In EquationEquation (5)(5) ,
is the solid angle the photodiode makes with the particle position in the beam. Assuming
is constant in the small (± 5°) collection-angle range,
(6)
The photodiode gives an output voltage Vi, which can be obtained by
(7)
In the above equation, is the photodiode responsivity and
is the conversion factor of the photodiode amplifier.
Since we made a diamond-shaped beam, we need to take the new beam parameters into account. Considering , the parameters in diamond-shaped beam can be related as
(8)
In EquationEquation (8)(8) ,
is the average velocity of the particle and
is the time of flight of a particle passing through any xi position in the beam. We will assume that the particles are delivered to the scattering volume with the same velocity.
Since peak-scattered intensity is desired for a given velocity and time of flight, and the peak-scattered intensity can be on the x axis for the particles being dropped vertically and passing through any xi position, we assume the y component of r in EquationEquation (2)(2) to be zero. Thus, only the x component of r can play a role in that equation. Solving EquationEquation (8)
(8) for xi, and substituting it for r into EquationEquation (6)
(6) , EquationEquation (9)
(9) is obtained.
(9)
Actual differential scattering cross-sections for each particle diameter and four different refractive indices were obtained using an online program (Laven). Using actual values of an equation was found by regression analysis for the differential scattering cross-section vs. particle diameter for particle sizes of 1 µm and above.
(10)
Combining EquationEquations (4)(4) , Equation(7)
(7) , Equation(9)
(9) , and (10), we get
(11)
EquationEquation (11)(11) can be used to determine size and diameter d of the particle. In this equation,
and
are the solid angles the photodiode makes with the center “c” of the beam and any xi position in the beam, respectively. The term 106 is a conversion factor which gives the particle diameter in µm.
Uncertainty analysis
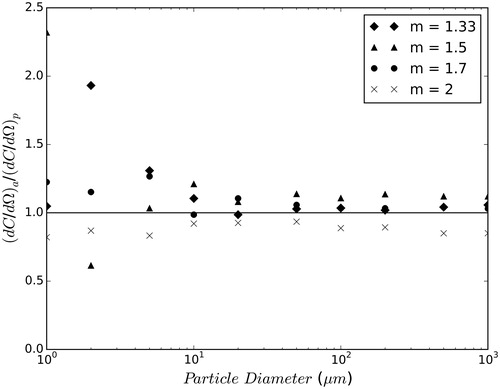
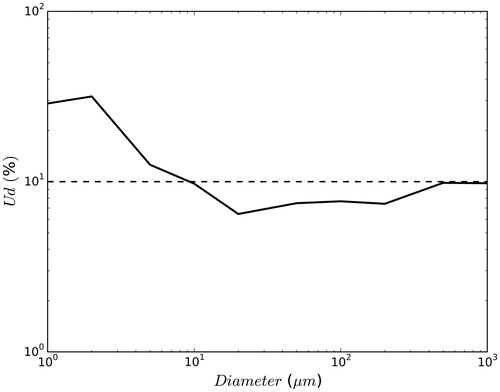
We now present an uncertainty analysis by applying the propagation of error to EquationEquation (11)(11) . Initially, we compare the actual and predicted differential scattering cross-sections to determine the uncertainty in the coefficient of the fitted equation, i.e., Equation (10), for predicting the differential scattering cross-section. shows their comparison for different particle sizes and four refractive indices. It can be seen that the uncertainty in the coefficient of the fitted equation is smaller for particle sizes of 10 µm and above; however, it gets larger as the particle size becomes smaller than 10 µm.
Figure 4. Comparison of actual to predicted differential scattering cross-sections.
Applying the propagation of error method to EquationEquation (11)(11) , we obtained an equation to define the total uncertainty in the predicted particle size in dimensionless form. We plotted the equation in to graphically represent the uncertainty distribution for each particle size. In our analysis, the uncertainty in the coefficient of Equation (10) was dominant.
Figure 5. Uncertainty in predicted particle size.
In , we can see the uncertainty is less than 10% for particles greater than 10 µm. However, for particles smaller than 10 µm, the uncertainty increases above 10%. Overall, the uncertainty range is (6–32%), with ±6% for a 20-µm particle and ±32% for a 2-µm particle.
Finally note that the particles we use below are 0.5 mm in diameter and the diamond-shaped aperture is at most d3 = 7.07 mm wide but narrows to zero width, see . Thus at some point for large xi the size of the particle dominates the transit time. However, simple geometry implies that there is a band of width 2xi = 5 mm centered on the aperture where the particle diameter is 10% or less of the transit length di hence the transit time of 71% of all particles will not be significantly affected. In most situations the particles will be smaller, or if necessary, the aperture can be made bigger to control this possible uncertainty.
Experimental setup
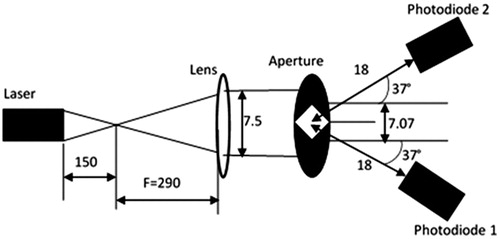
The experimental setup, which is shown in , uses a Laserglow BDG005XXX, 5-mW, 532-nm wavelength laser; a collimating lens; an aperture to make a diamond-shaped beam profile with dimensions of 5 mm × 5 mm; and two Thorlabs SM05PD1A photodiodes with a responsivity of R (532 nm) = 0.32 A/W. A Thorlabs PDA200C photodiode amplifier with a conversion coefficient of 1 × 10⁷ V/A is used to display the scattered-light signal detected by the photodiode. A National Instruments (NI) data acquisition system is connected to the photodiode amplifier and LabVIEW program to record the data.
Figure 6. Experimental setup, dimensions (mm).
Results and discussion
To validate this research and compare the experimental results to the theory, six barium titanate glass-compound (BTGC) particles and six glass beads 500 ± 10 µm in diameter were dropped through the center of the beam. The photodiodes positioned at a 37° scattering angle, recorded instantaneously the scattered-light intensity and time of flight for each particle as shown in . Since the particles were dropped at the center of the beam, both photodiodes recorded identical outputs. However, if the particles had been dropped at different positions on the beam, the photodiode closer to the particle’s position would obviously record a higher output. In that case, the output of the photodiode with the greater peak voltage would be used as the optimum value in EquationEquation (11)(11) to predict the particle size.
Figure 7. Experimental data for 500-µm particles at a 37° scattering angle. Each symbol indicates a different particle: (a) BTGC (m = 1.9); (b) glass (m = 1.5).
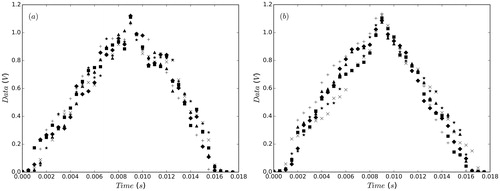
confirms the independence of the data to the refractive index at a 37° scattering angle since two different types of particles, i.e., BTGC (m = 1.9) and glass (m = 1.5), provided identical outputs. The consistent repeatability of our data can also be seen in this figure. If we consider any of these particles with its corresponding peak voltage and time of flight, using EquationEquation (11)(11) , we can predict the particle size within the ±10% uncertainty as indicated in for 500-µm particles. This can be seen in .
Table 1. Comparison of actual to predicted particle diameters.
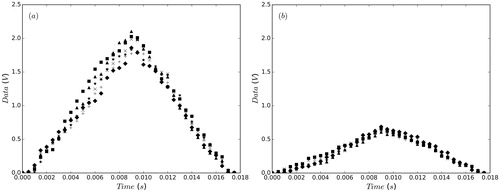
To check for the refractive-index dependency, we repeated the same experiment as we had done in , but for a 90° scattering angle as shown in . Unlike , in we can see the peak voltages for BTGC (m = 1.9) and glass (m = 1.5) are very different from each other. On average, the peak voltage is different by a factor of 3, which obviously confirms that scattered-light intensity depends on a refractive index at a 90° scattering angle. It can also be seen in that for a 90° scattering angle, the larger the refractive index, the larger the differential scattering cross-section, which quantitatively agrees with the experimental data in .
Figure 8. Experimental data for 500-µm particles at a 90° scattering angle. Each symbol indicates a different particle: (a) BTGC (m = 1.9); (b) glass (m = 1.5).
Conclusions
We modified the Gaussian incident beam profile to a diamond-shaped beam to eliminate the effect of the Gaussian intensity distribution, so that the beam transit time of a particle passing through the beam can determine the true incident intensity for the scattering of the particle. Also using the Mie scattering program, we demonstrated in that the differential scattering cross-section of spherical particles greater than 10 µm merged at 37 ± 5° for four different real refractive indices. This indicates that differential scattering cross-section is independent of the real refractive index at the mentioned scattering angle. Combining the modified Gaussian incident beam profile with detection of scattered light near 37 ± 5°, we demonstrated a refractive-index independent measurement of single-spherical particles as they pass through the beam. This research is useful in a variety of applications such as designing new PM sensors with low-cost and accurate particle-sizing capability, sorting poly-disperse solid particles to get highly mono-disperse particles out of them, and sizing fuel particles that can be used in advanced nuclear reactors. Finally, it can also help sort microspheres and reduce production costs.
References
- Budde, M., R. El Masri, T. Riedel, and M. Beigl. 2013. Enabling low-cost particulate matter measurement for participatory sensing scenarios. In Proceedings of the 12th International Conference on Mobile and Ubiquitous Multimedia, 1–10. doi: 10.1145/2541831.2541859.
- Eidhammer, T., D. C. Montague, and T. Deshler. 2008. Determination of index of refraction and size of supermicrometer particles from light scattering measurements at two angles. J. Geophys. Res. 113:D16206. doi: 10.1029/2007JD009607.
- Gucker, F. T., C. T. O'Konski, H. B. Pickard, and J. N. Pitts. 1947. A photoelectronic counter for colloidal particles1. J. Am. Chem. Soc. 69(10):2422–2431. doi: 10.1021/ja01202a053.
- Heinson, Y. W., J. B. Maughan, J. Ding, A. Chakrabarti, P. Yang, and C. M. Sorensen. 2016. Q-space analysis of light scattering by ice crystals. J. Quant. Spectrosc. Radiat. Transf. 185:86–94. doi: 10.1016/j.jqsrt.2016.08.021.
- Hirleman, E. D., and S. L. K. Wittig. 1980. Multiple ratio single particle counter. US Patent Application 4,188,121A, February 12, 1980.
- Karnowski, T. P., A. K. Kercher, J. D. Hunn, and L. C. Maxey. 2005. A simple optical system for real-time size measurements of triso fuel pellets. In Proceedings of SPIE—The International Society for Optical Engineering, 62–73.
- Kelly, K. E., J. Whitaker, A. Petty, C. Widmer, A. Dybwad, D. Sleeth, R. Martin, and A. Butterfield. 2017. Ambient and laboratory evaluation of a low-cost particulate matter sensor. Environ. Pollut. 221:491–500. doi: 10.1016/j.envpol.2016.12.039.
- Laven, P. 2010. Separating diffraction from scattering: The million-dollar challenge. J. Nanophotonics 4(1):041593. doi: 10.1117/1.3374327.
- Leander, M., and M. Friedrich. 1998. Device and method for measuring a particle flow in a fluid. US Patent Application 5,815,265A, September 29, 1998.
- Mie, G. 1908. Beiträge zur optik trüber medien, speziell kolloidaler metallösungen. Ann. Phys. 330(3):377–445. doi: 10.1002/andp.19083300302.
- Pope, C. A. I., M. Ezzati, and D. W. Dockery. 2009. Fine-particulate air pollution and life expectancy in the United States. N. Engl. J. Med. 360(4):376–386. doi: 10.1056/NEJMsa0805646.
- Sorensen, C. M. 2013. Q-space analysis of scattering by particles: A review. J. Quant. Spectrosc. Radiat. Transf. 131:3–12. doi: 10.1016/j.jqsrt.2012.12.029.
- Tianhua, L., and W. Ying. 2014. Design of indoor dust concentration monitor based on light scattering detection method. Sci. Res. Essays 9(9):321–324.
- Volckens, J., and T. M. Peters. 2005. Counting and particle transmission efficiency of the aerodynamic particle sizer. J. Aerosol. Sci. 36(12):1400–1408. doi: 10.1016/j.jaerosci.2005.03.009.
- Wang, X., G. Chancellor, J. Evenstad, J. E. Farnsworth, A. Hase, G. M. Olson, A. Sreenath, and J. K. Agarwal. 2009. A novel optical instrument for estimating size segregated aerosol mass concentration in real time. Aerosol. Sci. Technol. 43(9):939–950. doi: 10.1080/02786820903045141.
- Wang, Y., J. Li, H. Jing, Q. Zhang, J. Jiang, and P. Biswas. 2015. Laboratory evaluation and calibration of three low-cost particle sensors for particulate matter measurement. Aerosol. Sci. Technol. 49(11):1063–1077. doi: 10.1080/02786826.2015.1100710.