
Abstract
A self-sustaining, motion-tolerant, water-based condensation particle counter (CPC) has been designed, fabricated, and tested. Referred to as “MAGIC” for moderated aerosol growth with internal water cycling, the particle size response is similar to the 5-nm cut-point commercial CPCs. MAGIC is a laminar-flow instrument with three temperature stages: cool, warm, and cool. The middle warm-walled stage initiates the condensational growth and the final cool-walled stage maintains supersaturated conditions while recovering water vapor. By using a continuous wick throughout all three stages, the system recharges itself through a combination of water condensate from the sampled airstream and recovery of water vapor from the peak supersaturation region. A reservoir-less prototype system based on this concept was built and tested. Experiments show equal performance in any orientation, upright or inverted, and tolerance to tipping, shaking and vibrational shocks up to 5 g. Under mild ambient conditions, it provided multi-week operation without replenishing the wick.
Copyright © 2018 American Association for Aerosol Research
EDITOR:
Introduction
Ultrafine and nanometer particles, loosely defined as those with diameters less than 100 nm, are ubiquitous in urban atmospheres. A number of studies indicate that these ultrafine particles are more toxic than accumulation mode (∼0.1–2.5 µm) airborne particles, contributing disproportionally to oxidative stress (e.g., Li et al. Citation2003). Concern over these particles has led to a particle number standard for diesel emissions in Europe (European Commission Citation2008). In California, it has led to rulings that new schools not be sited near freeways or major roadways (State of California 2003).
Monitoring ultrafine particles is a challenge. Unlike PM2.5 mass which typically exhibits fairly uniform concentrations over an air basin, ultrafine particle number concentrations are highly variable both spatially and temporally. Concentrations are elevated near sources, such as freeways (Hitchins et al. Citation2000; Zhu et al. Citation2002, Citation2004; Hagler et al. Citation2009). These ultrafine particles can penetrate indoors and may be important to personal exposures (e.g., Morawska et al. Citation2001, Citation2003; Mullen et al. Citation2011; Bekö et al. 2013). Indoor sources, such as misadjusted pilot lights, or poorly ventilated furnaces can also be a significant contributor to long-term exposures (Bhangar et al. Citation2011), while activities such as cooking, candle-burning, heaters, or cleaning lead to short-term injection of ultrafine particles (He et al. Citation2004; Wallace and Ott Citation2011; Bekö et al. 2013).
Many of the indoor studies cited above used electrometer-based instruments to assess particle number concentrations. These instruments pass the aerosol through a unipolar charger and measure the electric current carried by the charged particles. To reduce the sensitivity to particle size, these instruments tend to be two-stage systems. The Aerosense developed by Marra, Voetz, and Kiesling (2010) measures the current associated with particles that penetrate a pulsed precipitator, yielding signals for the total aerosol, and for the less-mobile particles not removed by the precipitator. The DiSCmini (Testo, Inc.; Fierz et al. Citation2011) uses a diffusion screen to separately capture and detect the most mobile particles, followed by a filter to capture and detect those not deposited on the screen. Both of these instruments report mean particle diameter and ultrafine particle number concentration. The Partector (Naneos Particle Solutions GmbH; Fierz et al. Citation2014) uses induced current for particle detection; developed for industrial hygiene applications it reports lung deposited surface area.
Although electrometer-based measurements can be compact and rugged, condensation particle counters (CPCs) remain the standard for assessing airborne particle number concentrations. For some applications, concentrations may be too low, or size distributions too variable for accurate determination of number concentrations from electrometer readings. Condensation particle counting offers single particle detection and wide dynamic range, without the particle size dependence of the electrometer systems. Bhangar and Mullen used a small, water-based CPC for measurements in schools and homes. Others have deployed the reservoir-less, isopropanol-based P-Trak CPC (TSI, Inc.). But there are limitations to each of these instruments. While small CPCs exists, they require liquid reservoirs for sustained operation, and most use alcohol, which limits the use in occupied environments. The P-Trak has no liquid reservoirs, and thus tolerates motion, but is limited to about 8 h before the wick must be removed and recharged.
This article explores a new approach for particle counting using the “moderated” water condensation method introduced by Hering, Spielman, and Lewis (Citation2014), with the goal of providing sustained, multi-day condensation particle counting in a motion-tolerant device. Originally developed for condensationally enhanced particle collection at mild temperatures, the moderated condensation method cools the final section of the condensation region. To this concept, we add a continuous wick that spans all sections of the growth tube such that the water vapor is directly recovered by the wick. The question addressed here is whether this approach can reduce the water consumption sufficiently to allow sustained multiday operation in a reservoir-less, motion-tolerant, CPC. With the sense that such sustained operation would be somewhat magical, this concept is referred to as MAGIC, for moderated aerosol growth with internal water cycling.
The MAGIC concept
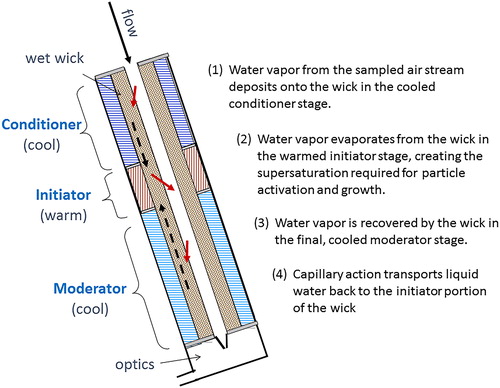
As illustrated in , the air sample passes through a single, wet-walled channel with three temperature regions. This is spanned by a continuous wick. During operation the sample flow is cooled and humidified by the initial “conditioner” stage. Flow then passes into the warm, wet-walled “initiator” stage where it becomes supersaturated, initiating condensational growth. This supersaturation is created by the diffusive transport of water vapor from the warm, wet initiator walls, which occurs more rapidly than the flow warms. The mass diffusivity of water, being a small molecule, is larger than the thermal diffusivity of air, and it is the relative rates of these two transport processes that are important. The higher the temperature difference between the initiator and conditioner stages the higher the supersaturation, and the smaller size of particle size that may be activated. Condensational growth continues in the subsequent cooler “moderator” stage, which removes both water vapor and heat while maintaining supersaturated conditions.
Figure 1. Schematic illustrating the concept of the MAGIC condensation particle counter (expanded along diameter for clarity). The conditioner is cooled, the initiator is warmed, and the moderator is cooled. One wick spans all three temperature regions.
Calculations of the saturation ratio and water vapor content, obtained with COMSOL Multiphysics® numerical modeling software (www.comsol.com), are shown in for the specific example of a growth tube operated at 0.3 L/min, with a 4.6 mm ID, 8.0 mm OD wick, and temperature controlled section lengths of 42 mm, 10 mm and 50 mm separated by 5 mm insulators. These calculations include effects of heat transport across the wick, as well as evaporative cooling and condensational heating at the wick surface and thermal gradients between sections. Results are presented in terms of the nondimensional axial length zD/Q, where z is the axial position, D is the mass diffusivity of water vapor in air, and Q is the volumetric flow rate. All cases assume a conditioner and initiator wall temperatures of Tcon = 10 °C and Tini = 45 °C, with moderator temperatures, Tmod, of 10°, 15°, 20°, or 45 °C.
Figure 2. Calculated saturation ratio and water vapor content for flow passing through the MAGIC growth tube. Results are for the centerline trajectory. The axial position is normalized by the ratio of the volumetric flow rate (Q) to mass diffusivity of water vapor (D).
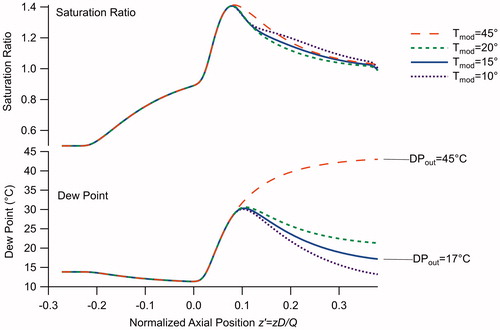
In , result for the moderator set to the same temperature as the initiator mimics the two stage condensation approach of the first laminar flow water condensation particle counters (WCPCs, Hering et al. Citation2005), in which the supersaturated region had uniformly high wall temperatures throughout. The colder moderator temperatures illustrate the three stage approach, in which the supersaturated region consists of a short warm-walled section followed by a cold wall section. As is apparent in the upper panel of , the peak centerline saturation ratio is the same in all cases, independent of the moderator temperature. This is because the peak saturation ratio is determined by the temperature jump between the conditioner and initiator, independent of what happens downstream. Within the cooled moderator, the saturation ratio remains above one, as the cold walls remove both water vapor and heat at similar rates. Indeed these profiles are nearly the same over this wide range in moderator temperatures. As the saturation ratio determines the activation size and droplet growth, these calculations indicate similar instrument performance at each of these moderator wall temperatures.
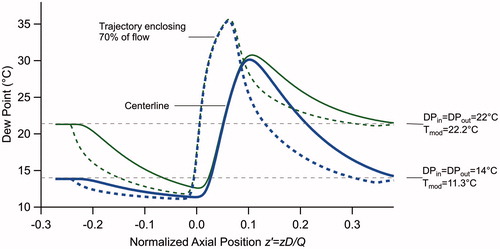
The difference between the original (Tmod = Tini) and moderated approach (Tmod < Tini) is in the temperature and dew point of the flow exiting the growth tube, as shown in lower panel of . With the original two-stage design, the output flow has a dew point near the 45 °C temperature of the walls. With the cooled moderator, the water vapor content of the output flow is much lower, due to condensation on the cold moderator walls. Interestingly, it is sometimes possible to match the dew point of the sampled air flow, as illustrated in . This panel shows dew point calculated for input air stream at 25 °C and either 50% or 80% input relative humidity, wherein the moderator temperature has been selected so that the water content of the flow exiting the growth tube matches that which enters. In other words, for these two examples the net consumption of water by the condensational growth system is zero. This suggests the possibility of a self-sustaining CPC.
Figure 3. Dew point along two trajectories, the centerline and the trajectory encompassing 70% of the flow (r/ro = 0.67). The axial position is normalized by the ratio of the volumetric flow rate (Q) to mass diffusivity of water vapor (D).
The self-sustaining aspect is implemented by use of a continuous wick that spans all three-stage temperature stages. As illustrated by the arrows in , if the dew point of the air being sampled is higher than Tcon, water vapor will condense onto the wick lining the conditioner walls. Similarly, a portion of the water vapor added to the flow in the warm initiator stage condenses onto the wick within the moderator. The condensate captured by the wick in the cooled moderator and conditioner sections is carried to the warmed initiator section via capillary action. This passive, internal cycling of the water allows extended operation without the need to replenish the wick. As the maximum supersaturation and hence instrument performance is independent of the moderator stage temperature, its temperature can be adjusted to control the amount of water vapor carried by the exiting flow.
Experimental methods
Instrument description
The MAGIC concept was evaluated using a cylindrical growth tube fabricated for this purpose. The conditioner, initiator and moderator sections measuring 10 mm ID, and 55 mm, 24 mm and 90 mm in length and separated by a 6 mm insulators. These were lined with a continuous wick formed by rolling a length of membrane filter media, with an internal diameter of approximately 5 mm. The wick was wetted manually at the outset of each set of experiments by simply filling the column with water, with the wick in place, with the flow off and the pumping line disconnected, and then allowing non-absorbed (excess) water to drain. The volume of water held by the wick is approximately 6 mL. This growth tube was coupled to the optics head from a TSI Model 3783 WCPC which was realigned to operate at a temperature of 30–40 °C. Typical flow was 300 cm3/min and was provided by critical flow to external vacuum, and typical operating temperatures were 5 °C for the conditioner, 40 °C for the initiator, and 2–16 °C for the moderator. The conditioner and initiator temperatures, optics and pulse counting were controlled through the mother board of a TSI-3783. Initially, the moderator temperature was also controlled by this mother board by repurposing the circuit designed for output flow water removal. In this configuration, the operating temperatures were fixed and set manually through serial commands. Subsequently we added a separate circuit to monitor the relative humidity and temperature at the input and output flows using Honewell Humidlcon (Series 8000), and to automatically adjust the temperature of the moderator stage in accordance with the dew point calculated from the input temperature and relative humidity readings.
Evaluation methods
The MAGIC prototype was tested with ambient air and with monodispersed aerosol. In both instances comparison was made to a general purpose WCPC (either the Quant 400, later sold as the TSI Model 3785, or the later version TSI Model 3787). These WCPCs operated at standard temperatures of 20 and 60 °C for the conditioner and growth region, yielding a nominal threshold of 5 nm (Hering et al. Citation2005). For ambient testing comparison was also made to the nano-WCPC (TSI Model 3788), which has a 3 nm threshold. Ambient testing was done from our laboratory located in Berkeley, CA, within 0.8 km of a freeway and with windows opening to the outdoors. Air was sampled through a common inlet with a coarse particle screen. Monodisperse aerosol testing was done using sulfate aerosols generated by atomization, charged conditioned using a soft X-ray source (TSI Model 3077) and size selected using either a high-flow (HF-DMA, Stolzenburg, Kreisberg, and Hering Citation1998) or nano-differential mobility analyzer (nano-DMA, TSI, Model 3085, Shoreview, MN).
To examine the effect of the moderator temperature on the amount of water recovered, we measured the temperature and relative humidity of the flows entering and exiting the MAGIC. The Humidlcon sensors which were calibrated against each other, as it was the change in these values, rather than the absolute readings, that was of most interest. These tests were also done using the vWCPC (Hering et al. Citation2017) which was configured to operate at MAGIC’s temperatures of 10 and 45 °C for the conditioner and initiator, with the moderator temperature varied. Like MAGIC, the vWCPC has a continuous wick through all three stages, but the vWCPC continuously injects water into the wick, ensuring that it was wet throughout these tests. This was done to remove uncertainty in the data that could arise from a drying wick.
To examine the effects of orientation, ambient testing was done with MAGIC in one of three positions: upright with optics head above the growth tube; inverted and sideways. To examine effects of vibration, acceleration was recorded using a cell phone strapped to MAGIC’s frame, with comparison made to a nearby stationary benchtop WCPC.
Results
Initial explorations with fixed moderator temperature
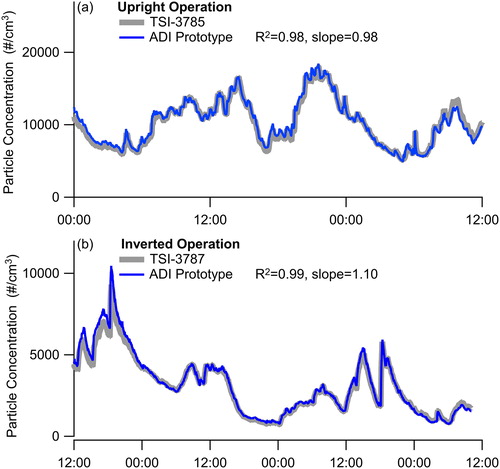
In the first experiments, the moderator was operated at a fixed temperature, and the indicated particle concentrations were compared to a general purpose WCPC for ambient air sampling. As shown in , data are comparable to the WCPC for operation either upright, with the optics head above the growth tube, or inverted, with the optics head at the bottom. Each of these runs extended over three days on a single charge of the wick, that is the MAGIC operated solely on the water that was in the wick at the outset. Operating temperatures were 5°, 45°, for the conditioner and initiator, and either 13° (upright) or10° (inverted) for the moderator. Comparison to the WCPC yielded a regression coefficients are >0.95, with slope of 0.97 and 1.10 for the upright and inverted runs, respectively. This tolerance to tipping is due to the fact that MAGIC has no liquid reservoirs, all of the water used for condensational growth is held within the wick. Ambient relative humidity values during these initial tests were not recorded, but are typically mild for this location (30–60%).
Figure 4. Comparison of the prototype MAGIC system to a bench top water-based condensation particle counter, the TSI Model 3785 for operation of MAGIC in (a) an upright and (b) an inverted position. Data are for sampling ambient air in Berkeley, CA. Operating temperatures of the three stages are 5, 45, and 13 °C. The wick was wetted at the beginning of this three-day period, and then the system was left to run unattended.
Additionally, we also purposely stressed the instrument by operating at relative humidity extremes. For these tests we recorded the temperature and relative humidity of the input sample flow, and of the flow exiting the optics head. In tests with dry air (11 ± 0.5% RH at 21 °C), with the moderator temperature set to 10 °C, the output flow relative humidity was 45 ± 3%. Thus the output flow contained more water vapor than the entering sample flow, causing the wick to dry. Number concentrations reported by MAGIC were within 10% of the reference for 25 h, and then dropped dramatically, declining to zero counts within the subsequent 3 h. In tests with humid air, with moderator temperature was set to 14 °C, and the input flow at RH = 78 ± 1% at 21 °C, the relative humidity of the output flow climbed from 60% to 70%. Thus the water content of the output flow was less than that at the input, and the wick gradually became wetter, until the system flooded after some 30 h. Once flooded the counts dropped to zero within 1 h. These data show that the net water used by MAGIC can be either positive or negative, depending upon the humidity of the sampled air flow and the operating temperature for the moderator stage.
These initial explorations confirmed (1) that number concentrations reported by MAGIC are comparable to other commercial CPCs, (2) that MAGIC tolerates operation in any orientation, and (3) that under typical indoor relative humidity conditions MAGIC may be operated for multiple days without recharging the wick, yet operation under extreme relative humidity conditions is limited to about 24 h.
Measurement of water vapor recovery
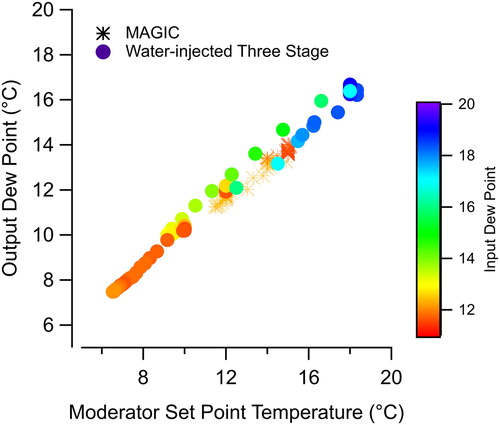
As shown by the preliminary experiments described above, the proper extent of water vapor recovery is key to extended operation of the MAGIC. According to our models, the amount of water vapor recovered within the moderator stage is dependent on its temperature. This was evaluated through measurement of the input and output dew points (as calculated from temperature and relative humidity) as a function of the moderator temperature. Testing was done over a range of input conditions. Data were obtained using two systems: the MAGIC prototype described above, and the three-stage vWCPC configured to operate at the same temperatures as MAGIC. The vWCPC differs in that it has active water injection into the wick, ensuring that the wick was always fully wetted. With this system we found a linear correspondence between the output dew point and the moderator temperature, as shown in . The input relative humidity is indicated by the shading of these points, and does not affect this linear relationship results over the range tested. We note that the slope of the line is less than 1. For warmer moderator settings, the output dew point is close to the moderator temperature. At colder moderator temperatures, the output dew point is higher, indicating incomplete recovery of water vapor from the air stream. What these data do indicate is that for input dew points higher than 8 °C it is possible to match the output dew point to that of the input flow through control of Tmod.
Figure 5. Correlation between the dew point of the flow exiting the MAGIC and the moderator (third) stage operating temperature. Data were collected with the MAGIC system and with the vWCPC operated at MAGIC’s temperatures. Shading indicates the dew point of the sampled air flow.
Ambient testing with active moderator temperature control
To extend the operating period of MAGIC, we added the ability to control the moderator temperature based on the temperature and relative humidity of the sampled air stream. shows six weeks of continuous particle concentration measurements obtained with this actively controlled system. Also shown is the temperature and relative humidity of the sampled air during this period, as well as the orientation of the MAGIC system (either upright, inverted, or on its side). For most of the test the moderator temperature was controlled to 4 °C below the input dew point, with a minimum of 0 °C. On three occasions zero values were checked by placing an absolute filter at the inlet. At several other times the inlet flow was either humidified, or dried, as can be seen by the sharp changes in the input relative humidity. For these tests the ambient temperature varied from 17° to 26°, with mean of 20.6 ± 1.3 °C, and relative humidity varied from 23% to 86% (mean of 46 ± 12%). The corresponding dew point varied from 0° to 21° with a mean of 8.0 ± 4.1.
Figure 6. Long-term air sampling of ambient air with the prototype MAGIC alongside the TSI-3785 WCPC (5 nm threshold) and the TSI-3788 nano-WCPC (3 nm threshold). MAGIC’s wick was wetted at the beginning of this period only.
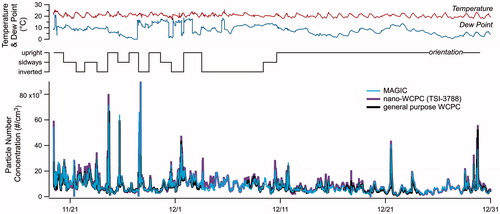
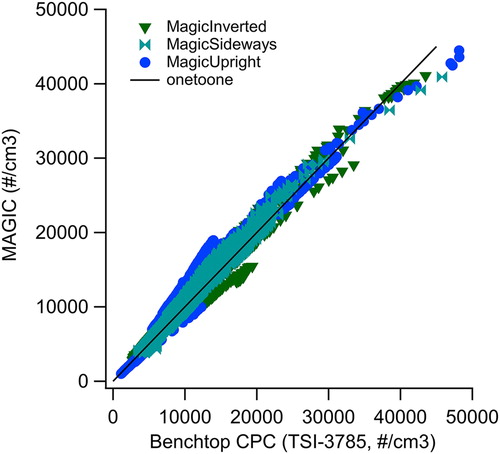
As is apparent from the plot, the MAGIC data correlate well with the general purpose WCPC (TSI-3785), with R2 = 0.95 and regression slope of 1.05 ± 0.001 (intercept 7 ± 10). Based on the operating temperatures, one expects similar performance between these two instruments. Comparison to the nano-WCPC (TSI-3788), which has a lower detection limit of 3 nm, gives a regression slope of 0.88 ± 0.001, with a correlation coefficient R2 = 0.90 (intercept = 343 ± 12). Importantly, the MAGIC ran without servicing for the entire six-week period and was still operating well at the end of this period. is a scatterplot showing the correlation between MAGIC and the general purpose WCPC as a function of MAGIC’s orientation, whether operated upright, inverted, or sideways. Data above 5 × 10⁵ are excluded because no calibrations were done to verify dead time corrections for either MAGIC or the reference instruments. Correlation coefficients squared are above 0.97 for inverted, sideways and upright orientations, and regression slopes fall near 1.00.
Figure 7. Scatterplot of the data from for each of three orientations of MAGIC.
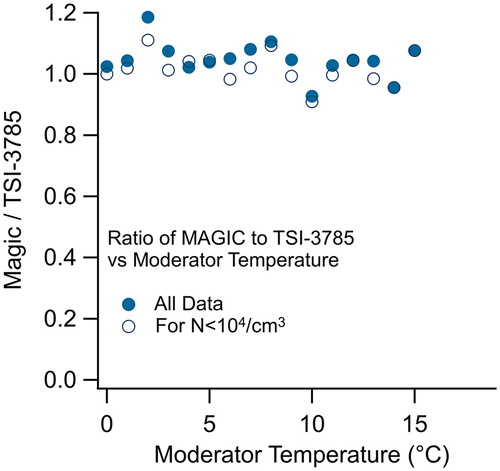
Using this ambient data, we also examined whether the response of the MAGIC is independent of the moderator temperature. The models show that the peak supersaturation, and thus the activation threshold, is independent of the temperature of Tmod. To test whether this independence is consistent with the measurements, we examined for various moderator temperatures. displays the mean concentration ratio between the two instruments as a function of the MAGIC moderator temperature. On average, the values from MAGIC were 4% higher than with the WCPC, with no significant dependence on moderator temperature.
Figure 8. Mean ratio between MAGIC and the general purpose WCPC (TSI 3785) for the data from , binned by Tmod as a function of the operating temperature of MAGIC’s moderator stage.
For this ambient data the water content of the exiting flow, as indicated by the exiting flow dew point, correlated with the moderator temperature (R2 = 0.88), with a slope of 0.86 and an intercept of 4.6°. This is qualitative agreement with the data shown in . The mean exiting dew point was 8.8 ± 2.9 °C, which is slightly higher than the 8.0 °C mean value for entering flow, indicating a slight loss of water from MAGIC. Under the assumption that any difference in the water vapor content between the entering and exiting flows is attributable to a change in the water held by the wick, we calculated the net change in wick water over the six-week data set. This calculation indicates that wick water could either increase or decrease. These estimates, admittedly rough, show as much as 1.8 g loss or as much as 0.8 g gain over this six-week period. By comparison, the MAGIC wick holds approximately 6 g of water. What is clear from the data is that these excursions were not enough to affect performance. The ratio in the indicated particles counts between MAGIC and either of the reference WCPCs showed no correlation with the calculated net water loss from MAGIC’s wick over this six-week period.
Most importantly, the MAGIC ran without interruption, and without requiring any servicing during this entire six-week period. This was not true of the other WCPCs, which needed some adjustments to keep operational during this test.
Evaluation with monodisperse aerosols
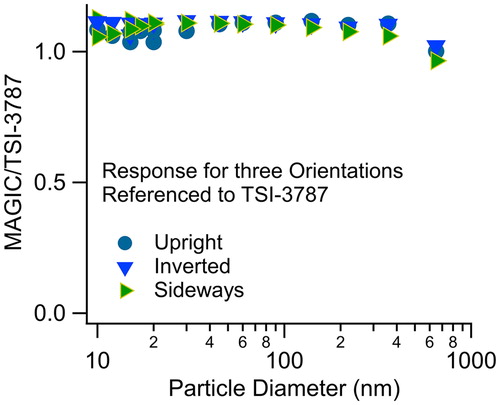
The size response of MAGIC relative to a general purpose WCPC was evaluated using mobility selected ammonium sulfate aerosol. MAGIC was operated a fixed temperatures of MAGIC were Tcon = 5 °C, Tini = 40 °C, Tmod = 7 °C, Topt = 30 °C, for the conditioner, initiator, moderator, and optics head. According to the models, the particle activation size is determined by the temperature difference between the initiator and conditioner, which for these experiments was 35 °C. The WCPC, with its 40 °C temperature difference between stages, should have a slightly lower particle size threshold. These comparisons were done at three orientations: upright, sideways and inverted, where upright refers to optics head above the growth tube. As shown in , the performance of these two instruments is similar, with MAGIC reading 10% higher on average, possibly because of a different, more efficient wick material. Importantly, the results are independent of the orientation of the MAGIC.
Figure 9. Response of MAGIC relative to the general purpose WCPC for mono-mobility ammonium sulfate aerosols.
Vibration testing
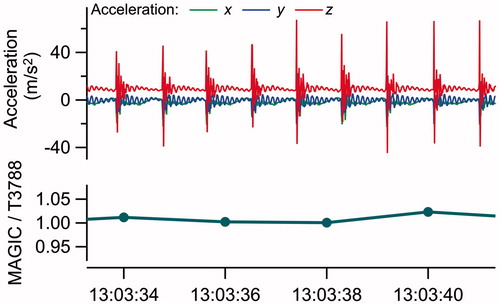
shows data for MAGIC when subject to shaking and vibration. MAGIC was shaken by hand, while accelerations were measured using the built-in accelerometer on a mobile telephone, which was strapped to the MAGIC unit. Comparison is made to the ultrafine TSI Model 3788 that was sitting on the benchtop nearby. No difference was detectable in the MAGIC response due to the shaking. The ratio between the ambient particle concentrations measured by the MAGIC while being shaken, and the stationary instruments never differed by more than 8%, even though momentary accelerations reached 5 g. is an enlargement over several seconds when the MAGIC was repeatedly dropped against the benchtop. The ringing is due to the resulting vibration in the frame in which the system was mounted. Even at these large accelerations, no effect was seen on the particle concentration signal.
Figure 10. Ambient particle concentrations measured by MAGIC while being shaken with comparison to a stationary benchtop WCPC (TSI-3788). Acceleration values are from an accelerometer strapped to MAGIC.
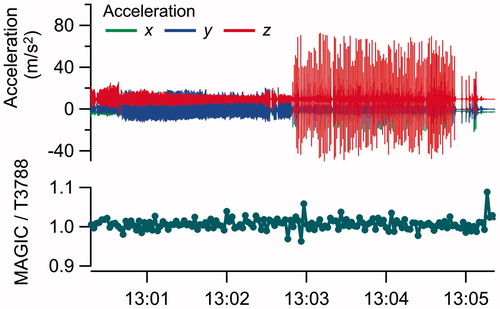
Figure 11. Enlargement from illustrating the stability of the MAGIC while being shaken and subject to forces of as much as 5 g.
Inlet pressure fluctuations
Finally, one advantage of the reservoir-less approach is insensitivity to inlet pressure fluctuations. Indeed, on several occasions we temporarily plugged the inlet while the system was operating. This was done by simply holding a finger over the inlet for 1–3 s. The indicated counts would drop to zero as the flow was stopped, and then recovered once the inlet was unblocked. It was not possible to flood the instrument in this manner.
Conclusions
In summary, we have demonstrated the operation of a motion-tolerant, self-sustaining, water-based CPC. Referred to as MAGIC, this counter is based on the three-stage “moderated” condensation approach. This moderator stage directly recovers the water vapor from the flow after the point of peak supersaturation, and this condensate is carried to the warm growth region via capillary action. In experiments with a prototype system, we have shown that the amount of water vapor retained can be controlled through adjusting the operating temperature of this third stage, and furthermore that the counting efficiency is independent of this operating temperature. Tests with mono-mobility aerosol and with ambient air demonstrated that the MAGIC is equivalent to a commercial, general purpose WCPC. Performance is independent of system orientation, with equal response when operated upright, sideways or inverted. MAGIC was found to be motion-tolerant, withstanding vibration of up to 5 g. It also tolerates a temporarily blocked inlet flow. Importantly, we found reliable operation over a six-week period without recharging the wick. Because a water handling system is not required, the system is simpler.
Potentially, the MAGIC concept could be adapted personal sampling, for deployment on unmanned aerial vehicles, or for measurements in micro-gravity environments. There are multiple possibilities. Subsequent to this work, we developed a 2-kg, 12-W, MAGIC system with inlet humidification and excess wick water removal to allow extended operation under extreme environmental condition. We have also made a compact 900 g, 5 W, battery-operable system for short term operation. Some questions remain, such as wick lifetime in polluted environments, or stability of the optics alignment. Yet, with further development, this approach offers the potential for sustained, compact, water-based, motion-tolerant condensation particle counting.
Disclaimer
The authors hold a patent on this technology and have commercialized an instrument based on this principle.
Additional information
Funding
Related Research Data
References
- Bekö, G., C. J. Weschler, A. Wierzbicka, D. G. Karottki, J. Toftum, S. Loft, and G. Clausen. 2013. Ultrafine particles: Exposure and source apportionment in 56 Danish homes. Environ. Sci. Technol. 47 (18):10240–8.
- Bhangar, S., N. A. Mullen, S. V. Hering, N. M. Kreisberg, and W. W. Nazaroff. 2011. Ultrafine particle concentrations and exposures in seven residences in Northern California. Indoor Air 21 (2):132–44.
- European Commission. 2008. Commission Regulation (EC) No 692/2008 of 18 July 2008 implementing and amending Regulation (EC) No 715/2007 of the European Parliament and of the Council on type-approval of motor vehicles with respect to emissions from light passenger and commercial vehicles (Euro 5 and Euro 6) and on access to vehicle repair and maintenance information. Off J Eur Union 199:1–136.
- Fierz, M., C. Houle, P. Steigmeier, and H. Burtscher. 2011. Design, calibration, and field performance of a miniature diffusion size classifier. Aerosol Sci. Technol. 45 (1):1–10.
- Fierz, M., D. Meier, P. Steigmeier, and H. Burtscher. 2014. Aerosol measurement by induced currents. Aerosol Sci. Technol. 48 (4):350–7.
- Hagler, G. S. W., R. W. Baldauf, E. D. Thoma, T. R. Long, R. F. Snow, J. S. Kinsey, L. Oudejans, and B. K. Gullett. 2009. Ultrafine particles near a major roadway in Raleigh, North Carolina: Downwind attenuation and correlation with traffic-related pollutants. Atmos. Environ. 43 (6):1229–34.
- He, C., M. Lidia, H. Jane, and G. Dale. 2004. Contribution from indoor sources to particle number and mass concentrations in residential houses. Atmos. Environ. 38 (21):3405–15.
- Hering, S. V., G. S. Lewis, S. R. Spielman, A. Eiguren-Fernandez, N. M. Kreisberg, C. Kuang, and M. Attoui. 2017. Detection near 1-nm with a laminar-flow, water-based condensation particle counter. Aerosol Sci. Technol. 51 (3):354–62. doi: 10.1080/02786826.2016.1262531.
- Hering, S. V., S. R. Spielman, and G. S. Lewis. 2014. Moderated, water-based, condensational particle growth in a laminar flow. Aerosol Sci. Technol. 48 (4):401–8.
- Hering, S. V., M. R. Stolzenburg, F. R. Quant, D. R. Oberreit, and P. B. Keady. 2005. A laminar-flow, water-based condensation particle counter (WCPC). Aerosol Sci. Technol. 39 (7):659–72.
- Hitchins, J., M. Lidia, R. Wolff, and G. Dale. 2000. Concentrations of submicrometre particles from vehicle emissions near a major road. Atmos. Environ. 34 (1):51–9.
- Li, N., C. Sioutas, A. Cho, D. Schmitz, C. Misra, J. Sempf, M. Wang, T. Oberley, J. Froines, and A. Nel. 2003. Ultrafine particulate pollutants induce oxidative stress and mitochondrial damage. Environ. Health Perspect. 111 (4):455.
- Marra, J., M. Voetz, and H.-J. Kiesling. 2010. Monitor for detecting and assessing exposure to airborne nanoparticles. J. Nanoparticle Res. 12 (1):21–37.
- Morawska, L., C. He, J. Hitchins, D. Gilbert, and S. Parappukkaran. 2001. The relationship between indoor and outdoor airborne particles in the residential environment. Atmos. Environ. 35 (20):3463–73.
- Morawska, L., C. He, J. Hitchins, D. Gilbert, and S. Parappukkaran. 2003. Characteristics of particle number and mass concentrations in residential houses in Brisbane, Australia. Atmos. Environ. 37 (30):4195–203.
- Mullen, N. A., S. Bhangar, S. V. Hering, N. M. Kreisberg, and W. W. Nazaroff. 2011. Ultrafine particle concentrations and exposures in six elementary school classrooms in Northern California. Indoor Air 21 (1):77–87.
- State of California, Senate Bill No. 352. 2003. An act to amend Section 17213 of the Education Code, and to amend Section 21151.8 of the Public Resources Code, relating to public schools. https://leginfo.legislature.ca.gov/faces/billNavClient.xhtml?bill_id=200320040SB352
- Stolzenburg, M., N. Kreisberg, and S. Hering. 1998. Atmospheric size distributions measured by differential mobility optical particle size spectrometry. Aerosol Sci. Technol. 29 (5):402–18.
- Wallace, L., and W. Ott. 2011. Personal exposure to ultrafine particles. J. Exposure Sci. Environ. Epidemiol. 21 (1):20.
- Zhu, Y., W. C. Hinds, S. Kim, S. Si, and C. Sioutas. 2002. Study of ultrafine particles near a major highway with heavy-duty diesel traffic. Atmos. Environ. 36 (27):4323–35.
- Zhu, Y., W. C. Hinds, S. Shen, and C. Sioutas. 2004. Seasonal trends of concentration and size distribution of ultrafine particles near major highways in Los Angeles Special Issue of Aerosol Science and Technology on Findings from the Fine Particulate Matter Supersites program. Aerosol Sci. Technol. 38 (S1):5–13.