
 ?Mathematical formulae have been encoded as MathML and are displayed in this HTML version using MathJax in order to improve their display. Uncheck the box to turn MathJax off. This feature requires Javascript. Click on a formula to zoom.
Abstract
In this study, we describe a newly developed three-wavelength differential photoacoustic spectrometer, which we denote RGB-DPAS, for aerosol absorption measurement in the visible spectral range: 671 nm (red), 532 nm (green), and 473 nm (blue). This instrument utilizes the differential photoacoustic spectrometric (DPAS) technique, which simultaneously measures light absorption signals due to total particulate matter + gaseous samples and those of gaseous samples alone. The difference between the photoacoustic signals recorded from the two nearly identical acoustic cells (<0.2% variability in physical dimensions) yields the aerosol photoacoustic signals at the three wavelengths. This measurement approach eliminates the interferences from light-absorbing gaseous species as well as low-frequency ambient acoustic noise. In this study, we demonstrate the linearity of the RGB-DPAS signal response to the number concentration of the synthetic carbon black particles at electrical mobility diameter (Dm) = 350 nm, which is used as a calibration surrogate. Based on the Allan variance analysis, detection limits (2σ) of 0.20 Mm−1 at 671 nm, 0.22 Mm−1 at 532 nm, and 0.90 Mm−1 at 473 nm have been achieved in 100 s data acquisition for the RGB-DPAS instrument.
Copyright © 2018 American Association for Aerosol Research
EDITOR:
Introduction
Atmospheric particulate matter (PM) plays an important role in global radiation balance via scattering and absorption of sun light (Stier et al. Citation2007; Carslaw et al. Citation2010). Precise measurements of optical properties of atmospheric aerosols are critical to our understanding of global climate change. On the other hand, optical properties of atmospheric aerosols can vary appreciably, depending upon conditions such as weather, location, and aerosol composition (Bergstrom et al. Citation2007; Li et al. Citation2007; Montilla et al. Citation2011). Such variation warrants real-time and continuous monitoring of aerosol optical properties.
Photoacoustic spectrometer (PAS) technology, in which an acoustic signal is generated due to absorption of electromagnetic radiation by air-borne samples, has been widely applied for studying aerosol light absorption (Bond and Bergstrom Citation2006; Lack et al. Citation2006; Moosmüller et al. Citation2009). At present, most of the PAS systems for PM absorption measurements are operated using a single acoustic resonator and at single wavelength, while some use either multiple lasers at different wavelengths or a continuous light source spanning a broad spectral range (Arnott et al. Citation2005; Lewis et al. Citation2008; Tian et al. Citation2009; Haisch et al. Citation2012; Lack et al. Citation2012; Sharma et al. Citation2013; Radney and Zangmeister Citation2015). Linke et al. (Citation2016) presented a new single-cavity photoacoustic spectrometer that measures the absorption coefficient of atmospheric aerosols at three wavelengths in the visible spectral range: 660 nm (red), 532 nm (green), and 445 nm (blue). Recently, Fischer and Smith (Citation2018) have developed a portable, four-wavelength, single-cell photoacoustic spectrometer for simultaneous measurement of ambient aerosol absorption coefficients at 406, 532, 662, and 785 nm, with an additional extinction measurement at 662 nm via a built-in cavity ringdown spectrometer (CRDS). One of the challenges in the photoacoustic measurements of aerosol light absorption comes from interferences due to atmospheric gas species such as nitrogen dioxide (NO2) and ozone (O3) (Hearn Citation1961; Molina and Molina Citation1986; Burkholder and Talukdar Citation1994; Bacis, Bouvier, and Flaud Citation1998; Brion et al. Citation1998; Burrows et al. Citation1998, Citation1999; Vandaele et al. Citation2002; Voigt et al. Citation2002; Osthoff et al. Citation2006). To precisely measure PM light absorption from UV to IR, it is necessary to eliminate the interferences from gas phase absorption. In addition to the aforementioned light-absorbing gaseous species, water, in both the gaseous and aerosol phases, can have an even larger impact on the photoacoustic measurements (Arnott et al. Citation2003; Murphy Citation2009; Langridge et al. Citation2013).
Due to lack of a light-absorbing aerosol standard (Baumgardner et al. Citation2012; Bluvshtein et al. Citation2017), calibration of photoacoustic signal response is typically performed with light-absorbing gases. Arnott, Moosmu¨Ller, and Walker (Citation2000), Lewis et al. (Citation2008), and Nakayama et al. (Citation2015) used high-concentration NO2 to calibrate their PAS instrument, while Lack et al. (Citation2006), Cappa et al. (Citation2012), and Davies et al. (Citation2018) utilized ozone, for which optical absorption levels were measured with the CRDS technique (O’Keefe and Deacon Citation1988; Scherer et al. Citation1997; Ball and Jones Citation2003). Tian et al. (Citation2009) and Gillis, Havey, and Hodges (Citation2010) have demonstrated the PAS calibration method through simultaneous measurements on aerosol optical absorption and the oxygen A-band absorption at 762 nm.
In this study, we demonstrate the development of a single-pass DPAS instrument that is capable of measuring PM absorption at 671 nm (red), 532 nm (green), and 473 nm (blue) in wavelength in real-time. A PM-based approach is used to demonstrate the proportionality of the photoacoustic signal response of the RGB-DPAS to carbon black particles with a mobility diameter of 350 nm. From these data, and representative literature values, a semi-quantitative cell constant was determined. Through Allan variance analysis, detection sensitivity of the RGB-DPAS instrument at each wavelength is also determined.
Instrumental description
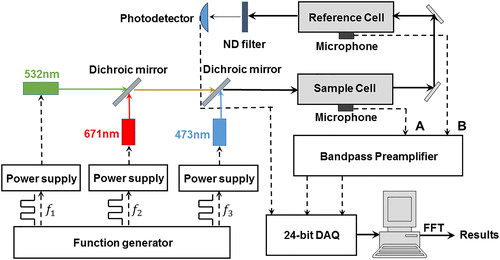
In this study, we developed a real-time PM measurement system, which is capable of simultaneously monitoring aerosol light absorption at three-wavelengths: 671 nm (red), 532 nm (green), and 473 nm (blue). The system employs the DPAS technique, which measures the total light absorption of PM and gaseous samples in one photoacoustic cell, and the gaseous light absorption in another cell. The RGB-DPAS system consists of a dual photoacoustic cell system, a single-beam RGB diode-pumped solid state (DPSS) laser, two microphone linear-array detectors, and a fast data acquisition and processing device, as shown in . It should be noted that the RGB DPSS laser system is not a laser with a single coherent optical cavity, but of three individual constituent lasers at different wavelengths. Multiple dichroic mirrors are applied to align the three laser beams of different wavelengths to produce a single, fine light beam at the exit.
Figure 1. A schematic plot of the RGB-DPAS instrument.
A detailed description of the dual-cell DPAS apparatus has been published previously (Yu et al. Citation2017). The sample and reference photoacoustic cells are cylindrical acoustic resonators made to identical specifications of 0.3 cm in diameter and 10 cm in length. In this study, photoacoustic signal response is defined as the microphone signal in voltage after analog and digital signal processing. In addition to the number concentration of light absorbers and their corresponding absorption cross-section, the signal response is also influenced by a combination of many instrumental and ambient variables, including the incident laser power, presence of water (Arnott et al. Citation2003; Lewis et al. Citation2008; Murphy Citation2009; Langridge et al. Citation2013; Radney and Zangmeister Citation2015) or other volatile species (Raspet et al. Citation2003), particle size (Cremer et al. Citation2017), relaxation rates (Miklós and Hess Citation2000; Gillis et al. Citation2010), etc. Photoacoustic signal responses of the sample cell derive from the total light absorption of both PM and gaseous species in the sample flow, while signal responses of the reference cell originate from light absorption of the gaseous species alone (with the PM samples removed via a particle filter). The differential photoacoustic signal responses between the sample and reference cells are thus related uniquely to the PM light absorption.
The sample flow is drawn into the DPAS instrument via a compact diaphragm pump (Model 1420-0500 from Gardner Denver – Thomas, Milwaukee, WI, USA) with a low-noise brushless DC electric motor. The diaphragm pump is mounted on a vibration-preventing damper to reduce its impact on the laser alignments, which are sensitive to any internal vibration and can affect measurement. A stainless steel critical orifice is used to constrain the total volumetric flow rate at 0.5 liter per minute (LPM) within each cell. Thus, in this study, the total flow rate of the RGB-DPAS system is fixed at 1 LPM under ambient conditions (temperature = 294 K and pressure = 100.7 kPa). However, we also investigated the influence of sample flow rate on instrumental noise level, using thermal mass flow controllers from MKS Instruments, and found that the DPAS apparatus is capable of operating at a total sample flow rate up to 2 LPM without a significant increase in background noise levels.
To improve the signal-to-noise ratio (S/N) of the DPAS measurements, a miniature microphone linear-array detector, instead of a single microphone detector, is used to measure photoacoustic signals at the center of each photoacoustic cell. It is placed at the anti-node of the acoustic resonator, where the amplitude of the photoacoustic wave is a maximum. At each end of the acoustic cell, a ¼-wave attenuator that is specific for the modulation frequency is attached to reduce background acoustic noise. The custom-designed linear-array detector contains four silicon-based microelectromechanical system (MEMS) microphones (Model# SPH1642HT5H-1 from Knowles, Itasca, IL, USA), which are integrated onto a printed circuit board (PCB). Voltage regulators, band-pass filters and low-noise voltage pre-amplifiers are also integrated onto the PCB for analog data processing. S/N of these MEMS microphones is 65 dB, 6 dB higher than the MEMS microphones used in the previous design (Model# SPU0409HD5H from Knowles, Itasca, IL, USA) (Yu et al. Citation2017). In this PCB design, DC power to each microphone is regulated separately. In addition, the AC signals from each microphone are also filtered at 1.7 kHz via a RC circuit with a theoretical bandpass width of 250 Hz to attenuate the non-resonant acoustic signals. The filtered signals are then amplified with low-noise voltage pre-amplifiers before being mixed together. Due to the bandpass filtering at 1.7 kHz, only the photoacoustic signals at fundamental frequency around 1.7 kHz are recorded and processed.
A single-beam high-power RGB continuous-wave DPSS laser (RGB-473/532/671, Opto Engine LLC), with outputs at 473 nm (150 mW), 532 nm (300 mW), and 671 nm (200 mW), is used as the light source of the RGB-DPAS instrument. This laser has superb beam quality in terms of beam size and divergence (beam diameter at the aperture ∼1 mm and beam divergence at full angle <1.5 mrad) to meet the design requirements of the DPAS apparatus (beam diameter <3 mm at 1 m optical length). As shown in , the three laser beams are collimated and merged into a single light beam via dichroic mirrors before passing through both photoacoustic cells.
To establish the multi-frequency amplitude modulation scheme on the RGB laser, we measure the acoustic profile of both the sample and reference photoacoustic cells from 1500 to 1800 Hz in intervals of 10 Hz by introducing a sound wave from a compact speaker operating at a constant power level. The obtained acoustic profiles are presented in . This was based on a single set of measurements for each cell, so there are no error bars on the measurements. Acoustic profiles of both the sample and reference cells are similar, with maximum responses of comparable intensity around 1655 ± 5 Hz. We define the quality factor of the photoacoustic cell, Q, as the ratio of peak frequency (λmax) to the full-width-at-half-maximum (FWHM). As shown in , for the RGB-DPAS system, fmax = 1655 Hz. Further, using the result at the lowest tested frequency (1500 Hz) to establish an approximate baseline, we estimate FWHM = 110 Hz. Thus, Q = 1655 Hz/110 Hz = 15.
Figure 2. Acoustic profile of the two photoacoustic cells inside the RGB-DPAS instrument from 1500 to 1800 Hz.
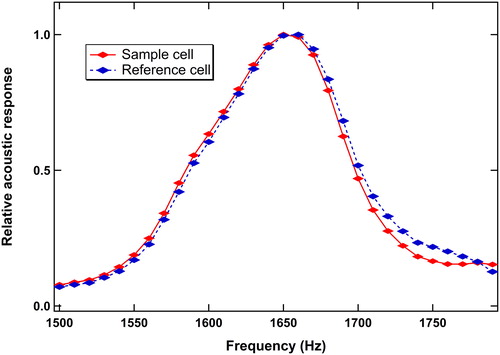
From 1640 to 1665 Hz, the relative acoustic responses of both cells vary less than 5% from the maximum. Thus, for the RGB-DPAS system, modulation frequencies are set within this range. Specifically, the 671 nm laser is modulated at 1642 Hz, the 532 nm laser at 1652 Hz, and the 473 nm laser at 1659 Hz. The uneven frequency difference at three wavelengths is specifically designed to minimize the negative influences of beat frequencies on the photoacoustic measurements. In this case, the beat frequencies occur at 10 Hz and 7 Hz in first order as well as 3 Hz and 17 Hz in second order. Although the differences in relative acoustic response at the modulated frequencies are small, all the photoacoustic signals in voltage at each wavelength were corrected by the measured relative acoustic response for the photoacoustic cell.
To modulate the RGB laser precisely and stably, a square-wave Transistor-Transistor Logic (TTL) output from a custom-designed function generator is connected to the laser DC power supply. The frequency of the TTL output is locked at the targeted laser modulation frequency. As demonstrated in , at the end of the optical pass, a fast-response blue-enhanced Si photovoltaic detector is used to monitor the laser output. An optical density (OD) = 2 neutral density filter is placed in front of the photodetector to prevent signal saturation. Unlike the photoacoustic signals, of which all the harmonic components rather than the fundamental are filtered out via the analog data processing, signals of the photodiode contain the information at all the harmonic frequencies, which can be expressed as the following:
(1)
(1)
Here, I(t) is the time-dependent photodiode signal obtained at the sampling rate of 50 kHz; ω1, ω2, and ω3 are the modulation frequencies at each wavelength; Ak, Bk, Ck, αk, βk, and γk are the fitting parameters at the kth harmonic frequency. In the next section, we will describe in detail the determination of each harmonic component from the photodetector measurements via digital signal processing.
By monitoring the laser output under amplitude modulation over a long period of time, we find that, over 24 h, variation in modulation frequency at each wavelength is less than 0.03 Hz and variation in relative laser output is less than 3%. We use a square waveform for the modulation at each wavelength. Because of the slow tuning rate of the RGB DPSS laser, the laser output under modulation has duty cycle under 50% and also depends on the wavelengths. For instance, at 671 nm, the normal laser power is 200 mW, but under 50% square waveform modulation, we find the output laser power is only 86 mW. The measured laser output power at each wavelength is listed in . Thus, for this study, prior to starting experimental data collection, we use a high sensitivity thermal laser sensor from Ophir to measure the absolute laser output at each wavelength. During experimental data collection, we use the Si photodetector to monitor stability (<1% over 8 h) and modulation frequency of the RGB laser.
Table 1. The measured total laser power (Itotal) and calculated laser power of fundamental frequency (I1) at each wavelength.
Data acquisition for the RGB-DPAS system is carried out via a fast-response and high-resolution DAQ device (model USB-2404-10 from Measurement Computing; 24-bit digital resolution, 50 kHz sampling rate), in which an analog-to-digital converter (ADC) is used to convert the analog voltage outputs from the PCB and Si photodetector into 24 bit-resolution digital outputs for digital signal processing.
Since we have demonstrated the feasibility of the DPAS apparatus in measuring PM absorption in the presence of high-concentration gaseous light-absorbing species in a previous publication (Yu et al. Citation2017), this study focuses our efforts on presenting the linear correlation between the power-normalized photoacoustic signal responses of the RGB-DPAS instrument at three wavelengths and the number concentration of air-borne Regal 400 R particles (which are used as the calibration surrogate in this study, avoiding introduction of any light-absorbing gaseous species).
Signal processing
Instead of using the analog phase-sensitive detection scheme conventionally applied with photoacoustic signals, we utilized least-squares (LS) analysis to extract signal parameters from the digitized signal. This LS approach is readily generalized to handle signals with frequency-division multiplexing, as is the case for the three-color signal considered here.
Before measurements were made, a frequency calibration step was performed. For this calibration, a 20 s sample of photodiode signal was analyzed through a non-linear least squares approach. The analysis used the Levenberg–Marquardt algorithm to determine the three frequencies from the photodiode measurements that minimize the sum of squared errors. The optimization function determines the squared error based on linear least-squares (via matrix algebra) to solve for amplitudes/phases with specified frequencies. In the context of a single sinusoidal signal, such a linear least-squares fit (with fixed frequency) is often termed a “three-parameter sine-fit” in the digital signal processing literature, while the non-linear case (with variable frequency) is correspondingly denoted as a “four-parameter sine fit” (e.g. Negusse et al. Citation2014). However, when extended to the three-sinusoid multiplexed signal considered here (possibly with overtones, as well), this terminology is no longer applicable, based on the number of parameters being fit.
The three modulation frequencies estimated by this method were then used in subsequent linear least-squares analysis of microphone signals from the sample cell and reference cell during measurements. For this analysis, at one second intervals, a linear least squares analysis was used to determine phases and amplitudes of each of the sinusoids associated with each frequency (in addition to an overall DC offset). The fitting model considered first harmonic (fundamental) and second harmonic contributions to the waveform. Second harmonic contributions to the photoacoustic signal (and, to an even greater degree, higher harmonic contributions) are expected to be negligible, due to the use of the band-pass filter in analog signal “preprocessing”. Analysis was based on the previous 131072 datapoints (2.6 s) from each cell, with the sample number chosen as a power of two to facilitate efficient Fast Fourier Transform (FFT) of the data (used separately for instrument monitoring and diagnostic purposes). (In principle, FFT could also be applied directly for signal analysis, but the modulation frequencies would each need to correspond to a near-integer number of cycles within the analysis window, in order for the results to be accurate.) The amplitude values associated with the fundamental were then recorded as the RGB-DPAS measurement signal response in real-time. These digital signal processing algorithms were implemented in a graphical user interface (GUI) software package, enabling real-time monitoring and logging of the absorption signal associated with each of the three frequencies.
Normalization of photoacoustic signal responses
The square-wave amplitude modulation on the DC power supplies of the RGB laser results in a waveform laser output that contains components of many other harmonic frequencies in addition to that of the fundamental frequency. We expect that photoacoustic effects due to laser output components at higher harmonic frequencies do not contribute to the photoacoustic signals at the fundamental frequency, which is what we measure from the PM light absorption. Given the Nyquist frequency associated with the 50 kHz sampling rate, the non-linear least-squares analysis discussed above allows us to determine the laser power contributions up to the 15th harmonic frequency (24.9 kHz for the highest of the three modulation frequencies). If we assume negligible higher harmonic contributions, we can then use the Si photodetector signal to obtain a good estimate of the total harmonic distortion (THD) at each wavelength, representing the ratio of the sum of the power of all the harmonic components to the power of the fundamental frequency:
(2)
(2)
Contributions to the sum in EquationEquation (2)(2)
(2) from the highest harmonics considered were negligible compared to the total (<0.01%). Taking into account decaying contributions from higher harmonics associated with a convergent Fourier series, these results are consistent with the assumption of negligible contributions from the higher harmonics that were not considered. Therefore, in combination with the total laser power measurements using the thermal laser sensor, we are able to determine the laser power of the fundamental frequency at each wavelength as:
(3)
(3)
The results of total laser power (Itotal), THD, and laser power of the fundamental frequency (I1) at each wavelength are listed in .
Recently, in their development of a single-cavity three-wavelength photoacoustic spectrometer, Linke et al. (Citation2016) demonstrated that the photoacoustic signal, PA (in voltage), can be expressed as:
(4)
(4)
Here, babs is the aerosol absorption coefficient (m−1), Plaser is the laser power (W), and ccell is the cell constant (VW−1m). Photoacoustic effects due to higher harmonic contributions to the laser waveform do not contribute to the photoacoustic signals at the fundamental frequency for the RGB-DPAS system. Therefore, the laser power (Plaser) in EquationEquation (3)(3)
(3) should be replaced by the laser power of the fundamental frequency (I1). Thus, PA of the RGB-DPAS system at each wavelength is normalized with the I1 values listed in . The obtained values of photoacoustic signal responses after power normalization, in units of VW−1, are defined as the normalized signal responses (NSR) of the RGB-DPAS spectrometer. NSR can be expressed as the following:
(5)
(5)
The cell constant, ccell, is a function of the total optical length, the response of the microphone, and acoustic properties of the resonance cell (Miklós et al. Citation2001). After the correction of small variations (<5%) in relative acoustic response with respect to the modulation frequencies, the single-pass RGB-DPAS measurements should have identical cell constants at each wavelength since all the relevant instrumental parameters are the same. According to EquationEquation (3)(3)
(3) , to determine aerosol absorption (babs) at each wavelength, it is necessary to calibrate the instrument to determine the cell constant using a known absorption coefficient at one of the three operating wavelengths.
Calibration of normalized RGB-DPAS signal responses
In this study, a particle-based approach is applied for the calibration of the RGB-DPAS signal responses after being normalized with the laser power of fundamental frequency at each wavelength. During the calibration procedure, a stable flow of air-borne synthetic pigment black particles (Regal 400 R from Cabot Corp., Boston, MA, USA) is produced via pneumatic generation of an aqueous suspension using particle-free dry air. Thus, no light-absorbing gaseous species are present in the sample. The aqueous suspension concentration of Regal 400 R was set such that doubly-charged particles constituted less than 10% of total particle mass, as previously investigated by Willis et al. (Citation2014). Characterization of the Regal 400 R particles has been performed by Onasch et al. (Citation2012) and Gysel et al. (Citation2012). They found that the atomized Regal 400 R particles were highly compact in shape, with a mass-mobility exponent Dfm ∼ 3. The effective density of 350 nm particles is approximately 0.9 g/cm3. In this study, we assume that the mass absorption coefficient (MAC) of the Regal 400 R sample at 532 nm is 7.75 m2g−1 extrapolated from the suggested value of 7.5 m2g−1 at 550 nm (Bond and Bergstrom Citation2006). Recently, You et al. (Citation2016) carried out a more detailed characterization on another synthetic carbon black (Cab-O-Jet 200, also from Cabot Corp., Boston, MA, USA). Both carbon blacks are generated from furnace combustion process, with a slight difference in surface modification. Based on TEM images, the Cab-O-Jet 200 particles have a compact, spherical morphology comprised of 30 nm monomers, similar to the Regal 400 R particles. The measured Dfm = 2.83 ± 0.01, consistent with the nearly spherical shape observed in TEM images and the previous measurements of Regal 400 by Onasch et al. (Citation2012). In the study, You et al. also determined that the MAC at 550 nm is (7.89 ± 0.25) m2 g−1 and the AAE is 1.03 ± 0.09 over the spectral range of 550–840 nm, in agreement with the averaged MAC value of (7.5 ± 1.2) m2 g−1 by Bond and Bergstrom (Citation2006). A recent study by Zangmeister and Radney (Citation2018) indicated that for the synthetic carbon black particles at Dm ≥350 nm, the MAC approached an asymptotic limit of 7 m2 g−1 at 532 nm. Thus, we assume the MAC of the double-charged (q2) particles is the same as the single-charged (q1) particles. The impact of the q2 particles on the RGB-DPAS signal responses should be less than 10%.
The air-borne particle flow is passed through a 50-cm-long drying column filled with silica gel desiccant to remove water content including both gaseous and particle bound water in the flow. It is then size-selected by an Electrostatic Classifier (Model 3080 from TSI with a Model 3081 long DMA (differential mobility analyzer)) at a mobility diameter (Dp) of 350 nm. The size selection by DMA is based upon particle electrical mobility (and net positive charge) and not necessarily a physical size unless spherical particles are being measured (Knutson and Whitby Citation1975). A condensation particle counter (CPC, Model 3776 from TSI) is used to measure the particle number concentrations in the sample flow, while particle absorption at 473 nm, 532 nm, and 671 nm is measured by the RGB-DPAS spectrometer at the same time. In the CPC measurements, the particle number concentration is defined as particle count/(flow rate × time).
The data processing of the raw alternating current (AC) photoacoustic signals includes analog signal filtering and amplification, digital signal analysis, and the normalization of photoacoustic signal responses. After processing, the NSRs of the RGB-DPAS spectrometer are determined from the original AC photoacoustic signals. The obtained NSR results are presented in , in comparison with the particle concentrations from the simultaneous CPC measurements. Both measurements are performed at 1 s time resolution in this study. Since the ability of the synthetic Regal Black to stay suspended in water is poor, it is difficult to maintain the sample concentrations at a stable level over an appreciable period of time. On the other hand, such a variation in sample concentration provides a large response scale for the real-time RGB-DPAS measurements. We note that an instrumental zeroing procedure was applied to the dataset, wherein the background non-PM photoacoustic signal responses were subtracted from the PM sample signal responses. This zeroing procedure resulted in the near-zero intercepts seen in . The intercepts were not statistically significant based on the standard errors of the fits.
Figure 3. The obtained normalized signal responses (NSR) of the RGB-DPAS measurements on Dp = 350 nm Regal 400 particles, in comparison with the CPC measurements.
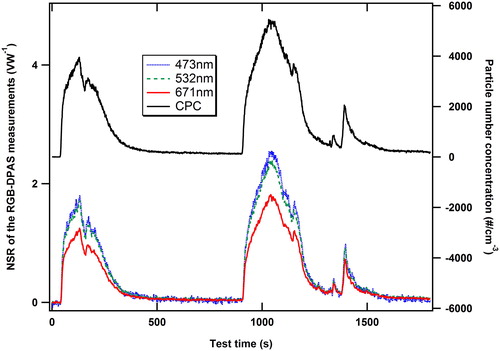
Figure 4. Linear correlation plots of the RGB-DPAS measurements at 671 nm (red), 532 nm (green), and 473 nm (blue) vs. the CPC measurements on Dp = 350 nm Regal 400 particles.
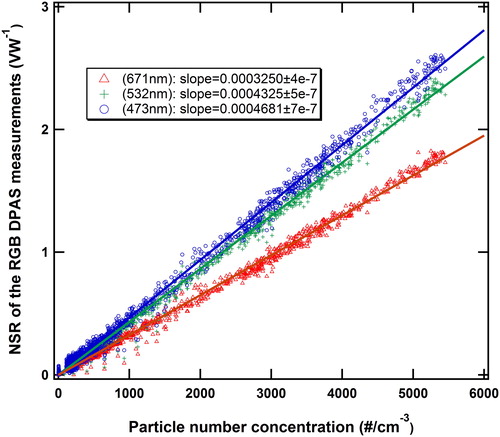
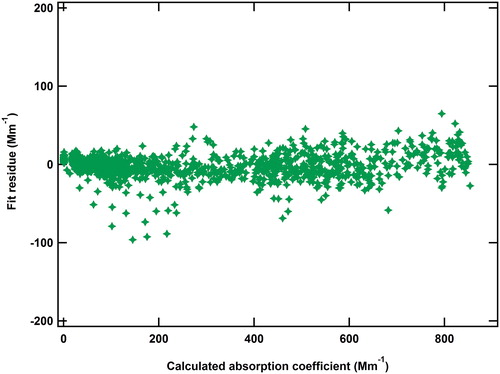
To better illustrate the correlation between the NSR results from the RGB-DPAS measurements and particle concentrations from the CPC, the NSR results at each wavelength are presented in correlation plots with the particle concentrations, as shown in . At each wavelength, the calculated correlation coefficient from the linear fit, R2, is larger than 0.99, indicative of an excellent linear correlation between the RGB-DPAS and CPC measurements. It also demonstrates a good linearity of the RGB-DPAS signal response from PM light absorption in the visible spectral range over a large dynamic range. In , we present the residuals of linear fit (in Mm−1) vs. the calculated absorption coefficients from the Regal 400 R particles at 532 nm. A histogram analysis on the residuals of the linear fit at each wavelength indicates that the fit residual distributions are symmetric. Outliers on this plot are associated with transients, for which the response times of the two instruments are somewhat different.
Figure 5. Residuals of the linear fit vs. the calculated absorption coefficients of the Regal 400R particles at 532 nm.
The absorption Ångström exponent (AAE), which represents wavelength dependence of aerosol absorption, is an important optical property of atmospheric aerosols (Bergstrom et al. Citation2007; Russell et al. Citation2010). AAE of atmospheric aerosols is normally determined by the linear fit between logarithms of aerosol absorption coefficients and wavelengths, as shown in the following (Liu et al. Citation2018):
(6)
(6)
Here, C is a constant, λ is the optical wavelength, and babs is the aerosol absorption coefficient at the wavelength. As expressed in EquationEquation (2)(2)
(2) , babs can be calculated as NSR/ccell. Thus, EquationEquation (4)
(4)
(4) becomes
(7)
(7)
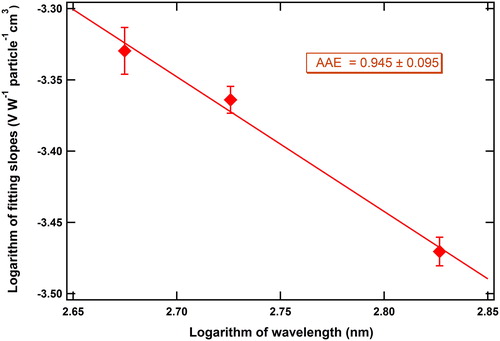
For the RGB-DPAS measurements, ccell is a constant. Therefore, one of the technical advantages of the single-pass RGB DPAS measurement is the direct determination of AAE via a linear correlation of log(NSR) vs. log(λ). The photoacoustic signal response requires no calibration, since the measured aerosol sample concentrations are the same and the cell constant is independent of wavelength. The logarithm correlation plot between NSR and wavelength from the RGB-DPAS measurement on the Regal 400 R samples is shown in . For the Regal 400 R sample, we determine that its AAE is 0.945 ± 0.095 based on the linear fit of log (fitting slope) vs. log(λ) in the visible spectral range of 473 nm to 671 nm. This result is consistent with the AAE measurement of 1.03 ± 0.09 by You et al. (Citation2016) on a similar carbon black sample, as well as the theoretical prediction on aggregates of small Rayleigh scatterers by Moosmüller and Arnott (Citation2009).
Figure 6. Determination of AAE from the RGB-DPAS measurements on Dp = 350 nm Regal 400 particles, without signal response calibration.
To calibrate the RGB-DPAS instrument and convert the measured NSR into aerosol absorption coefficient, we assume that the mass absorption coefficient of the Regal 400 R sample at 532 nm is 7.75 m2g−1 extrapolated from the suggested value of 7.5 m2g−1 at 550 nm (Bond and Bergstrom Citation2006), the determined AAE of 0.945. The cell constant of the RGB-DPAS spectrometer, ccell, is then calculated by using EquationEquation (5)(5)
(5) . In the calculation, we use the measured effective density of 0.9 g cm−3 for the 350 nm Regal 400 R particles, which was obtained from the previous studies (Gysel et al. Citation2012; Onasch et al. Citation2012), to calculate absorption coefficient per particle. The linear fit, shown in , yields a fitting parameter of 0.0004325 ± 0.0000005 VW−1particle−1 at 532 nm. The noted uncertainty comes from the fitting process without taking the uncertainty of each data point into account. Using EquationEquation (5)
(5)
(5) , we then determine that the cell constant of the RGB-DPAS spectrometer is 2762 ± 7 VW−1m. The value of the cell constant is dependent on the quality of photoacoustic cells, but it is also sensitive to the gains due to analog signal bandpass filtering and amplification during the analog electronic processing. For instance, Linke et al. (Citation2016) reported a cell constant of 78,518 ± 1123 VW−1m for their single-cavity three-wavelength photoacoustic spectrometer, with the sensitivity setting of the phase sensitive detection at an arbitrary level of 6. Using the determined cell constant of 2762 ± 7 VW−1m, the NSR results of the RGB-DPAS measurements in units of VW−1 can be linearly converted into aerosol absorption coefficients in units of m−1 or Mm−1 following EquationEquation (5)
(5)
(5) . It should be noted that this method of calibration also incurs the uncertainties on the measured particle concentrations from the CPC and the assumptions about the MAC and density of Regal 400 R particles, which are not represented in the quoted uncertainty of cell constant.
Sensitivity analysis
After the signal response of the RGB-DPAS device at each wavelength is calibrated, as described above, Allan variance analysis is performed to determine the detection limit and signal stability (Allan Citation1966). Allan analysis has been used as a standard technique to characterize frequency stability and detection sensitivity of many atmospheric measurement instruments (Werle et al. Citation1993; Li et al. Citation2012; Dyroff et al. Citation2014). In this approach, particle-free dry air is flowed continuously through the entire RGB-DPAS instrument system, including both the sample and reference photoacoustic cells, over 10 h. The PCB, which contains the microphone array and analog signal processing components, warms up to about 40 °C during the measurement, and the corresponding instrument warm-up period is normally about one hour. The PCB is not thermally conductive, and the temperature of the photoacoustic cell is always maintained at the ambient temperature. The obtained photoacoustic signals in voltage are transformed into the NSR results at each wavelength, which are then converted into absorption coefficients by applying the obtained cell constant. Using the measurement results, which are obtained at a time resolution of 1 s, we calculated the Allan variance (σ2) as a function of integrating time, in order to characterize the signal stability. The Allan deviation (σ), which is the square-root of Allan variance, is thus determined for a variety of integration times. This value can be considered as a representative of instrumental detection sensitivity. In this study, we use the determined 2σ at 100 s integrating time as the detection limit of the RGB-DPAS spectrometer.
The obtained Allan plot for the RGB-DPAS measurements at each wavelength is shown in . The Allan analysis indicates that the optimal integration time of the RGB-DPAS instrument to produce the lowest inter-sample variance is 800 s at each wavelength. Using 2σ as the detection limit criterion, based on the Allan analysis, we determine an instrument detection limit of 0.20 Mm−1 (at 671 nm), 0.22 Mm−1 (at 532 nm) and 0.90 Mm−1 (at 473 nm) in 100 s data integration for the RGB-DPAS measurements on PM light absorption. Since the limits provided by the Allan analysis are only theoretical and susceptible to underestimation, we also calculate the standard deviations of the entire RGB-DPAS measurements on particle-free dry air, which are 0.86 Mm−1 (at 671 nm), 1.1 Mm−1 (at 532 nm), and 2.8 Mm−1 (at 473 nm). Applying the 2σ criteria, we could determine the upper bound of the detection limit as 1.7 Mm−1 (at 671 nm), 2.2 Mm−1 (at 532 nm), and 5.6 Mm−1 (at 473 nm).
Figure 7. Allan deviation plots of the RGB-DPAS measurements at 671 nm (red), 532 nm (green), and 473 nm (blue).
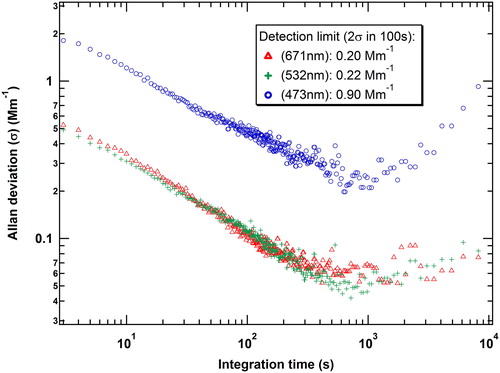
We note that the low detection sensitivity at 473 nm, compared to those at 671 nm and 532 nm, may be associated with the lower laser power and the higher total harmonic distortion at this wavelength. As listed in , laser power of the fundamental frequency at 473 nm is merely 23 mW, compared to 84 mW at 532 nm and 69 mW at 671 nm.
Summary and conclusion
We have presented a new measurement technique, RGB-DPAS, which is capable of synchronous, real-time monitoring of atmospheric aerosol light absorption at three wavelengths spanning the visible spectral range. By using analog and digital data processing approaches, photoacoustic signal responses from PM light absorption at 671 nm, 532 nm, and 473 nm are simultaneously obtained from the single-pass differential photoacoustic system. After calculating total harmonic distortion, the signal responses can be normalized through determination of laser power at the fundamental frequency. The normalized signal responses (NSR) are linearly related to the critical measurement parameters: PM absorption coefficients. Since the optical pass, signal processing, and cell parameters (<0.2% variability in physical dimensions) are nearly identical for the RGB-DPAS measurements at each of the three wavelengths, we are able to determine AAE of the PM sample from the NSR directly, without any calibration of photoacoustic signal responses. In addition, using synthetic carbon black nanoparticles as PM calibration surrogate with assumptions on its mass absorption coefficient at 532 nm and negligible contribution from the doubly charged particles, we are able to show the proportionality of the NSR to the particle number concentrations at a mobility diameter of 350 nm. Thus, the cell constant for the RGB-DPAS instrument can be calculated. Based on the calculated cell constant, the NSR at each wavelength can then be converted into a corresponding absorption coefficient.
Allan variance analysis of data acquired over 10 h determined that the detection limits (2σ) of the RGB-DPAD instrument in a 100 s data acquisition are: 0.20 Mm−1 (671 nm), 0.22 Mm−1 (532 nm), and 0.90 Mm−1 (473 nm), respectively.
Acknowledgments
The authors thank Dr Andy Freedman of Aerodyne Research, Inc., Dr Richard Moore and Dr Bruce Anderson of NASA Langley Research Center, Mr David Liscinsky and Dr Jordan Schneider of United Technologies Research Center for helpful discussions.
Disclosure statement
Aerodyne Research, Inc. (ARI) developed and commercialized the RGB-DPAS instrument used in this study. Z. Y., G. M., W. B., and R. M.-L. are ARI employees who earn stock by participating in the company’s Employee Stock Ownership Plan (ESOP), in addition some may also directly own ARI stock.
Additional information
Funding
References
- Allan, D. W. 1966. Statistics of atomic frequency standards. Proc. IEEE 54(2):221–230. doi: 10.1109/PROC.1966.4634.
- Arnott, W. P., B. Zielinska, C. F. Rogers, J. Sagebiel, K. Park, J. Chow, H. Moosmüller, J. G. Watson, K. Kelly, D. Wagner, et al. 2005. Evaluation of 1047-nm photoacoustic instruments and photoelectric aerosol sensors in source-sampling of black carbon aerosol and particle-bound pAHs from gasoline and diesel powered vehicles. Environ. Sci. Technol. 39:5398–5406. doi: 10.1021/es049595e.
- Arnott, W. P., H. Moosmu¨Ller, and J. W. Walker. 2000. Nitrogen dioxide and kerosene-flame soot calibration of photoacoustic instruments for measurement of light absorption by aerosols. Rev. Sci. Instrum. 71(12):4545–4552. doi: 10.1063/1.1322585.
- Arnott, W. P., H. Moosmüller, P. J. Sheridan, J. A. Ogren, R. Raspet, W. V. Slaton, J. L. Hand, S. M. Kreidenweis, and J. L. Collett. 2003. Photoacoustic and filter-based ambient aerosol light absorption measurements: Instrument comparisons and the role of relative humidity. J. Geophys. Res: Atmos. 108:AAC 15-11–AAC 15-11. doi: 10.1029/2002JD002165.
- Arnott, W. P., K. Hamasha, H. Moosmüller, P. J. Sheridan, and J. A. Ogren. 2005. Towards aerosol light-absorption measurements with a 7-wavelength aethalometer: Evaluation with a photoacoustic instrument and 3-wavelength nephelometer. Aerosol Sci. Technol. 39(1):17–29. doi: 10.1080/027868290901972.
- Bacis, R., A. J. Bouvier, and J. M. Flaud. 1998. The ozone molecule: Electronic spectroscopy. Spectrochim. Acta A: Mol. Biomol. Spectrosc. 54(1):17–34. doi: 10.1016/S1386-1425(97)00259-X.
- Ball, S. M., and R. L. Jones. 2003. Broad-band cavity ring-down spectroscopy. Chem. Rev. 103(12):5239–5262. doi: 10.1021/cr020523k.
- Baumgardner, D., O. Popovicheva, J. Allan, V. Bernardoni, J. Cao, F. Cavalli, J. Cozic, E. Diapouli, K. Eleftheriadis, P. J. Genberg, et al. 2012. Soot reference materials for instrument calibration and intercomparisons: A workshop summary with recommendations. Atmos. Meas. Tech. 5(8):1869–1887. doi: 10.5194/amt-5-1869-2012.
- Bergstrom, R. W., P. Pilewskie, P. B. Russell, J. Redemann, T. C. Bond, P. K. Quinn, and B. Sierau. 2007. Spectral absorption properties of atmospheric aerosols. Atmos. Chem. Phys. 7(23):5937–5943. doi: 10.5194/acp-7-5937-2007.
- Bluvshtein, N., J. M. Flores, Q. He, E. Segre, L. Segev, N. Hong, A. Donohue, J. N. Hilfiker, and Y. Rudich. 2017. Calibration of a multi-pass photoacoustic spectrometer cell using light-absorbing aerosols. Atmos. Meas. Tech. 10(3):1203–1213. doi: 10.5194/amt-10-1203-2017.
- Bond, T. C., and R. W. Bergstrom. 2006. Light absorption by carbonaceous particles: An investigative review. Aerosol Sci. Technol. 40(1):27–67. doi: 10.1080/02786820500421521.
- Brion, J., A. Chakir, J. Charbonnier, D. Daumont, C. Parisse, and J. Malicet. 1998. Absorption spectra measurements for the ozone molecule in the 350–830 nm region. J. Atmos. Chem. 30(2):291–299. doi: 10.1023/a:1006036924364.
- Burkholder, J. B., and R. K. Talukdar. 1994. Temperature dependence of the ozone absorption spectrum over the wavelength range 410 to 760 nm. Geophys. Res. Lett. 21(7):581–584. doi: 10.1029/93GL02311.
- Burrows, J. P., A. Dehn, B. Deters, S. Himmelmann, A. Richter, S. Voigt, and J. Orphal. 1998. Atmospheric remote-sensing reference data from GOME: Part I. Temperature-dependent absorption cross-sections of NO2 in the 231–794 nm range. J. Quant. Spectr. Radiat. Transfer 60(6):1025–1031. doi: 10.1016/S0022-4073(97)00197-0.
- Burrows, J. P., A. Richter, A. Dehn, B. Deters, S. Himmelmann, S. Voigt, and J. Orphal. 1999. Atmospheric remote-sensing reference data from GOME: 2. Temperature-dependent absorption cross sections of O3 in the 231–794 nm range. J. Quantit. Spectrosc. Radiat. Transfer 61(4):509–517. doi: 10.1016/S0022-4073(98)00037-5.
- Cappa, C. D., T. B. Onasch, P. Massoli, D. R. Worsnop, T. S. Bates, E. S. Cross, P. Davidovits, J. Hakala, K. L. Hayden, B. T. Jobson, et al. 2012. Radiative absorption enhancements due to the mixing state of atmospheric black carbon. Science 337(6098):1078–1081. doi: 10.1126/science.1223447.
- Carslaw, K. S., O. Boucher, D. V. Spracklen, G. W. Mann, J. G. L. Rae, S. Woodward, and M. Kulmala. 2010. A review of natural aerosol interactions and feedbacks within the earth system. Atmos. Chem. Phys. 10(4):1701–1737. doi: 10.5194/acp-10-1701-2010.
- Cremer, J. W., P. A. Covert, E. A. Parmentier, and R. Signorell. 2017. Direct measurement of photoacoustic signal sensitivity to aerosol particle size. J. Phys. Chem. Lett. 8(14):3398–3403. doi: 10.1021/acs.jpclett.7b01288.
- Davies, N. W., M. I. Cotterell, C. Fox, K. Szpek, J. M. Haywood, and J. M. Langridge. 2018. On the accuracy of aerosol photoacoustic spectrometer calibrations using absorption by ozone. Atmos. Meas. Tech. 11(4):2313–2324. doi: 10.5194/amt-11-2313-2018.
- Dyroff, C., A. Zahn, S. Sanati, E. Christner, A. Rauthe-Schöch, and T. J. Schuck. 2014. Tunable diode laser in-situ CH4 measurements aboard the CARIBIC passenger aircraft: Instrument performance assessment. Atmos. Meas. Tech. 7(3):743–755. doi: 10.5194/amt-7-743-2014.
- Fischer, D. A., and G. D. Smith. 2018. A portable, four-wavelength, single-cell photoacoustic spectrometer for ambient aerosol absorption. Aerosol Sci. Technol. 52(4):393–406. doi: 10.1080/02786826.2017.1413231.
- Gillis, K. A., D. K. Havey, and J. T. Hodges. 2010. Standard photoacoustic spectrometer: Model and validation using O2 A-band spectra. Rev. Sci. Instrum. 81(6):064902. doi: 10.1063/1.3436660.
- Gysel, M., M. Laborde, A. A. Mensah, J. C. Corbin, A. Keller, J. Kim, A. Petzold, and B. Sierau. 2012. Technical note: The single particle soot photometer fails to reliably detect PALAS soot nanoparticles. Atmos. Meas. Tech. 5(12):3099–3107. doi: 10.5194/amt-5-3099-2012.
- Haisch, C., P. Menzenbach, H. Bladt, and R. Niessner. 2012. A wide spectral range photoacoustic aerosol absorption spectrometer. Anal. Chem. 84(21):8941–8945. doi: 10.1021/ac302194u.
- Hearn, A. G. 1961. The absorption of ozone in the ultra-violet and visible regions of the spectrum. Proc. Phys. Soc. 78(5):932. doi: 10.1088/0370-1328/78/5/340.
- Knutson, E. O., and K. T. Whitby. 1975. Aerosol classification by electric mobility: Apparatus, theory, and applications. J. Aerosol Sci. 6(6):443–451. doi: 10.1016/0021-8502(75)90060-9.
- Lack, D. A., E. R. Lovejoy, T. Baynard, A. Pettersson, and A. R. Ravishankara. 2006. Aerosol absorption measurement using photoacoustic spectroscopy: Sensitivity, calibration, and uncertainty developments. Aerosol Sci. Technol. 40(9):697–708. doi: 10.1080/02786820600803917.
- Lack, D. A., M. S. Richardson, D. Law, J. M. Langridge, C. D. Cappa, R. J. McLaughlin, and D. M. Murphy. 2012. Aircraft instrument for comprehensive characterization of aerosol optical properties, part 2: Black and brown carbon absorption and absorption enhancement measured with photo acoustic spectroscopy. Aerosol Sci. Technol. 46(5):555–568. doi: 10.1080/02786826.2011.645955.
- Langridge, J. M., M. S. Richardson, D. A. Lack, C. A. Brock, and D. M. Murphy. 2013. Limitations of the photoacoustic technique for aerosol absorption measurement at high relative humidity. Aerosol Sci. Technol. 47(11):1163–1173. doi: 10.1080/02786826.2013.827324.
- Lewis, K., W. P. Arnott, H. Moosmüller, and C. E. Wold. 2008. Strong spectral variation of biomass smoke light absorption and single scattering albedo observed with a novel dual-wavelength photoacoustic instrument. J. Geophys. Res.: Atmos. 113:D16203. doi: 10.1029/2007JD009699.
- Li, J., U. Parchatka, R. Königstedt, and H. Fischer. 2012. Real-time measurements of atmospheric CO using a continuous-wave room temperature quantum cascade laser based spectrometer. Opt. Express 20(7):7590–7601. doi: 10.1364/OE.20.007590.
- Li, Z., X. Xia, M. Cribb, W. Mi, B. Holben, P. Wang, H. Chen, S.-C. Tsay, T. F. Eck, F. Zhao, et al. 2007. Aerosol optical properties and their radiative effects in Northern china. J. Geophys. Res.: Atmos. 112:D22S01. doi: 10.1029/2006JD007382.
- Linke, C., I. Ibrahim, N. Schleicher, R. Hitzenberger, M. O. Andreae, T. Leisner, and M. Schnaiter. 2016. A novel single-cavity three-wavelength photoacoustic spectrometer for atmospheric aerosol research. Atmos. Meas. Tech. 9(11):5331–5346. doi: 10.5194/amt-9-5331-2016.
- Liu, C., C. E. Chung, Y. Yin, and M. Schnaiter. 2018. The absorption ångström exponent of black carbon: From numerical aspects. Atmos. Chem. Phys. 18(9):6259–6273. doi: 10.5194/acp-18-6259-2018.
- Miklós, A., and P. Hess. 2000. Modulated and pulsed photoacoustics in trace gas analysis. Anal. Chem. 72(1):30A–37A. doi: 10.1021/ac002681m.
- Miklós, A., P. Hess, and Z. Bozóki. 2001. Application of acoustic resonators in photoacoustic trace gas analysis and metrology. Rev. Scient. Instr. 72(4):1937–1955. doi: 10.1063/1.1353198.
- Molina, L. T., and M. J. Molina. 1986. Absolute absorption cross sections of ozone in the 185- to 350-nm wavelength range. J. Geophys. Res.: Atmos. 91(D13):14501–14508. doi: 10.1029/JD091iD13p14501.
- Montilla, E., S. Mogo, V. Cachorro, J. Lopez, and A. de Frutos. 2011. Absorption, scattering and single scattering albedo of aerosols obtained from in situ measurements in the subarctic coastal region of Norway. Atmos. Chem. Phys. Discuss 2011:2161–2182. doi: 10.5194/acpd-11-2161-2011.
- Moosmüller, H., and W. P. Arnott. 2009. Particle optics in the Rayleigh regime. J. Air Waste Manage. Assoc. 59:1028–1031. doi: 10.3155/1047-3289.59.9.1028.
- Moosmüller, H., R. K. Chakrabarty, and W. P. Arnott. 2009. Aerosol light absorption and its measurement: A review. J. Quant. Spectr. Radiat. Transfer 110(11):844–878. doi: 10.1016/j.jqsrt.2009.02.035.
- Murphy, D. M. 2009. The effect of water evaporation on photoacoustic signals in transition and molecular flow. Aerosol Sci. Technol. 43(4):356–363. doi: 10.1080/02786820802657392.
- Nakayama, T., H. Suzuki, S. Kagamitani, Y. Ikeda, A. Uchiyama, and Y. Matsumi. 2015. Characterization of a three wavelength photoacoustic soot spectrometer (PASS-3) and a photoacoustic extinctiometer (PAX). J. Meteorol. Soc. Jpn. 93(2):285–308. doi: 10.2151/jmsj.2015-016.
- Negusse, S., P. Händel, and P. Zetterberg. 2014. IEEE-STD-1057 three parameter sine wave fit for SNR estimation: Performance analysis and alternative estimators. IEEE Trans. Instrum. Meas. 63(6):1514–1523. doi: 10.1109/TIM.2013.2293226.
- O’Keefe, A., and D. A. G. Deacon. 1988. Cavity ring‐down optical spectrometer for absorption measurements using pulsed laser sources. Rev. Sci. Instrum. 59:2544–2551. doi: 10.1063/1.1139895.
- Onasch, T. B., A. Trimborn, E. C. Fortner, J. T. Jayne, G. L. Kok, L. R. Williams, P. Davidovits, and D. R. Worsnop. 2012. Soot particle aerosol mass spectrometer: Development, validation, and initial application. Aerosol Sci. Technol. 46(7):804–817. doi: 10.1080/02786826.2012.663948.
- Osthoff, H. D., S. S. Brown, T. B. Ryerson, T. J. Fortin, B. M. Lerner, E. J. Williams, A. Pettersson, T. Baynard, W. P. Dubé, S. J. Ciciora, et al. 2006. Measurement of atmospheric NO2 by pulsed cavity ring-down spectroscopy. J. Geophys. Res.: Atmos. 111:D12305. doi: 10.1029/2005JD006942.
- Radney, J. G., and C. D. Zangmeister. 2015. Measurement of gas and aerosol phase absorption spectra across the visible and near-IR using supercontinuum photoacoustic spectroscopy. Anal. Chem. 87(14):7356–7363. doi: 10.1021/acs.analchem.5b01541.
- Raspet, R., W. V. Slaton, W. P. Arnott, and H. Moosmüller. 2003. Evaporation–condensation effects on resonant photoacoustics of volatile aerosols. J. Atmos. Oceanic Technol. 20(5):685–695. doi: 10.1175/1520-0426.
- Russell, P. B., R. W. Bergstrom, Y. Shinozuka, A. D. Clarke, P. F. DeCarlo, J. L. Jimenez, J. M. Livingston, J. Redemann, O. Dubovik, and A. Strawa. 2010. Absorption angstrom exponent in AERONET and related data as an indicator of aerosol composition. Atmos. Chem. Phys. 10(3):1155–1169. doi: 10.5194/acp-10-1155-2010.
- Scherer, J. J., J. B. Paul, A. O'Keefe, and R. J. Saykally. 1997. Cavity ringdown laser absorption spectroscopy: History, development, and application to pulsed molecular beams. Chem. Rev. 97(1):25–52. doi: 10.1021/cr930048d.
- Sharma, N., I. J. Arnold, H. Moosmüller, W. P. Arnott, and C. Mazzoleni. 2013. Photoacoustic and nephelometric spectroscopy of aerosol optical properties with a supercontinuum light source. Atmos. Meas. Tech. 6(12):3501–3513. doi: 10.5194/amt-6-3501-2013.
- Stier, P., J. H. Seinfeld, S. Kinne, and O. Boucher. 2007. Aerosol absorption and radiative forcing. Atmos. Chem. Phys. 7(19):5237–5261. doi: 10.5194/acp-7-5237-2007.
- Tian, G., H. Moosmüller, and W. P. Arnott. 2009. Simultaneous photoacoustic spectroscopy of aerosol and oxygen A-band absorption for the calibration of aerosol light absorption measurements. Aerosol Sci. Technol. 43(11):1084–1090. doi: 10.1080/02786820903170972.
- Vandaele, A. C., C. Hermans, S. Fally, M. Carleer, R. Colin, M.-F. Mérienne, A. Jenouvrier, and B. Coquart. 2002. High-resolution Fourier transform measurement of the NO2 visible and near-infrared absorption cross sections: Temperature and pressure effects. J. Geophys. Res.: Atmos. 107:ACH 3-1–ACH 3-12.
- Voigt, S., J. Orphal, and J. P. Burrows. 2002. The temperature and pressure dependence of the absorption cross-sections of NO2 in the 250–800 nm region measured by fourier-transform spectroscopy. J. Photochem. Photobiol. A: Chem. 149(1–3):1–7. doi: 10.1016/S1010-6030(01)00650-5.
- Werle, P., R. Mücke, and F. Slemr. 1993. The limits of signal averaging in atmospheric trace-gas monitoring by tunable diode-laser absorption spectroscopy (TDLAS). Appl. Phys. B 57(2):131–139. doi: 10.1007/bf00425997.
- Willis, M. D., A. K. Y. Lee, T. B. Onasch, E. C. Fortner, L. R. Williams, A. T. Lambe, D. R. Worsnop, and J. P. D. Abbatt. 2014. Collection efficiency of the soot-particle aerosol mass spectrometer (SP-AMS) for internally mixed particulate black carbon. Atmos. Meas. Tech. 7(12):4507–4516. doi: 10.5194/amt-7-4507-2014.
- You, R., J. G. Radney, M. R. Zachariah, and C. D. Zangmeister. 2016. Measured wavelength-dependent absorption enhancement of internally mixed black carbon with absorbing and nonabsorbing materials. Environ. Sci. Technol. 50:7982–7990. doi: 10.1021/acs.est.6b01473.
- Yu, Z., J. Assif, G. Magoon, P. Kebabian, W. Brown, W. Rundgren, J. Peck, R. Miake-Lye, D. Liscinsky, and B. True. 2017. Differential photoacoustic spectroscopic (DPAS)-based technique for PM optical absorption measurements in the presence of light absorbing gaseous species. Aerosol Sci. Technol. 51(12):1438–1447. doi: 10.1080/02786826.2017.1363866.
- Zangmeister, C. D., and J. G. Radney. 2018. NIST interlaboratory study of aerosol absorption measurements using photoacoustic spectroscopy. Technical Note 1989. doi: 10.6028/NIST.TN.1989.