
 ?Mathematical formulae have been encoded as MathML and are displayed in this HTML version using MathJax in order to improve their display. Uncheck the box to turn MathJax off. This feature requires Javascript. Click on a formula to zoom.
Abstract
A method of continual ZnO nanoparticle (NP) generation was tested for use in follow-up long-term inhalation exposure experiments with small laboratory animals. NPs were synthesized in an externally heated tube reactor by the evaporation of metallic zinc into a stream of nitrogen carrier gas, followed by the oxidation of zinc vapor in a stream of air and the formation of NPs by a chemical vapor condensation method. The NP production was studied at various evaporation temperatures, reactor flow rates and flow rates of mixing air. Particle generation for more than 100 h in two experimental runs with one batch of the zinc precursor was performed without a considerable decrease in the particle production rate. As a result, particle production with a number concentration much greater than 1.0 107 #/cm3, a mean particle/agglomerate size well below 50 nm and an emission rate greater than 5 μg/min was obtained under most of the investigated experimental conditions. A maximum emission rate of 16.3 μg/min was obtained at an evaporation temperature of 530 °C, a reactor flow rate of 800 cm3/min and a mixing flow rate of 2000 cm3/min and could be further increased by an increase in the evaporation temperature. The particle characteristics were studied, and estimates of the lung surface deposition area were calculated on the basis of the model developed by the International Commission of Radiological Protection.
Copyright © 2019 American Association for Aerosol Research
EDITOR:
1. Introduction
Nanoparticles (NPs) exhibit unique properties due to their high surface-to-volume ratio. Zinc oxide NPs and nanostructures are widely used because of their chemical, optical, photocatalytic, electrical, and anti-bacterial properties. For these reasons, zinc oxide NPs have many applications as gas sensors (Liao et al. Citation2007; Kwak and Yong Citation2008), optical devices (Tsukazaki et al. Citation2005), photocatalysts (Yeber et al. Citation2000), catalysts (Tijm, Waller, and Brown Citation2001), solar cells (Law et al. Citation2005), sunscreens (Osmond and McCall Citation2010), anti-bacterial textile finishes and UV protective materials (Wang et al. Citation2004; Becheri et al. Citation2008). Due to these widespread applications, an exposure potential exists for workers by inhalation and indigestion, as well as possible dermal contact (Osmond and McCall Citation2010). Moreover, ZnO is frequently emitted into the atmosphere in the form of welding fumes (Fine et al. Citation2000) and from steel plants, especially from the treatment of galvanized steel; therefore, toxicity studies on ZnO NPs and nanostructures are highly desirable. In recent years, the adverse effects of ZnO NPs have been studied both in vitro (Lin et al. Citation2009; Li et al. Citation2010; Hackenberg et al. Citation2011; Schiavo et al. Citation2018) and in vivo (Fine et al. Citation2000; Adamcakova-Dodd et al. Citation2014; Chuang et al. Citation2014; Fukui et al. Citation2015; Saptarshi et al. Citation2015; Morimoto et al. Citation2016). However, the information about the biological effects of ZnO NPs is still insufficient and often controversial (Adamcakova-Dodd et al. Citation2014). Lin et al. (Citation2009) observed that exposure to ZnO particles leads to dose- and size-dependent cytotoxicity, as reflected in oxidative stress, lipid peroxidation, cell membrane damage and oxidative membrane damage. Similarly, the results of Hackenberg et al. (Citation2011) suggested that ZnO NPs are capable of inducing DNA damage and inflammation, even at low concentrations. The study of exposure of occupationally relevant doses of ZnO by intra-tracheal instillation and inhalation for 2 weeks (5 h/d and 5 d/week) showed inflammatory pathology in the lungs, cardiac inflammation, development of fibrosis and degeneration and necrosis of myocardium (Chuang et al. Citation2014). Saptarshi et al. (Citation2015) reported that high dose (5 mg/m3) of ZnO NPs via intra-nasal instillation can cause acute pulmonary inflammation and Monsé et al. (Citation2018) observed systemic effect of inhalation of ZnO NPs by human volunteers at ZnO concentrations 1 mg/m3 and above. In contrast, inhalation studies by Adamcakova-Dodd et al. (Citation2014) showed minimal pulmonary inflammation, cytotoxicity and lung histopathologic changes, Morimoto et al. (Citation2016) observed transient inflammation in the lung exposed to inhalation and intra-tracheal instillation of a high dose of ZnO NPs, but the parameters returned to control level in the chronic phase, which suggests that ZnO NPs may have a low toxic potential and Li et al. (Citation2010) reported the ability of ZnO NPs to suppress the proliferation of cancer cells.
From the above-mentioned studies, it is obvious that further investigation of the toxicity of ZnO NPs is needed. Recently, an inhalation chamber for exposure studies with small animals was constructed at the Institute of Analytical Chemistry of the CAS, v.v.i. (Večeřa et al. Citation2011), and one of the first results achieved using this chamber was published by Lebedová et al. (Citation2016). For inhalation exposure studies, there is a requirement for a continual generation source of NPs for a duration of weeks and a sufficiently high number concentration with appropriate size distributions and well-defined compositions. Several methods for gas-phase ZnO NP generation have been reported. Ozcelik and Ergun (Citation2014) synthesized ZnO particles by a spray pyrolysis method. Jensen et al. (Citation2000) presented ZnO NP synthesis using the metal-organic precursor zinc acetylacetonate in a flame reactor, and Tani, Mädler, and Pratsinis (Citation2002) synthesized ZnO NPs via flame-spray pyrolysis of a zinc–methanol–acetic acid solution. However, these methods are not well suited for the long-term generation of NPs. Moreover, particles from spray pyrolysis in a tube reactor are typically of the submicron size range rather than the nanosize range. Brehm, Winterer, and Hahn (Citation2006) synthesized ZnO NPs in a hot-wall tube reactor by the oxidation of zinc tetramethyl-heptanedionate, and Ali et al. (Citation2009) prepared ZnO NPs in the same type of reactor from a diethyl zinc precursor. Adamcakova-Dodd et al. (Citation2014) generated a ZnO aerosol by nebulizing a ZnO suspension in water using a six-jet collision nebulizer and commercially available NPs with a mean primary particle diameter of 10 nm. In their study, animals were exposed intermittently for 4 h/d, 5 d/week over a period of 2 weeks in a subacute study and over 13 weeks in a sub-chronic study. As mentioned above, both studies showed minimal pulmonary inflammation, cytotoxicity and lung histopathologic changes. Although the above-mentioned flame-spray pyrolysis method (Tani, Mädler, and Pratsinis Citation2002) is a complicated and costly process, this method of ZnO generation was developed and evaluated for large-scale human inhalation studies by Monsé et al. (Citation2014). The authors tested the temporal stability of a NP generator for 60 min at four different precursor flow rates.
None of the abovementioned methods generated ZnO NPs in a manner that was similar to their typical emission into the atmosphere, specifically, by evaporation of metallic zinc, subsequent oxidation to ZnO by oxygen in the atmosphere and condensation of the ZnO vapor. This type of method was described and studied by McCarthy et al. (Citation1982); however, they did not test the long-term generation of NPs. In this work, we applied the same principle as that applied in the study by McCarthy with a different experimental arrangement for testing the long-term generation of ZnO NPs suitable for long-term continual inhalation exposure studies. In addition to the dependence of NP production on the process duration and process parameters, the characteristics of the synthesized NPs were investigated.
2. Experimental
NPs were generated using the apparatus shown in , which depicts a modified version of the device used in our earlier studies (Moravec et al. Citation2015, Citation2016). A boat with a 4.3 g zinc shot (99.999%, CAS No. 7440-66-6, Strem Chemicals, Inc., Kehl, Germany) was inserted into the middle of the heated section of an externally heated work tube with an i.d. of 25 mm and a 1-m-long heated zone. The total length of the work tube, composed of impervious aluminous porcelain, was 1.5 m. An electric furnace with three independent heating zones and temperature controllers (Technologic THP 94) was used for heating.
Figure 1. Scheme of the apparatus. (1) Deoxygenator, (2) dryer, (CV) control valve, (D) diluter, (F) filter, (MFC) electronic mass flow controller, (N) aerosol neutralizer Am241, (P) pressure reducing valve, (SF) sampling filter, (VP) vacuum pump.
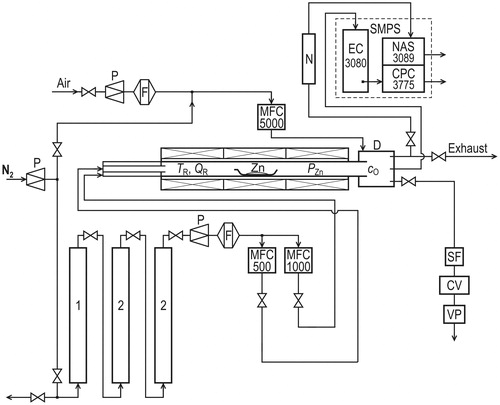
Nitrogen 4.0 (Linde Gas, Inc., Prague, Czech Republic), used as a carrier gas, was passed through the purification unit before entering the reactor. The purification unit consisted of a deoxidizing column and two drying columns. The deoxidizing column (1) was filled with 5 5 mm pellets of Cu catalyst R3-11 (BASF). The first drying column (2) was filled with the molecular sieve Dusimo S5 Å (Lachema Brno), and the second drying column was filled with magnesium perchlorate 99% (Fluka 63102). Deoxygenated (1), dry (2), and particle-free nitrogen (F) was saturated in the work tube by the precursor vapor, and the equilibrium vapor pressure could be calculated from the equation (Alcock, Itkin, and Horrigan Citation1984):
(1)
(1)
This equation is valid above the melting point of zinc (419.5 °C). Carrier gas that was saturated to some extent by Zn vapor (as equilibrium saturation was not expected) was mixed in the outer section of the work tube and in the diluter with a stream of dry air. During the mixing process, the Zn vapor was oxidized to zinc oxide, and the ZnO NPs were formed via a gas-to-particle process. The flow rates of individual gas streams were controlled using electronic mass flow controllers (Aalborg GFCS). The particle production and the particle characteristics were studied in terms of dependence on the work tube temperature (TR: 500–530 °C), the work tube flow rate (QR: 600–1000 cm3/min) and the dilution flow rate (QDil: 1800–2200 cm3/min). The oxygen concentration (cO: 13.5–16.5 vol. %) results from QR/QDil ratio: .
The particle production was monitored using a scanning mobility particle sizer (SMPS, TSI model 3936L75) consisting of an electrostatic classifier (EC, TSI model 3080) with a long differential mobility analyzer (TSI model 3081) and a condensation particle counter (CPC, TSI model 3775). The CPC was operated in high-flow mode with an aerosol flow rate of 800 cm3/min, and the particle density in the Aerosol Instrument Manager software was set to a default value of 1.2 g/cm3. Samples for the NP characterization were deposited on Au or Ni transmission electron microscopy (TEM) grids covered with carbon film using a nanometer aerosol sampler (NAS, TSI model 3089) and on cellulose and Sterlitech Ag filters. The filters were weighed on scales (Sartorius M5P-000V001, Goettingen, Germany) with a readability of 1 μg. The NP characteristics were studied with high-resolution TEM (HRTEM, JEOL 3010, samples on TEM grids), energy-dispersive spectroscopy (EDS, INCA/Oxford connected to JEOL 3010, TEM grids), selected area electron diffraction (SAED, JEOL 3010, TEM grids), inductively coupled plasma-optical emission spectrometry (ICP-OES, IRIS Intrepid II XDL, cellulose filters), X-ray diffraction (XRD, Bruker D8 Diffractometer, Ag filters) and X-ray photoelectron spectroscopy (XPS, AXIS-Supra, Kratos Analytical, Ltd., Manchester, UK, Ag filters). The SAED patterns were interpreted using the ProcessDiffraction program (Lábár Citation2008). Further details of the particle characterization are given in the online supplemental information (SI).
3. Results and discussion
3.1. Particle production
Two experimental runs with a total duration of more than 102 h were performed with one batch of the zinc precursor. The dependence of the particle production on the process time and on the various experimental conditions (TR, QR, cO, QDil) during the 51-h-long 1st experimental run is shown in . Particle production is represented by the number (Nt), surface (St), mass (Mt), total concentration, and geometric mean diameter (GMD), as well as the number (N), surface (S), and mass (M) particle size distributions. The data were collected by SMPS with time resolution 10 min per scan. An applied aerosol flow rate of 800 cm3/min and a particle density of 1.2 g/cm3 correspond to the size range of 8.1–352.3 nm.
Figure 2. The dependence of Nt, GMD, St, Mt, and number, mass and surface particle size distributions on the process duration and the experimental conditions (TR, QR, QDil, cO) during the 1st experimental run. Vertical gray bars highlight the sampling periods; G denotes the TEM grid, F denotes Ag filter, and FC denotes cellulose filter.
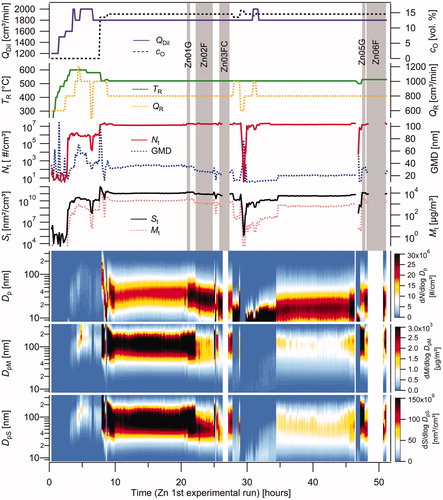
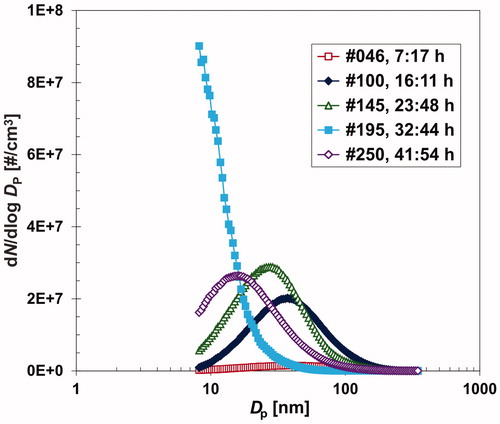
At the beginning of the production process, the temperature of the work tube was gradually increased, and the NP production was studied at cO=0, i.e., by the evaporation/condensation process. The NP production occurred at time = 2.8 h and TR=560 °C. However, in an inert atmosphere, the NP production was low, and Nt reached a value of only 1 106 #/cm3 even at TR=600 °C. The low NP production can also be observed from the particle size distribution, shown by curve #046 in . When a stream of diluting nitrogen (QDil) was replaced by a stream of air at 7.7 h, the process of NP formation changed from evaporation/condensation to chemical vapor synthesis, and the NP production (Nt, St, Mt) immediately increased by an order of magnitude or more (see ). Then, TR was set to a lower value of 520 °C, and the NP production quickly stabilized to a steady-state level and proceeded steadily throughout the night (over a period from 10 to 20 h, as shown in ). The particle size distribution in this period is represented by curve #100 in . However, during the subsequent hours, the monitored NP production was affected by the sampling on the filters (see the vertical gray bars in and curve #145 in ), and to a lesser extent, by the sampling on the TEM grids, which can be seen in the period from 20.9 to 21.4 h in . From the sampling period of sample Zn02F, it is obvious that the values of GMD, St, and Mt are lower than those during the initial steady-state period (SSP). The sampling effects are not always in the same direction and are not always fully reproducible, as shown in Figure S1 in the SI. The mechanism of this effect is not fully understood, although it is probably caused by the decrease in pressure in the diluter and work tube during sampling on the filters; however, it is difficult to determine whether the lower pressure influences the NP formation or the NP loss by diffusion or thermophoresis in the outer section of the work tube, diluter, and sampling lines between the diluter and SMPS. During the sampling periods of samples Zn03FC and Zn06F, we disconnected the SMPS from the diluter (see ) to enable increasing the flow rate through the sampling filter and, consequently, increasing the mass of NPs measured in the samples. Small increase were also observed in Nt as well as a decrease in the GMD (St, Mt) with increased QR during the period of 28.0–28.8 h. At 29.5 h, the LabVIEW program controlling the mass flow controllers stopped working and had to be restarted. As a result, feeding of the carrier gas and NP production ended. After resetting the flow rates, the NP generation was restored quickly, but it was initially significantly lower (see and curve #195 in ). More than 4 h were required to reach a steady-state level again, as shown for the period of 34.5–45.5 h in and curve #250 in . Furthermore, the NP production was lower than that during the steady-state period from 10 to 20 h. When TR was set to 530 °C, the GMD increased from 20 to more than 30 nm, but during the sampling period, a decrease in the GMD was observed again.
Figure 3. Variation in the particle size distribution during the 1st experimental run depending on different events.
The analogous graph for the 2nd experimental run is shown in Figure S1 in the SI. In addition to above discussed two experimental runs, we later did two additional experiments without NPs sampling and frequent changes of experimental conditions. The results are shown in Figure S2 and Figure S3 in the SI. Parameters of all steady-state periods are summarized in Table S1 in the SI.
Table 1. Experimental conditions, mass concentrations, and emission rates from the filter and SMPS measurements during the filter sampling periods.
3.2. Particle characterization
3.2.1. Morphology
The morphology of two NP samples deposited on TEM grids was analyzed with HRTEM. The results of both samples were similar, and they are shown in (sample Zn01G) and 5 (sample Zn05G). From , the primary NP size varies between 10 and 20 nm, but some NPs have diameters smaller than 10 nm. The particles are mostly agglomerated into clusters or branched chains of various sizes. In the high-resolution image in , lattice fringes are highly visible. Lattice fringes are spread throughout the total diameter of the NPs, indicating that the NPs are fully crystalline. Sample Zn05G in was synthesized at a higher TR (530 °C) than that for sample Zn01G (520 °C). From the image of a large area in , the particles are again agglomerated into clusters and branched chains. The size of the primary particles seems to be uniform, which can be seen in more detail in . However, some aggregates that appear to consist of larger primary particles are also deposited in the sample. Nevertheless, from the close-up image of an aggregate in , it seems that these larger particles are denser aggregates of the same primary particles. From the detailed image in , it is obvious that the typical size of the primary particles varies between 10 and 20 nm, similar to that in sample Zn01G, with other NPs with sizes smaller than 10 nm. The morphology of the NPs is similar to that reported by McCarthy et al. (Citation1982) at the vaporization temperature TR=530 °C, but these authors obtained a slightly larger primary particle size (17–31 nm).
Figure 4. TEM images of sample Zn01G synthesized at TR=520 °C, QR=800 cm3/min and QDil=1800 cm3/min.
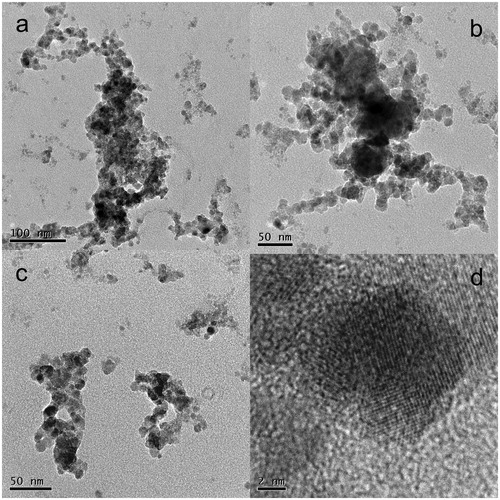
Figure 5. TEM images of sample Zn05G synthesized at TR=530 °C, QR=800 cm3/min and QDil=1800 cm3/min.
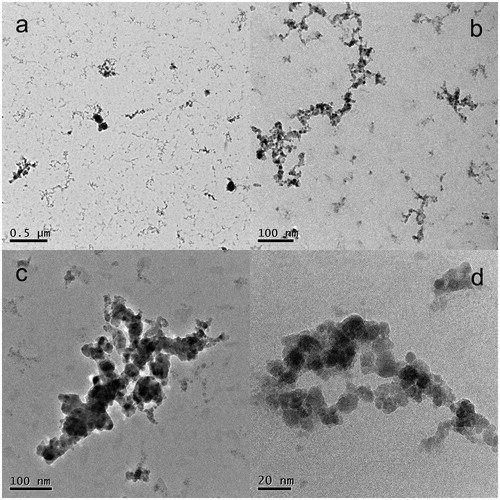
The SPMS results showed that the GMD of the particle size distributions during the sampling of sample Zn05G was 32 nm; therefore, most objects detected by SMPS must be either individual NPs or small agglomerates of several primary NPs. The agglomeration into large branched chains most likely occurred during deposition on the TEM grids in the NAS.
3.2.2. Composition
EDS analysis of samples Zn01G and Zn05G confirmed the presence of Zn, O, and C, as well as Au and Cu, in the samples. Au and Cu originate from the TEM grid, C originates mostly from the TEM grid foil and partially from the deposition of CO2 and volatile organic compounds from the atmosphere on the NP surface. The TEM grid foil also contains some amount of O (ca. 8 wt.%); therefore, the ratio of O/Zn was > 1 in all EDS spectra. More details are given in the SI (see Figure S4a and Table S2).
The XPS spectra of four samples were recorded using Al Kα radiation (hν = 1486.6 eV) at a pass energy of 10 eV and a step size of 0.1 eV. The photoelectron emission angle was 0° with respect to the surface normal, and the depth of the analyzed surface layer was approximately 6 nm. Samples were analyzed as prepared and after a gentle sputtering by ions of argon clusters. For the quantitative and qualitative analyses, Zn 2p3/2, O 1 s, and C 1 s spectra were recorded. The content of C varied from 10.2 to 12.9 atomic % in the as-prepared samples and from 6.8 to 9.1% in the samples after sputtering. This result confirms the increase in the concentration of C on the surface of the NPs. Analysis of the emission lines confirmed the presence of zinc in Zn-O bonds, oxygen in O-Zn and partially formed HO-Zn bonds, and carbon in C-C and C-H bonds. The results showed that the content of C in the NPs primarily represents volatile organic compounds from the atmosphere that were adsorbed on the NP surface.
The concentration of Zn in the three samples on the cellulose filters was analyzed by the ICP-OES method; the results, recalculated on the content of ZnO, were 88, 89 and 69 wt.% with an average value of 82%. The remaining 18% can most likely be accounted for by the humidity, CO2 and volatile organic compounds deposited on the surface of the NPs.
3.2.3. Crystallinity
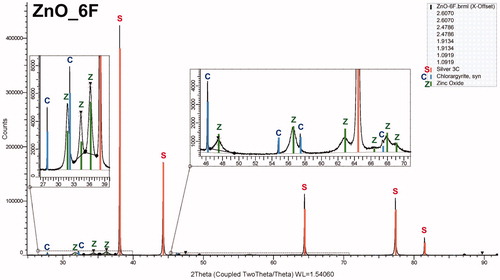
The XRD analysis of four samples on the Sterlitech Ag filters revealed the presence of the hexagonal ZnO crystalline phase, typically PDF 89-0510, in all samples, as shown for the sample Zn06F in . The XRD patterns of the other samples are shown in Figure S5a–c (see the SI), and they differ only in the height of the ZnO peaks. The mean crystallite size, calculated from the Scherrer equation (Scherrer Citation1918) using the Diffraction Evaluation program, varied between 12.5 and 13.7 nm, which agrees well with the typical primary NP size, as seen in and .
Figure 6. XRD pattern of sample Zn06F synthesized at TR=530 °C, QR=800 cm3/min and QDil=1800 cm3/min. C denotes chlorargyrite, S silver, and Z zinc oxide.
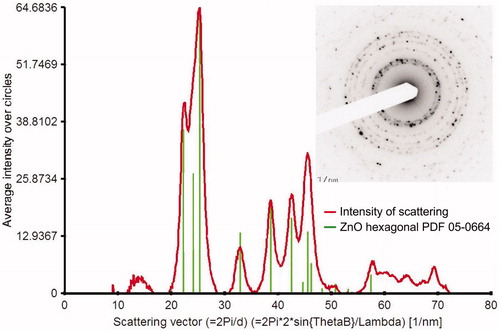
The XRD results were confirmed by SAED. A typical electron diffraction pattern, taken from a large agglomerate of NPs shown in , is shown in (inset), as well as its comparison (the (red) curve) with the model diffraction pattern of hexagonal ZnO (PDF 05-0664 (the vertical (green) lines). It is obvious that all main peaks (rings) fit very well with those in the model diffraction pattern. Identical results were obtained for sample Zn05G (see Figure S6 in the SI).
Figure 7. Comparison of the electron diffraction pattern (inset and the (red) curve) of sample Zn01G (TR=520 °C, QR=800 cm3/min and QDil=1800 cm3/min) with the model diffraction pattern of hexagonal ZnO (the vertical (green) lines), PDF 05-0664.
3.3. Emission rates and lung deposition surface area
One of the most important parameters of NP generation for exposure experiments is the emission rate. Emission rates can be calculated from SMPS measurements and from the sampling of NPs on filters. However, both approaches have limited accuracy; therefore, the obtained results should be considered as estimates. A recalculation of the number concentration, as detected by SMPS, on the mass concentration is accurate and correct when spherical non-agglomerated particles with a known density are sampled. However, according to our previous experience (Moravec at al. Citation2016), at high NP concentrations, such as those achieved in our NP generator, the primary particles are at least partially agglomerated into clusters and/or chains. In addition, when detecting clusters/chains, SMPS overestimates the volume concentrations, and if the particle density of bulk ZnO is used for calculating the mass concentrations, then the mass concentrations are overestimated. Therefore, a default value of 1.2 g/cm3 was used for the particle density in the Aerosol Instrument Manager software instead of the value of 5.6 g/cm3 for bulk ZnO.
The filter measurements provide accurate values for the sample weights and lengths for the sampling periods, but the sampling flow rate is estimated; consequently, the total sampled volume is also an estimate. When a bubbling flask is inserted into the exhaust stream (see ), the flow rate through the sampling filter can be set to its maximum value by using the control valve (CV); i.e., the flow rate of the exhaust stream decreases to almost zero. However, during the sampling period, the flow rate through the filter decreases due to the clogging of the filter and increasing resistance. Because the CV is manually operated, there is limited opportunity to correct the sampling flow rate with the CV and maintain the sampling flow rate at the maximum value. In our calculations, we estimated the average value of the exhaust flow rate during sampling (QEF) to be 200 cm3/min. The sampling flow rate (QSF) was then calculated from the following equation:
(2)
(2)
where, QAF denotes the aerosol flow rate to the SMPS. A comparison of the emission rates from the filters and SMPS is shown in . There are a total of seven samples on filters from both experimental runs (see and Figure S1 in the SI). In the 1st experimental run (), the emission rates from the filters were 2.6 times higher than those from the SMPS, with a maximum value of 9.1 μg/min at TR=530 °C. However, in the 2nd experimental run, the ratio of the emission rates from the filters to the SMPS varied between 0.7 and 1.2, with a mean value of 0.9 and a maximum emission rate of 8.2 μg/min at TR=525 °C. The maximum SMPS emission rate from the sampling periods was 11.9 μg/min (sample Zn07FC). During the non-sampling period, namely, the steady-state period from 10 to 20 h (), the average value of the emission rate (from SMPS) was 5.2 μg/min (TR=520 °C, QR=800 cm3/min, QDil=1800 cm3/min). Analogously, in the 2nd experimental run, during the steady-state period from 8 to 17 h (Figure S1; see the SI), the average value of the emission rate was 9.8 μg/min (TR=525 °C, QR=800 cm3/min, QDil=2000 cm3/min).
The difference in the filter to SMPS emission rate ratios between the first and second experimental runs is substantial. Possible reason for this is that the SMPS readings during the sampling periods are different from the scans before and after (b/a) sampling (see and Figure S1 in the SI), but how they differ varies for each run. In the first run (), the total mass concentration (Mt) in the sampling scans was lower than that in the b/a sampling scans. In contrast, in the second run (Figure S1), Mt was almost the same during sampling and b/a sampling. When the emission rates were calculated from the b/a sampling scans, the differences between the filter and the SMPS emission rates almost disappeared, as shown in the last column in . The values of ERFilter/ERSMPS,b/a vary in the range from 0.89 to 1.33. Furthermore, setting the particle density in the AIM software to 1.2 g/cm3 proved to be a reasonable approximation of the overall NP agglomerate density.
Recent studies (Schmid and Stoeger Citation2016) have shown that the surface area is the biologically most effective metric for acute NP toxicity in the lung. These studies concern insoluble NPs that are deposited in the lung during inhalation. The lung-deposited surface area (LDSA), i.e. the surface area of the NPs deposited in the tracheobronchial and alveolar regions of the lung, can be measured with a NP surface area monitor (NSAM), as reported by Fissan et al. (Citation2007), or with an electrical low-pressure impactor (ELPI), as described by Kuuluvainen et al. (Citation2016). Proxy LDSA can be calculated from SMPS particle size distributions using the deposition fractions (DFs) in the tracheobronchial and alveolar regions of the lung as a function of the NP size. DFs in these regions can be calculated on the basis of a widely used model developed by the International Commission on Radiological Protection (ICRP Citation1994) (also available in Hinds Citation1999), see, e.g., Reche et al. (Citation2015) or Kuuluvainen et al. (Citation2016)), and satisfactory agreement was found in the size range from 20 to 400 nm. These calculations are valid for spherical, non-agglomerated particles.
In our experiments, NPs are due to high number concentrations partially agglomerated into clusters and chains, and therefore, the total volume of NPs is overestimated and, in contrast, the total surface is underestimated. Moreover, according to Broday and Rosenzweig (Citation2011), aggregates are deposited in the pulmonary region with higher efficiency than the spheres of the same diameter. For this reason, the results of the surface area concentrations from SMPS and the calculated values of LDSA can be considered the lower limits of these variables in our experiments.
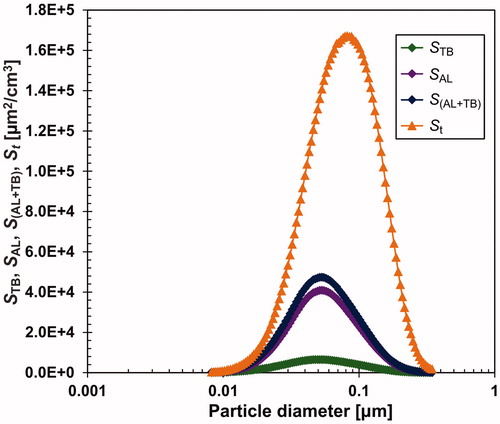
The LDSA calculations were performed using the SMPS scans during the steady-state period from 9.7 to 20.0 h of the 1st experimental run (see ). The results in the form of the particle size distribution of the total surface area (St), the fractions deposited in the tracheobronchial (STB) and alveolar (SAL) regions, and the total LDSA (STB+SAL) are plotted in . The average value of the surface concentration St during this period was 1.13 105 μm2/cm3, and the mean value of LDSA was 3.06
104 μm2/cm3. LDSA values for all SSPs are shown in Table S1 in the SI. As mentioned, these values represent the lower limits of the relevant variables. The respiratory DFs in head airways (DFHA), tracheobronchial (DFTB), and alveolar (DFAL) regions, as well as the total deposition fraction (DFt) calculated from the ICRP model, are plotted in Figure S7 in the SI.
Figure 8. Surface particle size distribution of the generated aerosol (St) and surface distributions of fractions deposited in the tracheobronchial (STB) and alveolar (SAL) regions and LDSA (SAB+TB). Concentrations St, STB, SAL and SAB+TB are plotted in the form dS/dlog Dp.
Exposure experiments are being performed in the Institute of Analytical Chemistry of the CAS using almost identical NPs generator and exposure chamber described by Večeřa et al. (Citation2011). The stream of generated aerosol is introduced to the exposure chamber where it is further diluted by a stream of filtered air (80 LPM). The exposure chamber contains four cages, two for inhalation experiments and remaining two are reserved for control animals. Each cage contains four boxes, each for 10 laboratory mice. T is maintained at 20–21 °C, RH at 55%–65%. After this dilution, Mt drops from 3490 to 118 (typical, SSP 2) and from 5810 to 210 μg/m3 (maximum, SSP 6).
4. Conclusions
A method of ZnO NP generation by the evaporation of metallic zinc and the subsequent oxidation of ZnO vapor by a stream of air was tested. Using this method, ZnO NPs of a desired size distribution and number concentration with suitably high emission rates can be generated for a sufficiently long time with only small variations in the NP production rate. NP production can be primarily controlled by the temperature of the work tube TR and, to some extent, by the flow rates QR and QDil. The highest emission rate of 16.3 μg/min was achieved at TR=530 °C, QR=800 cm3/min and QDil=2000 cm3/min and can be further increased by an increase in TR. The estimate of the surface total concentration during the selected 10-h-long steady-state period (SSP1) was 1.13 105 μm2/cm3, and the mean value of the LDSA was 3.06
104 μm2/cm3.
The typical primary particle size varied between 10 and 20 nm, which corresponds well with the mean crystallite size of 12.5–13.9 nm of hexagonal ZnO. The content of ZnO in the NPs was 82 wt.%. The GMD of the size distributions of the NPs and their clusters detected by SMPS was below 50 nm in all scans. The method is well suited for long-term inhalation exposure experiments due to its simple and economical experimentation and its ability to produce very small primary particles of well-defined composition and high surface area for a sufficiently long time.
Supplemental Material
Download MS Word (4.3 MB)Acknowledgments
ICP-OES analyses were performed by Dr. Šárka Matoušková, Institute of Geology of the CAS, v.v.i., XRD analyses were performed by Mgr. Anna Kallistová, Institute of Geology of the CAS, v.v.i., and XPS analyses were performed by Dr. Josef Zemek, Institute of Physics of the CAS, v.v.i.
Disclosure statement
No potential conflict of interests was reported by the author(s).
Additional information
Funding
Related Research Data
References
- Adamcakova-Dodd, A., L. V. Stebounova, J. S. Kim, S. U. Vorrink, A. P. Ault, P. T. O’Shaughnessy, V. H. Grassian, and P. S. Thorne. 2014. Toxicity assessment of zinc oxide nanoparticles using sub-acute and sub-chronic murine inhalation models. Part Fibre Toxicol. 11 (1):15.
- Alcock, C. B., V. P. Itkin, and M. K. Horrigan. 1984. Vapour pressure equations for the metallic elements: 298-2500 K. Can. Metallurg. Quart. 23 (3):309–13.
- Ali, M., N. Friedenberger, M. Spasova, and M. Winterer. 2009. A novel approach for chemical vapor synthesis of ZnO nanocrystals: Optimization of yield, crystallinity. Chem. Vap. Depos. 15 (7–9):192–98.
- Becheri, A., M. Dürr, P. L. Nostro, and P. Baglioni. 2008. Synthesis and characterization of zinc oxide nanoparticles: Application to textiles as UV-absorbers. J. Nanoparticle Res. 10 (4):679–89.
- Brehm, J. U., M. Winterer, and H. Hahn. 2006. Synthesis and local structure of doped nanocrystalline zinc oxides. J. Appl. Phys. 100 (6):064311–9.
- Broday, D. M., and R. Rosenzweig. 2011. Deposition of fractal-like soot aggregates in the human respiratory tract. J. Aerosol. Sci. 42 (6):372–86.
- Chuang, H.-C., H.-T. Juan, C.-N. Chang, Y.-H. Yan, T.-H. Yuan, J.-S. Wang, H.-C. Chen, Y.-H. Hwang, C.-H. Lee, and T.-J. Cheng. 2014. Cardiopulmonary toxicity of pulmonary exposure to occupationally relevant zinc oxide nanoparticles. Nanotoxicology 8 (6):593–604.
- Fine, J. M., T. Gordon, L. C. Chen, P. Kinney, G. Falcone, J. Sparer, and W. S. Beckett. 2000. Characterization of clinical tolerance to inhaled zinc oxide in naive subjects and sheet metal workers. J. Occup. Environ. Med. 42 (11):1085–91.
- Fissan, H., S. Neumann, A. Trampe, D. Y. H. Pui, and W. G. Shin. 2007. Rationale and principle of an instrument measuring lung deposited nanoparticle surface area. J. Nanoparticle Res. 9 (1):53–59.
- Fukui, H., H. Iwahashi, S. Endoh, K. Nishio, Y. Yoshida, Y. Hagihara, and M. Horie. 2015. Ascorbic acid attenuates acute pulmonary oxidative stress and inflammation caused by zinc oxide nanoparticles. J. Occup. Health 57 (2):118–25.
- Hackenberg, S., A. Scherzed, A. Technau, M. Kessler, K. Froelich, C. Ginzkey, C. Koehler, M. Burghartz, R. Hagen, and N. Kleinsasser. 2011. Cytotoxic, genotoxic and pro-inflammatory effects of zinc oxide nanoparticles in human nasal mucosa cells in vitro. Toxicol. Vitro 25 (3):657–63.
- Hinds, W. C. 1999. Aerosol technology. 2nd ed., 244–245. New York: J. Wiley & Sons.
- ICRP. 1994. Human respiratory tract model for radiological protection. A report of a task group of the international commission on radiological protection. Ann. ICRP 24 (1–3):1–482.
- Jensen, J. R., T. Johannessen, S. Wedel, and H. Livbjerg. 2000. Preparation of ZnO-Al2O3 particles in a premixed flame. J. Nanoparticle Res. 2 (4):363–73.
- Kuuluvainen, H., T. Rönkkö, A. Järvinen, S. Saari, P. Karjalainen, T. Lähde, L. Pirjola, J. V. Niemi, R. Hillamo, and J. Keskinen. 2016. Lung deposited surface area size distributions of particulate matter in different urban areas. Atmos. Environ. 136:105–13.
- Kwak, G., and K. Yong. 2008. Adsorption and reaction of ethanol on ZnO nanowires. J. Phys. Chem. C 112 (8):3036–41.
- Lábár, J. L. 2008. Electron diffraction based analysis of phase fractions and texture in nanocrystalline thin films; Part I: Principles. Micros. Microanal. 14 (04):287–95.
- Law, M., L. E. Greene, J. C. Johnson, R. Saykally, and P. Yang. 2005. Nanowire dye-sensitized solar cells. Nat. Mater. 4 (6):455–59.
- Lebedová, J., L. Bláhová, Z. Večeřa, P. Mikuška, B. Dočekal, M. Buchtová, I. Míšek, J. Dumková, A. Hampl, and K. Hilscherová. 2016. Impact of acute and chronic inhalation exposure to CdO nanoparticles on mice. Environ. Sci. Pollut. Res. Int. 23 (23):24047–60.
- Li, J., D. Guo, X. Wang, H. Wang, H. Jiang, and B. Chen. 2010. The photodynamic effect of different size ZnO nanoparticles on cancer cell proliferation in vitro. Nanoscale Res. Lett. 5 (6):1063–71.
- Liao, L., H. B. Lu, J. C. Li, H. He, D. F. Wang, D. J. Fu, C. Liu, and W. F. Zhang. 2007. Size dependence of gas sensitivity of ZnO nanorods. J. Phys. Chem. C 111 (5):1900–03.
- Lin, W., Y. Xu, C.-C. Huang, Y. Ma, K. B. Shannon, D.-R. Chen, and Y.-W. Huang. 2009. Toxicity of nano- and micro-sized ZnO particles in human lung epithelial cells. J. Nanoparticle Res. 11 (1):25–39.
- McCarthy, J. F., G. J. Yurek, J. F. Elliott, and M. O. Amdur. 1982. Generation and characterization of submicron aerosols of zinc oxide. Am. Ind. Hyg. Assoc. J. 43 (12):880–86.
- Monsé, C., O. Hagemeyer, M. Raulf, B. Jettkant, V. van Kampen, B. Kendzia, V. Gering, G. Kappert, T. Weiss, N. Ulrich, E.-M. Marek, J. Bünger, T. Brüning, and R. Merget. 2018. Concentration-dependent systemic response after inhalation of nano-sized zinc oxide particles in human volunteers. Part. Fibre Toxicol. 15 (1):8.
- Monsé, C., C. Monz, D. Dahmann, C. Asbach, B. Stahlmecke, N. Lichtenstein, K.-E. Buchwald, R. Merget, J. Bünger, and T. Brüning. 2014. Development and evaluation of a nanoparticle generator for human inhalation studies with airborne zinc oxide. Aerosol Sci. Technol. 48 (4):418–26.
- Moravec, P., J. Schwarz, P. Vodička, and M. Koštejn. 2016. Study of TiO2 nanoparticle generation for follow-up inhalation experiments with laboratory animals. Aerosol Sci. Technol. 50 (10):1068–76.
- Moravec, P., J. Smolík, J. Ondráček, P. Vodička, and R. Fajgar. 2015. Lead and/or lead oxide nanoparticle generation for inhalation experiments. Aerosol Sci. Technol. 49 (8):655–65.
- Morimoto, Y., H. Izumi, Y. Yoshiura, T. Tomonaga, T. Oyabu, T. Myojo, K. Kawai, K. Yatera, M. Shimada, M. Kubo, K. Yamamoto, S. Kitajima, E. Kuroda, K. Kawaguchi, and T. Sasaki. 2016. Evaluation of pulmonary toxicity of zinc oxide nanoparticles following inhalation and intratracheal instillation. IJMS 17 (8):E1241.
- Osmond, M. J., and M. J. McCall. 2010. Zinc oxide nanoparticles in modern sunscreens: An analysis of potential exposure and hazard. Nanotoxicology 4 (1):15–41.
- Ozcelik, B. K., and C. Ergun. 2014. Synthesis of ZnO nanoparticles by an aerosol process. Ceram. Int. 40 (5):7107–16.
- Reche, C., M. Viana, M. Brines, N. Pérez, D. Beddows, A. Alastuey, and X. Querol. 2015. Determinants of aerosol lung-deposited surface area variation in an urban environment. Sci. Total Environ. 517:38–47.
- Saptarshi, S. R., B. N. Feltis, P. F. A. Wright, and A. L. Lopata. 2015. Investigating the immunomodulatory nature of zinc oxide nanoparticles at sub-cytotoxic levels in vitro and after intranasal instillation in vivo. J. Nanobiotechnol. 13 (1):6.
- Scherrer, P. 1918. Bestimmung der Grösse und der Inneren Struktur von Kolloidteilchen Mittels Röntgenstrahlen, Nachrichten von der Gesellschaft der Wissenschaften. Vol. 2, 98–100. Göttingen, Germany: Mathematisch-Physikalische Klasse.
- Schiavo, S., M. Oliviero, J. Li, and S. Manzo. 2018. Testing ZnO nanoparticle ecotoxicity: Linking time variable exposure to effects on different marine model organisms. Environ. Sci. Pollut. Res. 25 (5):4871–80.
- Schmid, O., and T. Stoeger. 2016. Surface area is the biologically most effective dose metric for acute nanoparticle toxicity in the lung. J. Aerosol Sci. 99 (SI):133–43.
- Tani, T., L. Mädler, and S. E. Pratsinis. 2002. Homogeneous ZnO nanoparticles by flame spray pyrolysis. J. Nanoparticle Res. 4 (4):337–43.
- Tijm, P. J. A., F. J. Waller, and D. M. Brown. 2001. Methanol technology developments for the new millennium. Appl. Catal. A Gen. 221 (1–2):275–82.
- Tsukazaki, A., A. Ohtomo, T. Onuma, M. Ohtani, T. Makino, M. Sumiya, K. Ohtani, S. F. Chichibu, S. Fuke, Y. Segawa, H. Ohno, H. Koinuma, and M. Kawasaki. 2005. Repeated temperature modulation epitaxy for p-type doping and light-emitting diode based on ZnO. Nat. Mater. 4 (1):42–46.
- Večeřa, Z., P. Mikuška, P. Moravec, and J. Smolík. 2011. Unique Exposure system for the whole body inhalation experiments with small animals. Paper presented at the 3rd International Conference TANGER Ltd NANOCON 2011, 652–654, Brno, Czech Republic, September 21–23.
- Wang, R., J. H. Xin, X. M. Tao, and W. A. Daoud. 2004. ZnO nanorods grown on cotton fabrics at low temperature. Chem. Phys. Lett. 398 (1–3):250–55.
- Yeber, M. C., J. Rodríguez, J. Freer, N. Durán, and H. D. Mansilla. 2000. Photocatalytic degradation of cellulose bleaching effluent by supported TiO2 and ZnO. Chemosphere 41 (8):1193–97.