
 ?Mathematical formulae have been encoded as MathML and are displayed in this HTML version using MathJax in order to improve their display. Uncheck the box to turn MathJax off. This feature requires Javascript. Click on a formula to zoom.
Abstract
We performed controlled combustion experiments to investigate the dependence of the mass absorption cross-section (MAC) and absorption Ångström exponent (AAE) of combustion carbonaceous aerosol emissions on combustion conditions. Using benzene and toluene as fuels, we obtained a wide range of combustion conditions by varying the combustion temperature and equivalence ratio. We also used nitrogen as a passive diluent to tune the combustion conditions. We calculated MAC and AAE from multi-wavelength light-absorption measurements using a photoacoustic spectrophotometer and aerosol mass loadings estimated from thermal-optical analysis. Starting with relatively low-temperature and fuel-rich combustion conditions and progressively increasing the temperature and/or decreasing the equivalence ratio, we produced emissions with progressive change from weakly absorbing brown carbon (BrC) (MAC at 532 nm (MAC532) = 0.24 m2/g and AAE = 8.6) to strongly absorbing BrC (MAC532 = 2.1 m2/g and AAE = 3.1) to mixtures of black carbon (BC) and strongly absorbing BrC (MAC532 = 7.7 m2/g and AAE = 1.5). These findings indicate that combustion conditions are important in dictating the light-absorption properties of the emitted aerosols. Furthermore, regardless of fuel type and combustion conditions, the emitted aerosols exhibit a unified continuum of light-absorption properties that can be characterized by MAC532 and AAE pairs. The MAC532 and AAE pairs are well-correlated with the elemental carbon-to-organic carbon ratio (EC/OC), which is a proxy of combustion conditions, confirming previous findings that EC/OC is a practical basis for parameterizing the light-absorption properties of combustion carbonaceous aerosols.
Copyright © 2019 American Association for Aerosol Research
1. Introduction
Carbonaceous aerosols, including black carbon (BC) and organic aerosol (OA), have significant but poorly constrained impacts on the climate (Bond et al. Citation2013). BC absorbs solar radiation efficiently (Bond and Bergstrom Citation2006; Moosmüller, Chakrabarty, and Arnott Citation2009) and has been established as a leading climate-warming agent, potentially second only to CO2 (Bond et al. Citation2013; Jacobson Citation2001). The OA interaction with solar radiation and its impact on the climate are more complicated than those of BC. OA encompasses organic species with highly diverse chemical structures and optical properties. Some OA species absorb solar radiation and are dubbed brown carbon (BrC) (Andreae and Gelencsér Citation2006). Unlike BC which has relatively well-constrained light-absorption properties (Bond and Bergstrom Citation2006), the BrC light-absorption properties reported in the literature are highly variable (e.g., Alexander, Crozier, and Anderson Citation2008; Chakrabarty et al. Citation2010; Selimovic et al. Citation2018; Hoffer et al. Citation2017; Kirchstetter, Novakov, and Hobbs Citation2004; Saleh et al. Citation2013, Citation2014; Utry et al. Citation2013). BrC is less absorbing than BC as manifested in its smaller wavelength-dependent mass absorption cross-section (MAC) values. However, MAC of BrC exhibits a stronger wavelength dependence, which is usually quantified in terms of the absorption Ångström exponent (AAE). AAE for freshly emitted BC is typically close to unity (Bond, Habib, and Bergstrom Citation2006; Moosmüller et al. Citation2011) and can be up to 1.7 when BC is internally mixed with other material (Lack and Cappa Citation2010), indicating that BC light absorption is weakly dependent on wavelength in the visible spectrum. On the other hand, the BrC AAE values reported in the literature range between 2 and 9 (Chakrabarty et al. Citation2010, Citation2016; Kirchstetter, Novakov, and Hobbs Citation2004; Lack and Langridge Citation2013; Sumlin et al. Citation2018; Sun et al. Citation2017; Xie, Hays, and Holder Citation2017; Zhang et al. Citation2013). The considerable variability in BrC light-absorption properties stems from the diversity in its (poorly understood) chemical composition (Laskin, Laskin, and Nizkorodov Citation2015).
Open biomass combustion is the most significant source of BrC (Akagi et al. Citation2011; Chen and Bond Citation2009; Kirchstetter and Thatcher Citation2012; Saleh et al. Citation2014). Moreover, BrC has been associated with the incomplete combustion of fossil fuels (Du et al. Citation2014a, Citation2014b, Olson et al. Citation2015) as well as secondary OAs from biogenic and anthropogenic precursors (Laskin, Laskin, and Nizkorodov Citation2015; Lambe et al. Citation2013; Rizzo et al. Citation2011, Citation2013; Updyke, Nguyen, and Nizkorodov Citation2012). In this study, we focus on combustion BrC. The light-absorption properties of combustion BrC have been shown to vary with combustion conditions (Chen and Bond Citation2009; Saleh et al. Citation2014; Martinsson et al. Citation2015). The combustion conditions are generally governed by the combustion temperature and equivalence ratio (Φ) (Turns Citation2000), which are challenging to quantify in the real-life uncontrolled combustion that usually produces BrC and BC. To overcome this, previous studies have resorted to proxies to indirectly characterize the combustion conditions, including the relative abundance of elemental carbon (EC) and organic carbon (OC) in the particulate emissions (Vicente et al. Citation2015; Chen et al. Citation2014; Shen et al. Citation2012; Stockwell et al. Citation2016; Hong et al. Citation2017). Values of elemental carbon-to-organic carbon ratio (EC/OC) reported in the literature for uncontrolled biomass combustion are highly variable (Olson et al. Citation2015; Roden et al. Citation2006; Yang et al. Citation2009; Chen et al. Citation2014; Bauer et al. Citation2009; Zhang et al. Citation2013; Akagi et al. Citation2011), underscoring the diversity in combustion conditions. EC/OC (Xie, Hays, and Holder Citation2017; Pokhrel et al. Citation2016) and BC/OA (Saleh et al. Citation2014) have been utilized to parameterize the optical properties of combustion carbonaceous aerosols. While EC and BC have different operational definitions that depend on the measurement method, they are closely related and are often used interchangeably (Watson, Chow, and Chen Citation2005).
In this article, we systematically explore the effect of combustion conditions on the light-absorption properties (MAC and AAE) of the emitted carbonaceous aerosols by performing a series of combustion experiments controlled at different temperatures and equivalence ratios. We also assess the efficacy of EC/OC in predicting the light-absorption properties of combustion carbonaceous aerosols.
2. Methods
To generate carbonaceous aerosols of different light-absorption properties, we performed combustion experiments, using benzene and toluene as fuels, controlled at two different combustion temperatures and using various equivalence ratios. We used nitrogen as a passive diluent to fine tune the combustion conditions, as elaborated in Section 2.1. We performed online measurements of aerosol size distributions and light absorption at each combustion condition. We also collected filter samples for offline thermal-optical analysis to determine the EC/OC and estimate the aerosol mass loadings. Those were then used to calculate MAC and AAE of the aerosol and develop the parameterizations.
2.1. Combustion experiments
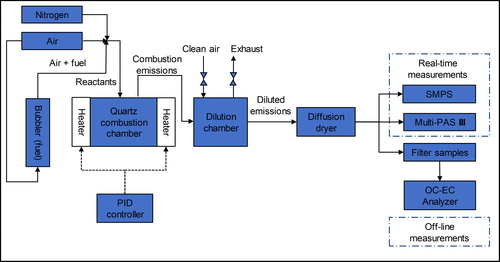
The experimental setup is shown in . We performed controlled-combustion experiments in a custom-made quartz combustion chamber (ID 50 mm × H 120 mm) enclosed in two 180 semi-cylindrical heating elements (Thermcraft) that could heat the chamber to a maximum temperature of 1200 °C. The temperature inside the chamber was measured by a high-temperature type-K thermocouple (OMEGA, KMQXL-125E-12) and controlled by a PID controller (OMEGA, CNi3244). Fuel was introduced into the combustion chamber by flowing clean air through a bubbler containing the fuel, thus saturating the air with fuel. An additional stream of clean air was mixed with the fuel-saturated stream to adjust the equivalence ratio. We also added a stream of nitrogen to fine-tune the combustion conditions (see below). The flow rates were controlled using mass-flow controllers (DAKOTA, 6AGC1AL55-09AB). We diluted the combustion emissions with clean air in a custom-made glass dilution chamber (ID 150 mm × H 140 mm) to reduce the aerosol concentrations to levels within the detection limits of the real-time instruments. The aerosol was conditioned in a home-built diffusion dryer (ID 10 cm × L 65 cm) to a relative humidity lower than 15%.
Figure 1. Schematic of the experimental setup.
We performed combustion experiments at two temperatures, 950 °C and 1050 °C. At each temperature, we varied the equivalence ratio (Φ) defined as:
(1)
(1)
where is the fuel-to-oxygen ratio calculated from the relative volumetric flowrates of fuel and air and
is the stoichiometric fuel-to-oxygen ratio, which is 0.13 and 0.11 for benzene and toluene, respectively. The volumetric flow rate of the fuel was calculated as:
(2)
(2)
where Psat,fuel is the saturation vapor pressure of the fuel, Ptot is the total pressure (1 atm), and Qtot is the total volumetric flow rate of fuel and air exiting the bubbler. As confirmed by the calculations in the online supplementary information (SI), the residence time of a bubble rising in the bubbler (approximately 1 s) is longer than the time required to saturate a single bubble (approximately 0.4 s), confirming that the vapor pressure of the fuel exiting the bubbler is equal to Psat,fuel. We calculated Psat,fuel using the Antoine equation:
(3)
(3)
where T is the temperature (K) inside the bubbler and A, B, and C are component-specific constants. A = 4.01814, B = 1203.835, and C = −53.226 for benzene (Willingham et al. Citation1945) and A = 4.23679, B = 1426.48, and C = −45.957 for toluene (Besley and Bottomley Citation1974).
Tuning the combustion conditions to achieve specific light-absorption properties (MAC and AAE) has proved to be challenging if relying only on manipulating Φ. The reason is that MAC and AAE are more sensitive to Φ than the precision at which we can control the relative flow rates of fuel and air. To overcome this issue, we used nitrogen as a passive diluent to fine-tune the combustion conditions. Adding a passive diluent reduces the reaction intensity of the combustible gases (Wagnon and Wooldridge Citation2014; Li et al. Citation2015) and thus decreases the combustion efficiency. The effect on the combustion products is similar to making the combustion more fuel rich. However, MAC and AAE are less sensitive to the change in the flow rate of the added nitrogen than to change in the flow rate of the fuel or air (oxygen). Therefore, adjusting the nitrogen flow rate allowed us to accurately control the combustion conditions to achieve the desirable MAC and AAE values.
With the introduction of nitrogen as a passive diluent, however, the previously defined equivalence ratio (Φ) is no longer sufficient to describe the combustion conditions. In other words, two combustion experiments can have the same temperature and Φ but different combustion efficiencies, and consequently different combustion products, if one of the experiments involves adding a passive diluent (see SI Table S1). Hence, to present the light-absorption properties as a function of combustion conditions, we define a modified equivalence ratio (Φ′) that captures the effect of the passive diluent (nitrogen) in decreasing the combustion efficiency. Adding nitrogen has a similar effect on the combustion efficiency and the aerosol light-absorption properties as reducing oxygen. Therefore, we define Φ’ as:
(4)
(4)
where is the fuel-to-oxygen ratio corresponding to a hypothetical oxygen flow rate (
) that is reduced compared to the actual oxygen flow rate.
In order for the hypothetical reduction in the oxygen flow rate to capture the effect of the added nitrogen, it should be proportional to the added nitrogen flowrate (). To achieve that, we calculate
by scaling the actual oxygen flow rate as follows:
(5)
(5)
where = 0.21 is the mole fraction of oxygen in air,
is the actual oxygen flowrate, and
is the mole fraction of oxygen in the system containing air and the added nitrogen:
(6)
(6)
where is the total air flowrate entering the combustion chamber. Combining EquationEquations (1)
(1)
(1) and Equation(4)–(6), we obtain:
(7)
(7)
We stress that Φ′ serves as a convenient parameter to qualitatively represent changes in combustion conditions when nitrogen is added as a passive diluent (see ) based on our observation that adding nitrogen moves the combustion products in the same direction as making the combustion more fuel rich. However, we do not imply that adding nitrogen has the same effect on combustion chemistry as increasing the fuel-to-oxygen ratio. In other words, for two combustion systems A and B (with B involving additional nitrogen as a passive diluent), we do not imply that A and B exhibit the same combustion chemistry if ΦA = Φ′B.
2.2. Light-absorption and size-distribution measurements
At each combustion condition, we measured real-time aerosol absorption coefficients (babs, Mm−1) at 422, 532, and 782 nm using a 3-wavelength multi-pass photoacoustic spectrophotometer (Multi-PAS III) built by Geoffrey Smith’s group (University of Georgia) following the same design as Fischer and Smith (Citation2018). This design has the advantage that a single wavelength calibration is applicable to all wavelengths (Fischer and Smith Citation2018). However, we performed our calibrations at 422 nm and 532 nm to ensure consistency. The calibration was performed daily with NO2 (1–5 ppm in N2) using NO2 absorption cross-section values of 5.79 × 10⁻¹⁹ cm2/molecule and 1.47 × 10⁻¹⁹ cm2/molecule at 422 nm and 532 nm, respectively (Vandaele Citation2002). We obtained the instrument calibration coefficient as the average of the two calibration coefficients. With the absence of reliable NO2 absorption cross-section data at 782 nm, we opted to exclude the 782 nm laser from the calibration process. The Multi-PAS III has a detection limit better than 0.6 Mm−1 (Fischer and Smith Citation2018). This detection limit is much smaller than the absorption coefficients observed in our experiments, which were typically larger than 10, 100, and 500 Mm−1 at 782, 532, and 422 nm, respectively.
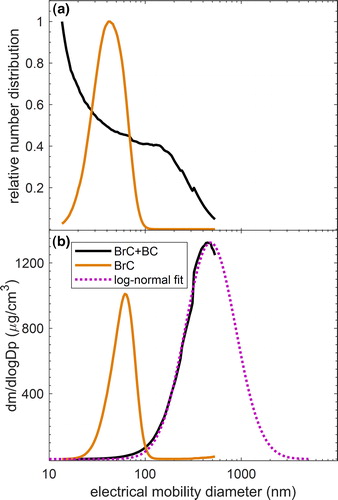
We measured the aerosol electrical-mobility size distributions within the size range 10–550 nm using a Scanning Mobility Particle Sizer (SMPS, TSI). The SMPS includes an Electrostatic Classifier (TSI, Model 3082) with a long Differential Mobility Analyzer (DMA, TSI, Model 3081A00), an Advanced Aerosol Neutralizer (TSI, Model 3088), and a Condensation Particle Counter (CPC, TSI, Model 3772). Typical number and mass size distributions of combustion particles are shown in , respectively. The particle size distributions exhibited a strong dependence on the combustion conditions. As shown in , the particles generated in our combustion experiments fall into two general regimes: pure organics (BrC) and mixed BrC and BC (BrC + BC). For combustion conditions that produced only BrC, the particles were relatively small and exhibited a unimodal size distribution with mass-mode diameters typically smaller than 60 nm. On the other hand, combustion conditions that produced BrC + BC were characterized by bimodal particle size distributions, with the mass concentration being dominated by the larger particles (). As the mass distributions of the BrC + BC particles were not adequately captured within the SMPS measurement window, we applied lognormal fits to obtain the missing part of the distributions ().
Figure 2. Typical SMPS (a) number and (b) mass (assuming a density of 1 g/cm3) size distributions of combustion particles containing only BrC (brown) and BrC + BC (black). The SMPS measurement window does not adequately capture the BrC + BC mass distribution. To obtain the missing part of the distributions, we used log-normal fits (dotted magenta line).
2.3. Determining aerosol mass concentrations and elemental-carbon/organic-carbon ratios
For each experiment, we measured the integrated total carbon (TC) mass loading on the filter and the EC/OC using an OC-EC analyzer (Sunset Laboratory Inc, Portland, OR, USA, Model 5L) operated using the IMPROVE-A protocol, which has been commonly employed in OC-EC studies (Chow et al. Citation2001, Citation2007; Karanasiou et al. Citation2015; Salako et al. Citation2012). We collected the combustion particles at a flow rate of 6 standard liters per minute on 47 mm quartz fiber filters pre-baked at 200°C for 12 h. The detection limit of the OC-EC analyzer specified by the manufacturer is 0.1 µg/cm2. Therefore, we targeted loadings on the order of 10 µg/cm2. The active collection area on each quartz fiber filter is approximately 11.3 cm2. Hence, the loading corresponds to 113 µg/filter. With typical aerosol concentrations of 300 µg/cm3, the sample collection time was approximately 1 hour. As shown in SI Figure S1, the aerosol light-absorption properties and the particle concentrations (i.e., integrated size distributions) were stable during each sampling period to within 5% and 10%, respectively.
We utilized the OC-EC analysis to obtain EC/OC for each experiment, which we used to parameterize the light-absorption properties of the aerosol (see Section 3.3). Estimating EC/OC collected on quartz filters is prone to both negative and positive artifacts when the aerosol sample contains volatile and semi-volatile organic compounds (VOCs and SVOCs) (Turpin, Huntzicker, and Hering Citation1994; Turpin, Saxena, and Andrews Citation2000; Cheng et al. Citation2010). The negative artifact is caused by evaporation of SVOCs collected on the filter during the time between the end of sampling and beginning of the OC-EC analysis. To minimize this artifact, we performed the OC-EC analysis immediately after sampling (i.e., the filters were not stored before OC-EC analysis). The positive artifact is caused by adsorption of VOCs and vapor-phase SVOCs on the quartz filter, which leads to overestimating the OC mass. To minimize this artifact, we employed the bare-quartz (BQ) and quartz-behind-Teflon (QBT) method (Ma et al. Citation2016; Chen and Bond Citation2009; Gao et al. Citation2006; Kirchstetter, Corrigan, and Novakov Citation2001; Subramanian et al. Citation2004). In addition to the main quartz filter (BQ), we added another sampling line with a quartz filter installed downstream of a Teflon filter (QBT). This method assumes that the Teflon filter exhibits minimal adsorption of VOCs and vapor-phase SVOCs, and those are adsorbed on the QBT filter. Therefore, the particle-phase OC can be estimated as the difference between the OC collected on the QB and QBT filters.
We also used the measured TC to estimate the average aerosol mass loading Cp (µg/m3) during an experiment, which we used to calculate MAC (Section 2.4). This was done using
(8)
(8)
where mTC is the total mass loading on the filter, Q is the sample collection flow rate, and t is the sample collection time.
EquationEquation (8)(8)
(8) assumes that the aerosol mass is dominated by carbon (TC). This assumption is justified as follows: We have previously shown using laser-desorption ionization mass spectrometry that the OA emitted at similar combustion conditions was dominated by molecules with sizes typically larger than 300 Da (and up to several 1000 Da) and with signatures indicative of a strong presence of polycyclic aromatic hydrocarbons (PAHs) (Saleh, Cheng, and Atwi Citation2018). The mass of these large organic molecules is dominated by carbon.
To validate this calculation of mass loading, we combined the aerosol particle mass loading measurements from OC-EC analysis and the volume concentrations obtained from integrating SMPS electrical-mobility size distributions (Section 2.2) to calculate particle effective densities:
(9)
(9)
where Cp is the particle mass loading and Vp is the SMPS integrated volume concentration.
As described in Section 2.2, depending on the combustion conditions, the particles were either pure organic (BrC) or mixed BrC + BC. The pure BrC particles exhibit compact, near-spherical morphologies (Saleh, Cheng, and Atwi Citation2018), and, therefore, their effective density calculated using EquationEquation (9)(9)
(9) corresponds to the actual material density. We obtained densities between 1.2 and 1.5 g/cm3 for the pure BrC particles (see SI Table S1). These values are in good agreement with the values reported in the literature for OA (Cross et al. Citation2007; Schmid et al. Citation2009), thus validating our OC-EC method to calculate particle mass loadings.
The OC-EC method is especially useful for the BrC + BC particles because they exhibit irregular morphologies (Saleh, Cheng, and Atwi Citation2018) and are expected to be composed of a complex mix of internally and externally mixed particles. This makes it challenging to estimate their mass concentration by relying on SMPS size distributions with the absence of detailed information on mixing state and morphology. To validate the mass-loading calculations for the BrC + BC particles, we combined OC-EC mass loadings with integrated SMPS volume concentrations to obtain distribution-average shape factors (χ) of the BrC + BC particles and compared them with values reported in the literature for BC-containing particles. χ can be calculated as (Sarangi et al. Citation2016; Rissler et al. Citation2014; Malloy et al. Citation2009):
(10)
(10)
where ρp is the material density of the aerosol and ρeff is the effective density obtained from EquationEquation (9)(9)
(9) . For the BrC + BC particles, we estimated ρp as the weighted average of BrC (1.3 ± 0.1 g/cm3, estimated based on the average BrC density from the OC-EC analysis) and BC (1.8 ± 0.1 g/cm3) (Bond et al. Citation2013) assuming that the BC-to-BrC ratio is equal to the EC-to-OC ratio obtained from the EC/OC analysis:
(11)
(11)
The χ values we obtained for the BrC + BC particles range between 1.09 and 2.63 (the complete list of values is given in SI Table S1). This range overlaps with χ values for BC-containing particles reported in the literature, with the variability attributed to differences in morphology and mixing state (Slowik et al. Citation2004, Citation2007; Ahern et al. Citation2016). Furthermore, the χ values are well correlated with EC/OC (SI Figure S2). This correlation is expected because the increase in EC/OC is associated with deviation from sphericity (χ = 1) and is in qualitative agreement with previous reports (Slowik et al. Citation2007; Qiu, Khalizov, and Zhang Citation2012; Zhang et al. Citation2016; Ahern et al. Citation2016; Schnitzler et al. Citation2014).
2.4. Light-absorption properties calculations
We quantified the light-absorption properties using the wavelength-dependent mass-absorption cross-section (MAC, m2/g). MAC follows an approximate power-low wavelength dependence and can, therefore, be represented using two parameters: MAC at a particular wavelength (λ), which we choose to be 532 nm (the mid-wavelength of the Multi-PAS III), and the AAE:
(12)
(12)
It is important to note that MAC and AAE depend on particle size and morphology (Lack and Cappa Citation2010; Bond, Habib, and Bergstrom Citation2006; Soewono and Rogak Citation2013; Poudel et al. Citation2017) and are thus not true intensive properties. However, they are commonly employed because they can be readily calculated from light-absorption measurements. On the other hand, retrieving refractive indices, which are the fundamental optical properties, requires involved optical calculations. The retrieval process is especially challenging for non-spherical particles, where the commonly used Mie calculations are not suitable, and the optical calculations require detailed knowledge of the morphology (Adachi, Chung, and Buseck Citation2010; Lack and Cappa Citation2010; Bond and Bergstrom Citation2006; Moosmüller, Chakrabarty, and Arnott Citation2009; Sorensen Citation2001). With the absence of morphology information for the mixed BrC + BC particles in this study, we elected to represent the light-absorption properties using MAC and AAE. For each experiment (i.e., combustion condition), we calculated MAC at 422, 532, and 782 nm as:
(13)
(13)
where babs is the experiment-mean absorption coefficient measured using the Multi-PAS III (Section 2.2), and Cp is the mean particle mass loading obtained from OC-EC measurements (Section 2.3).
The AAE for each experiment was obtained by fitting a power-law function to the wavelength-dependent MAC (EquationEquation (12)(12)
(12) ) measured at the three wavelengths (422, 532, and 782 nm). Therefore, the AAE obtained here is an effective AAE that represents the wavelength dependence of measured aerosol absorption over the visible spectrum.
3. Results and discussion
3.1. The dependence of aerosol light-absorption properties on combustion conditions
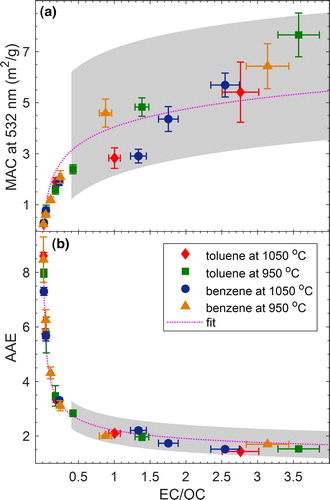
The obtained dependence of MAC at 532 nm (MAC532) and AAE on combustion conditions is summarized in , respectively. In each panel, we show the results for toluene and benzene combustion at temperatures of 950 °C and 1050 °C. As described in Section 2.2, depending on the combustion conditions, the emitted particles fall into two general regimes: pure BrC and mixed BrC + BC. To visually distinguish between the two regimes, we added a gray background shading to the BrC + BC region in . For both fuels and combustion temperatures, the MAC532 and AAE values show similar trends as a function of Φ’. Starting with largest Φ’, the particles have small MAC532 (as small as 0.24 m2/g) and large AAE (as large as 8.6) values, which are similar to values frequently observed for weakly absorbing BrC in smoldering-biomass emissions (Chakrabarty et al. Citation2010; Chen and Bond Citation2009; Chakrabarty et al. Citation2016; Li, Chen, and Bond Citation2016). As Φ’ decreases, MAC532 increases and AAE decreases, which is indicative of darker BrC. The MAC532 (2.09 m2/g) and AAE (3.1) values for the darkest BrC in this study are similar to those observed for dark biomass-burning BrC (Saleh et al. Citation2014; Kirchstetter, Novakov, and Hobbs Citation2004) and tar balls (Hoffer et al. Citation2016, Citation2017). As expected, the BrC + BC particles exhibit larger MAC532 and smaller AAE values, and as the BC content increases (see Section 3.3), they converge to the values frequently reported for BC (MAC532 = 7–8 m2/g and AAE close to unity) (Bond and Bergstrom Citation2006).
Figure 3. The dependence of light-absorption properties of the carbonaceous aerosols emitted from benzene and toluene combustion on the modified equivalence ratio (Φ’ – see derivation in Section 2.1) for combustion temperatures of 950 °C and 1050 °C. The shaded regions correspond to combustion conditions that produced mixed BrC + BC particles, and the non-shaded regions correspond to conditions that produced pure BrC particles. (a) The mass absorption cross-section at 532 nm (MAC532). (b) The absorption Ånsgström exponent (AAE). Error bars represent measurement uncertainty (see uncertainty analysis in SI). The MAC532 reported here is calculated based on the correction for adsorbed VOCs as described in Section 2.2. For reference, a similar plot is presented in SI Figure S3 without correcting for the adsorbed VOCs.
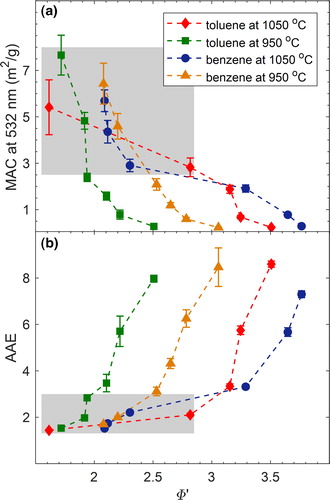
Even though the trends of MAC532 and AAE versus Φ’ are similar, the values are dependent on fuel type and combustion temperature. To investigate this dependence, it is helpful to qualitatively define combustion efficiency as the level of completeness of the combustion reaction. This definition is consistent with the definition of the “modified combustion efficiency,” quantified as the ratio of CO to CO2 in the emissions, which has been previously employed to characterize combustion conditions (Selimovic et al. Citation2018; Xie, Hays, and Holder Citation2017; Akagi et al. Citation2011; CitationAurell, Gullett, and Tabor 2015; Sun et al. Citation2018). The combustion efficiency is governed by fuel type, combustion temperature, and Φ’. Specifically, for a certain fuel, the combustion efficiency increases with increasing temperature and/or decreasing Φ’. If the BC-formation threshold is located in the combustion-efficiency space, reducing the combustion efficiency below this point produces pure BrC particles, which are the organic precursors of BC (Saleh, Cheng, and Atwi Citation2018). The darkness of these BrC particles varies proportionally with combustion efficiency (Saleh, Cheng, and Atwi Citation2018). This behavior is evident in for the pure BrC particles. For both benzene and toluene combustion, the emitted BrC is darker (larger MAC532 and smaller AAE) for decreasing Φ’ at a constant combustion temperature or increasing combustion temperature at a constant Φ’.
also reveals a dependence of combustion efficiency on fuel type. In the pure BrC regime, benzene combustion emitted darker BrC than toluene combustion for the same combustion temperature and Φ’. It is important to note that this result does not indicate that benzene and toluene emit different types of BrC but rather that benzene combustion progresses more efficiently towards the BC-formation threshold than toluene combustion. Put in other words, both benzene and toluene produce the same BrC continuum, but for the same combustion temperature and Φ’, benzene produces BrC that is further along the continuum (more mature) than toluene. This assertion is further discussed in Section 3.2.
It is important to note that approaching the BC-formation threshold (shaded regions in ) marks a convergence in MAC532 and AAE for both fuels and combustion temperatures. The reason is that BC is the end product to which the soot-formation process converges, which leads to its relatively uniform, fuel-independent, and temperature-independent light-absorption properties.
3.2. The continuum of light-absorption properties
As shown in , the data points from all the combustion experiments in collapse on the same continuum when their histories (fuel and combustion conditions) are ignored and are instead presented in AAE versus MAC532 space. This result supports our assertion in Section 3.1 that the dependence of the light-absorption properties on fuel type, combustion temperature, and Φ’ observed in is not a manifestation of diversity in formation pathways. It rather indicates that combinations of fuel type, combustion temperature, and Φ’ dictate how far the soot-formation process progresses along the same continuum. We stress that for the four fuel-type/combustion-temperature combinations in this study (benzene at 1050 °C, benzene at 950 °C, toluene at 1050 °C, and toluene at 950 °C), we could vary Φ’ to produce wide and overlapping portions of the continuum that spanned weakly absorbing BrC to highly absorbing BrC to mixtures of BC and highly absorbing BrC (). However, combustion temperature can be a limiting factor. For instance, regardless of fuel type and Φ’, low combustion temperatures would potentially produce only BrC in the weakly absorbing part of the continuum.
Figure 4. The mass absorption cross-section at 532 nm (MAC532) versus the absorption Ånsgström exponent (AAE) for all the data points in . The shaded region corresponds to mixed BrC + BC particles, and the non-shaded region corresponds to pure BrC particles. The dotted magenta line is an exponential-decay fit (AAE = (8.17 ± 0.58) exp[(−0.67 ± 0.09) MAC532] + 1, R2 = 0.9709). The dotted black line is a power-law fit (AAE = (4.37 ± 0.22) MAC532−0.48 ± 0.04, R2 = 0.9686). Error bars represent measurement uncertainty (see uncertainty analysis in SI). The MAC532 reported here is calculated based on the correction for adsorbed VOCs as described in Section 2.2. For reference, a similar plot is presented in SI Figure S4 without the adsorbed VOCs correction.
![Figure 4. The mass absorption cross-section at 532 nm (MAC532) versus the absorption Ånsgström exponent (AAE) for all the data points in Figure 3. The shaded region corresponds to mixed BrC + BC particles, and the non-shaded region corresponds to pure BrC particles. The dotted magenta line is an exponential-decay fit (AAE = (8.17 ± 0.58) exp[(−0.67 ± 0.09) MAC532] + 1, R2 = 0.9709). The dotted black line is a power-law fit (AAE = (4.37 ± 0.22) MAC532−0.48 ± 0.04, R2 = 0.9686). Error bars represent measurement uncertainty (see uncertainty analysis in SI). The MAC532 reported here is calculated based on the correction for adsorbed VOCs as described in Section 2.2. For reference, a similar plot is presented in SI Figure S4 without the adsorbed VOCs correction.](/cms/asset/97768ddc-634c-4b87-a6ea-b0d5306e0332/uast_a_1566593_f0004_c.jpg)
We have previously introduced the continuum of light-absorption properties of combustion carbonaceous aerosol produced through the soot-formation route, the brown-black continuum, in Saleh, Cheng, and Atwi (Citation2018). In that study, we presented experimental evidence of this continuum for BrC and posited that the continuum extended into the BC regime. Here, we present experimental evidence that it indeed applies to both the BrC and BC regimes. As shown in , the same trend set by the MAC532-AAE pairs upon progression from light to dark BrC continues beyond the BC-formation threshold. This implies that in practice, the light-absorption properties of combustion carbonaceous aerosol produced via the soot-formation route, which includes both BrC and BC, as well as their mixtures, can be parameterized within a unified framework.
For completeness, we reproduced but for AAE between 532 nm and 422 nm (AAE532-422) and between 782 nm and 532 nm (AAE782-532). Figure S5 in the SI shows the effective AAE over the visible spectrum (i.e., what we simply refer to as AAE in this article) versus AAE532-422 and AAE782-532. As expected, AAE782-532 < AAE < AAE532-422. The reason is that each sample is composed of components with varying light-absorption properties, and the darker components (large MAC, small AAE) dominate the absorption in the long-visible range while the contribution of the lighter components (small MAC, large AAE) to absorption increases in the short-visible range. As shown in Figure S6, while there are differences in the values of effective AAE, AAE532-422, and AAE782-532, they all exhibit the same exponential decay trend as a function of MAC.
To close this section, a discussion of the potential universality of the brown-black continuum () is in order. Theoretical and experimental investigations suggest that the soot-formation route, which involves sequential organization of aromatic rings into large PAHs (Michelsen Citation2017), is expected to be fairly fuel-independent (Lautenberger et al. Citation2005; Johansson et al. Citation2018). Therefore, we expect that the light-absorption properties of the components along this route, i.e., the brown-black continuum, to also be fuel-independent. In this study, we present evidence of fuel independence by showing that benzene and toluene combustion produce the same brown-black continuum (). However, more structurally diverse and complex fuels (e.g., solid fuels) need to be investigated in order to scrutinize the universality of the brown-black continuum. Furthermore, the brown-black continuum applies for carbonaceous particles produced through the soot-formation route. However, different classes of BrC have been observed in combustion emissions, especially biomass combustion, including nitroaromatic compounds (Budisulistiorini et al. Citation2017; Zhang et al. Citation2013; Lin et al. Citation2016; Claeys et al. Citation2012), charge transfer complexes (Phillips and Smith Citation2014, Citation2015), and tar balls (Hoffer et al. Citation2017; Chakrabarty et al. Citation2010; Alexander, Crozier, and Anderson Citation2008). An understanding of the relative contributions of the different classes to the total BrC budget is still lacking (Laskin, Laskin, and Nizkorodov Citation2015), and it remains to be seen whether the light-absorption properties of these types of BrC fall on the same continuum as the BrC produced in this study through the soot-formation route.
3.3. Parameterizing the light-absorption properties as a function of EC/OC
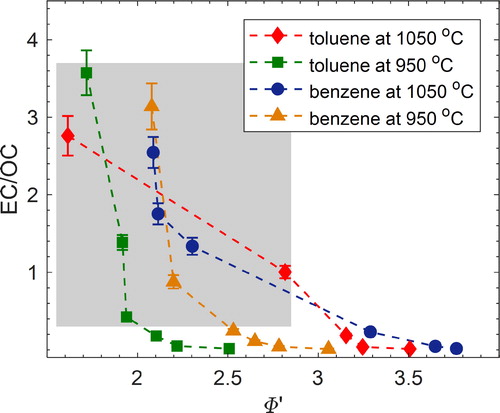
The ratio of elemental carbon to organic carbon (EC/OC) in combustion emissions can be readily calculated from emissions inventories (Petzold et al. Citation2013; Chow et al. Citation2010; Caserini et al. Citation2013; Bond et al. Citation2004). This makes EC/OC an attractive proxy of combustion conditions for parameterizing aerosol optical properties obtained from laboratory and field measurements for use in large-scale climate calculations. shows EC/OC, determined as described in Section 2.3, versus Φ’ for all combustion experiments. For each fuel, EC/OC increases with increasing combustion efficiency (increasing temperature and/or decreasing Φ’), confirming that EC/OC is a good indicator of combustion conditions.
Figure 5. Elemental carbon-to-organic-carbon ratio (EC/OC) versus modified equivalence ratio (Φ’) for all experiments. The shaded region corresponds to mixed BrC + BC particles, and the non-shaded region corresponds to pure BrC particles. Error bars represent measurement uncertainty (see uncertainty analysis in SI). The EC/OC reported here is corrected for adsorbed VOCs as described in Section 2.2. For reference, a similar plot is presented in SI Figure S7 with uncorrected EC/OC.
EC/OC and the closely related BC/OA have been previously shown to correlate with the carbonaceous aerosol light-absorption properties (Saleh et al. Citation2014; Xie, Hays, and Holder Citation2017; Pokhrel et al. Citation2016). More specifically, the carbonaceous aerosol becomes darker with increasing EC/OC. Differentiating between two aspects of this correlation is important. The first aspect is that the increase in carbonaceous aerosol darkness with EC/OC is partly attributed to the fractional increase of the highly absorptive EC (or BC) in the aerosol. The second aspect is that as the EC/OC (or BC/OA) increases, the organics aerosol (or BrC) becomes darker as shown by Saleh et al. (Citation2014). This is consistent with the brown-black continuum (Saleh, Cheng, and Atwi Citation2018) because the more conducive the combustion conditions are to forming BC, the more skewed the BrC components are to the darker end of the continuum.
Our controlled-combustion experiments enable us to distinguish the dark BrC from BC and show that the light-absorption properties of BrC and BC can be combined in a unified parameterization. To do that, we exploited a measurement artifact of the thermal-optical method used to determine EC/OC. Specifically, a fraction of OC is usually pyrolyzed during the step-increase in temperature in the OC-analysis stage (Bauer et al. Citation2009; Chow et al. Citation2001; Jeong et al. Citation2004). This is manifested as an increase in attenuation of a 633 nm laser, which is continuously monitored during the analysis. The pyrolyzed OC is quantified as the amount of carbon measured after the introduction of O2 (i.e., during the EC-analysis stage) until reflectance returns to its initial value at the beginning of the OC analysis phase (Karanasiou et al. Citation2015; Chow et al. Citation2007; Chow et al. Citation2004; Chow et al. Citation2001). An implicit assumption in the pyrolyzed-OC correction process is that only EC absorbs at 633 nm. Therefore, OC (or BrC) that absorbs appreciably at 633 nm is inaccurately registered as EC, and for the same amount of BrC, the registered amount of “artificial EC” increases with increasing BrC darkness. As shown in , for the pure BrC particles in our experiments, MAC532 and AAE are well correlated with the artificial EC/OC. The correlation extends into the BC-formation regime (i.e., when the registered EC includes “true EC”), where MAC532 increases and AAE decreases due to the formation of both BC and highly absorptive BrC.
Figure 6. Parameterizing the light-absorption properties of combustion carbonaceous aerosols as a function of EC/OC. The shaded regions correspond to mixed BrC + BC particles and the non-shaded regions correspond to pure BrC particles. The EC/OC reported here is corrected for adsorbed VOCs as described in Section 2.2. For reference, a similar plot is presented in SI Figure S8 with uncorrected EC/OC. (a) Mass absorption cross-section at 532 nm (MAC532) versus EC/OC. The dotted magenta line is a fit with the equation: MAC532 = (1.04 ± 0.20) log(EC/OC) + (4.13 ± 0.52), R2 = 0.8431. (b) AAE versus EC/OC. The dotted magenta line is a fit with the equation: AAE = (1.21 ± 0.14) EC/OC−0.4155 ± 0.03 + 1, R2 = 0.9850. Error bars represent measurement uncertainty (see uncertainty analysis in SI).
4. Conclusions
By performing controlled-combustion experiments that span both pure BrC as well as mixed BrC + BC formation regimes, we show that the light-absorption properties in both regimes follow the brown-black continuum introduced by Saleh, Cheng, and Atwi (Citation2018). At the same combustion conditions, the two fuels used in this study (benzene and toluene) produce BrC with different optical properties, with benzene consistently producing darker BrC. However, this difference is not a manifestation of differences in formation pathways but is rather an indication that the soot-formation process in benzene combustion progresses more efficiently than in toluene combustion. When presented in optical-properties space, the BrC and BC produced by both fuels fall on the same brown-black continuum characterized by pairs of increasing MAC at 532 nm (MAC532) and decreasing AAE.
For both the pure BrC and mixed BrC + BC regimes, MAC532 increases and AAE decreases with increasing EC/OC, which is an indicator of combustion efficiency. Systematically traversing the two regimes using controlled-combustion experiments shows that this correlation is due to both the formation of progressively darker BrC as well as the increase in BC fraction with increasing combustion efficiency. This finding provides a fundamental basis for previous reports on the observed dependence of light-absorption properties on EC/OC. It also suggests that a unified framework can potentially be implemented to parameterize the light-absorption properties of carbonaceous aerosols produced through the soot-formation route in both the pure-organic (e.g., smoldering) and BC-forming (e.g., flaming) combustion regimes.
Supplemental Material
Download MS Word (136.7 MB)Acknowledgments
The authors gratefully acknowledge Dr. Geoffery Smith (Department of Chemistry, University of Georgia) and his research group for designing and building Multi-PAS III used in this study, as well as the Scientific Glass Blowing Shop (University of Georgia) for building the quartz combustion chamber.
Additional information
Funding
Related Research Data
References
- Adachi, K., S. H. Chung, and P. R. Buseck. 2010. Shapes of soot aerosol particles and implications for their effects on climate. J. Geophys. Res. 115 (15):D15206. doi:10.1029/2009JD012868.
- Ahern, A. T., R. Subramanian, G. Saliba, E. M. Lipsky, N. M. Donahue, and R. C. Sullivan. 2016. Effect of secondary organic aerosol coating thickness on the real-time detection and characterization of biomass-burning soot by two particle mass spectrometers. Atmos. Meas. Tech. 9 (12):6117–37. doi:10.5194/amt-9-6117-2016.
- Akagi, S. K., R. J. Yokelson, C. Wiedinmyer, M. J. Alvarado, J. S. Reid, T. Karl, J. D. Crounse, and P. O. Wennberg. 2011. Emission factors for open and domestic biomass burning for use in atmospheric models. Atmos. Chem. Phys. 11 (9):4039–72. doi:10.5194/acp-11-4039-2011.
- Alexander, D. T. L., P. A. Crozier, and J. R. Anderson. 2008. Brown carbon spheres in East Asian outflow and their optical properties. Science. 321 (5890):833–36. doi:10.1126/science.1155296.
- Andreae, M. O., and A. Gelencsér. 2006. Black carbon or brown carbon? The nature of light-absorbing carbonaceous aerosols. Atmos. Chem. Phys. 6 (10):3131–48. doi:10.5194/acp-6-3131-2006.
- Aurell, J., B. K. Gullett, and D. Tabor. 2015. Emissions from southeastern U.S. Grasslands and pine savannas: Comparison of aerial and ground field measurements with laboratory burns. Atmos. Environ. 111:170–78. doi:10.1016/j.atmosenv.2015.03.001.
- Bauer, J. J., X. Y. Yu, R. Cary, N. Laulainen, and C. Berkowitz. 2009. Characterization of the sunset semi-continuous carbon aerosol analyzer. J. Air Waste Manage. Assoc. 59 (7):826–33. doi:10.3155/1047-3289.59.7.826.
- Besley, L. M., and G. A. Bottomley. 1974. Vapour pressure of toluence from 273.15 to 298.15 K. J. Chem. Thermodyn. 6 (6):577–80. doi:10.1016/0021-9614(74)90045-7.
- Bond, T. C., and R. W. Bergstrom. 2006. Light absorption by carbonaceous particles: An investigative review. Aerosol Sci. Technol. 40 (1):27–67. doi:10.1080/02786820500421521.
- Bond, T. C., S. J. Doherty, D. W. Fahey, P. M. Forster, T. Berntsen, B. J. DeAngelo, M. G. Flanner, S. Ghan, B. Kärcher, D. Koch, et al. 2013. Bounding the role of black carbon in the climate system: A scientific assessment. Geophy. Res. Atmos. 118 (11):5380–552. doi:10.1002/jgrd.50171.
- Bond, T. C., G. Habib, and R. W. Bergstrom. 2006. Limitations in the enhancement of visible light absorption due to mixing state. J. Geophys. Res. 111 (20):D20211. doi:10.1029/2006JD007315.
- Bond, T. C., D. G. Streets, K. F. Yarber, S. M. Nelson, J. Woo, and Z. Klimont. 2004. A technology-based global inventory of black and organic carbon emissions from combustion. J. Geophys. Res. 109:D14203. doi:10.1029/2003JD003697.
- Budisulistiorini, S. H., M. Riva, M. Williams, J. Chen, M. Itoh, J. D. Surratt, and M. Kuwata. 2017. Light-absorbing brown carbon aerosol constituents from combustion of Indonesian peat and biomass. Environ. Sci. Technol. 51 (8):4415–23. doi:10.1021/acs.est.7b00397.
- Caserini, S., S. Galante, S. Ozgen, S. Cucco, K. De Gregorio, and M. Moretti. 2013. A methodology for elemental and organic carbon emission inventory and results for Lombardy region, Italy Stefano. Sci. Total Environ. 450–451:22–30. doi:10.1016/j.scitotenv.2013.01.073.
- Chakrabarty, R. K., M. Gyawali, R. L. N. Yatavelli, A. Pandey, A. C. Watts, J. Knue, L.-W. A. Chen, R. R. Pattison, A. Tsibart, V. Samburova, et al. 2016. Brown carbon aerosols from burning of boreal peatlands: Microphysical properties, emission factors, and implications for direct radiative forcing. Atmos. Chem. Phys. 16 (5):3033–40. doi:10.5194/acp-16-3033-2016.
- Chakrabarty, R. K., H. Moosmüller, L. W. A. Chen, K. Lewis, W. P. Arnott, C. Mazzoleni, M. K. Dubey, C. E. Wold, W. M. Hao, and S. M. Kreidenweis. 2010. Brown carbon in tar balls from smoldering biomass combustion. Atmos. Chem. Phys. 10 (13):6363–70. doi:10.5194/acp-10-6363-2010.
- Chen, W. N., Y. C. Chen, C. Y. Kuo, C. H. Chou, C. H. Cheng, C. C. Huang, and S. Y. Chang. 2014. The real-time method of assessing the contribution of individual sources on visibility degradation in Taichung. Sci. Total Environ. 497–498 (110):219–28. doi:10.1016/j.scitotenv.2014.07.120.
- Chen, Y., and T. C. Bond. 2009. Light absorption by organic carbon from wood combustion. Atmos. Chem. Phys. Discuss. 9 (5):20471–513. doi:10.5194/acpd-9-20471-2009.
- Cheng, Y., K. B. He, F. K. Duan, M. Zheng, Y. L. Ma, J. H. Tan, and Z. Y. Du. 2010. Improved measurement of carbonaceous aerosol: Evaluation of the sampling artifacts and inter-comparison of the thermal-optical analysis methods. Atmos. Chem. Phys. 10 (17):8533–48. doi:10.5194/acp-10-8533-2010.
- Chow, J. C., J. G. Watson, L. W. A. Chen, W. P. Arnott, H. Moosmüller, and K. Fung. 2004. Equivalence of elemental carbon by thermal/optical reflectance and transmittance with different temperature protocols. Environ. Sci. Technol. 38 (16):4414–22. doi:10.1021/es034936u.
- Chow, J. C., J. G. Watson, L. W. A. Chen, M. C. O. Chang, N. F. Robinson, D. Trimble, and S. Kohl. 2007. The IMPROVE_A temperature protocol for thermal/optical carbon analysis: Maintaining consistency with a long-term database. J. Air Waste Manage. Assoc. 57 (9):1014–23. doi:10.3155/1047-3289.57.9.1014.
- Chow, J. C., J. G. Watson, D. Crow, D. H. Lowenthal, and T. Merrifield. 2001. Comparison of IMPROVE and NIOSH carbon measurements. Aerosol Sci. Technol. 34 (1):23–34. doi:10.1080/02786820119073.
- Chow, J. C., J. G. Watson, D. H. Lowenthal, L. Antony, N. Motallebi, J. C. Chow, and J. G. Watson. 2010. Black and organic carbon emission inventories: Review and application to California black and organic carbon emission inventories: Review and application to California. J. Air Waste Manage. Assoc. 60 (4):497–507. doi:10.3155/1047-3289.60.4.497.
- Claeys, M., R. Vermeylen, F. Yasmeen, Y. Gómez-González, X. Chi, W. Maenhaut, T. Mészáros, and I. Salma. 2012. Chemical characterisation of humic-like substances from urban, rural and tropical biomass burning environments using liquid chromatography with UV/Vis photodiode array detection and electrospray ionisation mass spectrometry. Environ. Chem. 9 (3):273–84. doi:10.1071/EN11163.
- Cross, E. S., J. G. Slowik, P. Davidovits, J. D. Allan, D. R. Worsnop, J. T. Jayne, D. K. Lewis, M. Canagaratna, and T. B. Onasch. 2007. Laboratory and ambient particle density determinations using light scattering in conjunction with aerosol mass spectrometry. Aerosol Sci. Technol. 41 (4):343–59. doi:10.1080/02786820701199736.
- Du, Z., K. He, Y. Cheng, F. Duan, Y. Ma, J. Liu, X. Zhang, M. Zheng, and R. Weber. 2014a. A yearlong study of water-soluble organic carbon in Beijing I: Sources and its primary vs. secondary nature. Atmos. Environ. 92:514–21. doi:10.1016/j.atmosenv.2014.04.060.
- Du, Z., K. He, Y. Cheng, F. Duan, Y. Ma, J. Liu, X. Zhang, M. Zheng, and R. Weber. 2014b. A yearlong study of water-soluble organic carbon in Beijing II: Light absorption properties. Atmos. Environ. 89:235–41. doi:10.1016/j.atmosenv.2014.02.022.
- Fischer, D. A., and G. D. Smith. 2018. A portable, four-wavelength, single-cell photoacoustic spectrometer for ambient aerosol absorption. Aerosol Sci. Technol. 52 (4):393–406. doi:10.1080/02786826.2017.1413231.
- Gao, S., J. D. Surratt, E. M. Knipping, E. S. Edgerton, M. Shahgholi, and J. H. Seinfeld. 2006. Characterization of polar organic components in fine aerosols in the southeastern United States: Identity, origin, and evolution. J. Geophys. Res. 111 (14):D14314. doi:10.1029/2005JD006601.
- Hoffer, A., A. Tóth, I. Nyirő-Kósa, M. Pósfai, and A. Gelencsér. 2016. Light absorption properties of laboratory-generated tar ball particles. Atmos. Chem. Phys. 16 (1):239–46. doi:10.5194/acp-16-239-2016.
- Hoffer, A., Á. Tóth, M. Pósfai, C. E. Chung, and A. Gelencsér. 2017. Brown carbon absorption in the red and near-infrared spectral region. Atmos. Chem. Phys. 10 (6):2353–59. doi:10.5194/amt-10-2353-2017.
- Hong, L., G. Liu, L. Zhou, J. Li, H. Xu, and D. Wu. 2017. Emission of organic carbon, elemental carbon and water-soluble ions from crop straw burning under flaming and smoldering conditions. Particuology 31:181–90. doi:10.1016/j.partic.2016.09.002.
- Jacobson, M. Z. 2001. Strong radiative heating due to the mixing state of black carbon in atmospheric aerosols. Nature 409 (6821):695–97. doi:10.1038/35055518.
- Jeong, C. H., P. K. Hopke, E. Kim, and D. W. Lee. 2004. The comparison between thermal-optical transmittance elemental carbon and aethalometer black carbon measured at multiple monitoring sites. Atmos. Environ. 38 (31):5193–204. doi:10.1016/j.atmosenv.2004.02.065.
- Johansson, K. O., M. P. Head-Gordon, P. E. Schrader, K. R. Wilson, and H. A. Michelsen. 2018. Resonance-stabilized hydrocarbon-radical chain reactions may explain soot inception and growth. Science 361(6406):997–1000. doi:10.1126/science.aat3417.
- Karanasiou, A., M. C. Minguillón, M. Viana, A. Alastuey, J.-P. Putaud, W. Maenhaut, P. Panteliadis, G. Močnik, O. Favez, and T. A. J. Kuhlbusch. 2015. Thermal-optical analysis for the measurement of elemental carbon (EC) and organic carbon (OC) in ambient air a literature review. Atmos. Meas. Tech. Discuss. 8 (9):9649–712. doi:10.5194/amtd-8-9649-2015.
- Kirchstetter, T. W., C. E. Corrigan, and T. Novakov. 2001. Laboratory and field investigation of the adsorption of gaseous organic compounds onto quartz filters. Atmos. Environ. 35 (9):1663–71. doi:10.1016/S1352-2310(00)00448-9.
- Kirchstetter, T. W., T. Novakov, and P. V. Hobbs. 2004. Evidence that the spectral dependence of light absorption by aerosols is affected by organic carbon. J. Geophys. Res. 109 (21):D21208. doi:10.1029/2004JD004999.
- Kirchstetter, T. W., and T. L. Thatcher. 2012. Contribution of organic carbon to wood smoke particulate matter absorption of solar radiation. Atmos. Chem. Phys. 12 (14):6067–72. doi:10.5194/acp-12-6067-2012.
- Lack, D. A., and C. D. Cappa. 2010. Impact of brown and clear carbon on light absorption enhancement, single scatter albedo and absorption wavelength dependence of black carbon. Atmos. Chem. Phys. 10 (9):4207–20. doi:10.5194/acp-10-4207-2010.
- Lack, D. A., and J. M. Langridge. 2013. On the attribution of black and brown carbon light absorption using the Ångström exponent. Atmos. Chem. Phys. 13 (20):10535–43. doi:10.5194/acp-13-10535-2013.
- Lambe, A. T., C. D. Cappa, P. Massoli, T. B. Onasch, S. D. Forestieri, A. T. Martin, M. J. Cummings, D. R. Croasdale, W. H. Brune, D. R. Worsnop, et al. 2013. Relationship between oxidation level and optical properties of secondary organic aerosol. Environ. Sci. Technol. 47 (12):6349–57. doi:10.1021/es401043j.
- Laskin, A., J. Laskin, and S. A. Nizkorodov. 2015. Chemistry of atmospheric brown carbon. Chem. Rev. 115 (10):4335–82. doi:10.1021/cr5006167.
- Lautenberger, C. W., J. L. De Ris, N. A. Dembsey, J. R. Barnett, and H. R. Baum. 2005. A simplified model for soot formation and oxidation in CFD simulation of non-premixed hydrocarbon flames. Fire Saf. J. 40 (2):141–76. doi:10.1016/j.firesaf.2004.10.002.
- Li, W., Z. Liu, Z. Wang, and H. Dou. 2015. Experimental and theoretical analysis of effects of atomic, diatomic and polyatomic inert gases in air and EGR on mixture properties, combustion, thermal efficiency and NOx emissions of a pilot-ignited NG engine. Energy Convers. Manage. 105:1082–95. doi:10.1016/j.enconman.2015.08.052.
- Li, X., Y. Chen, and T. C. Bond. 2016. Light absorption of organic aerosol from pyrolysis of corn stalk. Atmos. Environ. 144:249–56. doi:10.1016/j.atmosenv.2016.09.006.
- Lin, P., P. K. Aiona, Y. Li, M. Shiraiwa, J. Laskin, S. A. Nizkorodov, and A. Laskin. 2016. Molecular characterization of brown carbon in biomass burning aerosol particles. Environ. Sci. Technol. 50 (21):11815–24. doi:10.1021/acs.est.6b03024.
- Ma, J., X. Li, P. Gu, T. R. Dallmann, A. A. Presto, and N. M. Donahue. 2016. Estimating ambient particulate organic carbon concentrations and partitioning using thermal optical measurements and the volatility basis set. Aerosol Sci. Technol. 50 (6):638–51. doi:10.1080/02786826.2016.1158778.
- Malloy, Q. G. J., S. Nakao, L. Qi, R. Austin, C. Stothers, H. Hagino, and D. R. Cocker. 2009. Real-Time aerosol density determination utilizing a modified scanning mobility particle sizer aerosol particle mass analyzer system. Aerosol Sci. Technol. 43 (7):673–78. doi:10.1080/02786820902832960.
- Martinsson, J., A. C. Eriksson, I. E. Nielsen, V. B. Malmborg, E. Ahlberg, C. Andersen, R. Lindgren, R. Nyström, E. Z. Nordin, W. H. Brune, et al. 2015. Impacts of combustion conditions and photochemical processing on the light absorption of biomass combustion aerosol. Environ. Sci. Technol. 49 (24):14663–71. doi:10.1021/acs.est.5b03205.
- Michelsen, H. A. 2017. Probing soot formation, chemical and physical evolution, and oxidation: A review of in situ diagnostic techniques and needs. Proc. Combust. Inst. 36 (1):717–35. doi:10.1016/j.proci.2016.08.027.
- Moosmüller, H., R. K. Chakrabarty, and W. P. Arnott. 2009. Aerosol light absorption and its measurement: A review. J. Quantitative Spectrosc. Radiat. Transf. 110 (11):844–78. doi:10.1016/j.jqsrt.2009.02.035.
- Moosmüller, H., R. K. Chakrabarty, K. M. Ehlers, and W. P. Arnott. 2011. Absorption Ångström coefficient, brown carbon, and aerosols: Basic concepts, bulk matter, and spherical particles. Atmos. Chem. Phys. 11 (3):1217–25. doi:10.5194/acp-11-1217-2011.
- Olson, M. R., M. Victoria Garcia, M. A. Robinson, P. Van Rooy, M. A. Dietenberger, M. Bergin, and J. J. Schauer. 2015. Investigation of black and brown carbon multiple-wavelength-dependent light absorption from biomass and fossil fuel combustion source emissions. J. Geophys. Res. Atmos. 120(13):6682–97. doi:10.1002/2014JD022970.Received.
- Petzold, A., J. A. Ogren, M. Fiebig, P. Laj, S.-M. Li, U. Baltensperger, T. Holzer-Popp, S. Kinne, G. Pappalardo, et al. 2013. Recommendations for reporting black carbon measurements. Atmos. Chem. Phys. 13 (16):8365–79. doi:10.5194/acp-13-8365-2013.
- Phillips, S. M., and G. D. Smith. 2014. Light absorption by charge transfer complexes in brown carbon aerosols. Environ. Sci. Technol. Lett. 1 (10):382–86. doi:10.1021/ez500263j.
- Phillips, S. M., and G. D. Smith. 2015. Further evidence for charge transfer complexes in brown carbon aerosols from excitation-emission matrix fluorescence spectroscopy. J. Phys. Chem. 119 (19):4545–51. doi:10.1021/jp510709e.
- Pokhrel, R. P., N. L. Wagner, J. M. Langridge, D. A. Lack, T. Jayarathne, E. A. Stone, C. E. Stockwell, R. J. Yokelson, and S. M. Murphy. 2016. Parameterization of single-scattering albedo (SSA) and absorption Ångström exponent (AAE) with EC/OC for aerosol emissions from biomass burning. Atmos. Chem. Phys. 16 (15):9549–61. doi:10.5194/acp-16-9549-2016.
- Poudel, S., M. Fiddler, D. Smith, K. Flurchick, and S. Bililign. 2017. Optical properties of biomass burning aerosols: Comparison of experimental measurements and T-Matrix calculations. Atmosphere 8 (12):228. doi:10.3390/atmos8110228.
- Qiu, C., A. F. Khalizov, and R. Zhang. 2012. Soot aging from OH-Initiated oxidation of toluene. Environ. Sci. Technol. 46 (17):9464–72. doi:10.1021/es301883y.
- Rissler, J., E. Z. Nordin, A. C. Eriksson, P. T. Nilsson, M. Frosch, M. K. Sporre, A. Wierzbicka, B. Svenningsson, J. Löndahl, M. E. Messing, et al. 2014. Effective density and mixing state of aerosol particles in a near-traffic urban environment. Environ. Sci. Technol. 48 (11):6300–08. doi:10.1021/es5000353.
- Rizzo, L. V., P. Artaxo, T. Müller, A. Wiedensohler, M. Paixão, G. G. Cirino, A. Arana, E. Swietlicki, P. Roldin, E. O. Fors, et al. 2013. Long term measurements of aerosol optical properties at a primary Forest site in Amazonia. Atmos. Chem. Phys. 13 (5):2391–413. doi:10.5194/acp-13-2391-2013.
- Rizzo, L. V., A. L. Correia, P. Artaxo, A. S. Procópio, and M. O. Andreae. 2011. Spectral dependence of aerosol light absorption over\newline the Amazon basin. Atmos. Chem. Phys. 11 (17):8899–912. doi:10.5194/acp-11-8899-2011.
- Roden, C. A., T. C. Bond, S. Conway, and A. B. Osorto Pinel. 2006. Emission factors and real-time optical properties of particles emitted from traditional wood burning cookstoves. Environ. Sci. Technol. 40 (21):6750–57. doi:10.1021/es052080i.
- Salako, G. O., P. K. Hopke, D. D. Cohen, B. A. Begum, S. K. Biswas, G. G. Pandit, S. Lodoysamba, W. Wimolwattanapun, S. Bunprapob, Y.-S. Chung, et al. 2012. Exploring the variation between EC and BC in a variety of locations. Aerosol Air Quality Res. 12 (1):1–7. doi:10.4209/aaqr.2011.09.0150.
- Saleh, R., Z. Cheng, and K. Atwi. 2018. The brown–black continuum of light-absorbing combustion aerosols. Environ. Sci. Technol. Lett. 5 (8):508–13. doi:10.1021/acs.estlett.8b00305.
- Saleh, R., C. J. Hennigan, G. R. McMeeking, W. K. Chuang, E. S. Robinson, H. Coe, N. M. Donahue, and A. L. Robinson. 2013. Absorptivity of brown carbon in fresh and photo-chemically aged biomass-burning emissions. Atmos. Chem. Phys. 13 (15):7683–93. doi:10.5194/acp-13-7683-2013.
- Saleh, R., E. S. Robinson, D. S. Tkacik, A. T. Ahern, S. Liu, A. C. Aiken, R. C. Sullivan, A. A. Presto, M. K. Dubey, R. J. Yokelson, et al. 2014. Brownness of organics in aerosols from biomass burning linked to their black carbon content. Nature Geosci. 7 (9):647–50. doi:10.1038/ngeo2220.
- Sarangi, B., S. G. Aggarwal, D. Sinha, and P. K. Gupta. 2016. Aerosol effective density measurement using scanning mobility particle sizer and quartz crystal microbalance with the estimation of involved uncertainty. Atmos. Meas. Tech. 9 (3):859–75. doi:10.5194/amt-9-859-2016.
- Schmid, O., D. Chand, E. Karg, P. Guyon, G. P. Frank, E. Swietlicki, and M. O. Andreae. 2009. Derivation of the density and refractive index of organic matter and elemental carbon from closure between physical and chemical aerosol properties derivation of the density and refractive index of organic matter and elemental carbon from closure Between. Environ. Sci. Technol. 43 (4):1166–72. doi:10.1021/es800570p.
- Schnitzler, E. G., A. Dutt, A. M. Charbonneau, J. S. Olfert, and W. Jäger. 2014. Soot aggregate restructuring due to coatings of secondary organic aerosol derived from aromatic precursors. Environ. Sci. Technol. 48 (24):14309–16. doi:10.1021/es503699b.
- Selimovic, V., R. J. Yokelson, C. Warneke, J. M. Roberts, J. de Gouw, J. Reardon, and D. W. T. Griffith. 2018. Aerosol optical properties and trace gas emissions from laboratory-simulated Western US wildfires. Atmos. Chem. Phys. 18 (4):2929–48. doi:10.5194/acp-18-2929-2018.
- Shen, G., S. Tao, S. Wei, Y. Zhang, R. Wang, B. Wang, W. Li, H. Shen, Y. Huang, Y. Chen, et al. 2012. Reductions in emissions of carbonaceous particulate matter and polycyclic aromatic hydrocarbons from combustion of biomass pellets in comparison with raw fuel burning. Environ. Sci. Technol. 46 (11):6409–16. doi:10.1021/es300369d.
- Slowik, J. G., E. S. Cross, J. H. Han, J. Kolucki, P. Davidovits, L. R. Williams, T. B. Onasch, J. T. Jayne, C. E. Kolb, and D. R. Worsnop. 2007. Measurements of morphology changes of fractal soot particles using coating and denuding experiments: Implications for optical absorption and atmospheric lifetime. Aerosol Sci. Technol. 41 (8):734–50. doi:10.1080/02786820701432632.
- Slowik, J. G., K. Stainken, P. Davidovits, L. R. Williams, J. T. Jayne, C. E. Kolb, D. R. Worsnop, Y. Rudich, P. F. DeCarlo, and J. L. Jimenez. 2004. Particle morphology and density characterization by combined mobility and aerodynamic diameter measurements. Part 2: Application to combustion-generated soot aerosols as a function of fuel equivalence ratio. Aerosol Sci. Technol. 38 (12):1206–22. doi:10.1080/027868290903916.
- Soewono, A., and S. N. Rogak. 2013. Morphology and optical properties of numerically simulated soot aggregates. Aerosol Sci. Technol. 47 (3):267–74. doi:10.1080/02786826.2012.749972.
- Sorensen, C. M. 2001. Light scattering by fractal aggregates: A review. Aerosol Sci. Technol. 35 (2):648–87. doi:10.1080/02786820117868.
- Stockwell, C. E., T. Jayarathne, M. A. Cochrane, K. C. Ryan, E. I. Putra, B. H. Saharjo, A. D. Nurhayati, I. Albar, D. R. Blake, I. J. Simpson, et al. 2016. Field measurements of trace gases and aerosols emitted by peat fires in Central Kalimantan, Indonesia, during the 2015 El niño. Atmos. Chem. Phys 16 (18):11711–32. doi:10.5194/acp-16-11711-2016.
- Subramanian, R., A. Y. Khlystov, J. C. Cabada, and A. L. Robinson. 2004. Positive and negative artifacts in particulate organic carbon measurements with denuded and undenuded sampler configurations special issue of aerosol science and technology on findings from the fine particulate matter supersites program. Aerosol Sci. Technol. 38 (sup1):27–48. doi:10.1080/02786820390229354.
- Sumlin, B. J., C. Oxford, B. Seo, R. Pattison, B. J. Williams, and R. K. Chakrabarty. 2018. Density and homogeneous internal composition of primary brown carbon aerosol. Environ. Sci. Technol. 52 (7):3982–89. doi:10.1021/acs.est.8b00093.
- Sun, J., Z. Shen, L. Zhang, Q. Zhang, Y. Lei, J. Cao, Y. Huang, S. Liu, C. Zheng, H. Xu, et al. 2018. Impact of primary and secondary air supply intensity in stove on emissions of size-segregated particulate matter and carbonaceous aerosols from apple tree wood burning. Atmospheric Res. 202:33–39. doi:10.1016/j.atmosres.2017.11.010.
- Sun, J., G. Zhi, R. Hitzenberger, Y. Chen, C. Tian, Y. Zhang, Y. Feng, M. Cheng, Y. Zhang, J. Cai, et al. 2017. Emission factors and light absorption properties of brown carbon from household coal combustion in China. Atmos. Chem. Phys. 17 (7):4769–80. doi:10.5194/acp-17-4769-2017.
- Turns, S. R. 2000. An introduction to combustion: Concepts and applications. 2nd ed. New York, NY: The McGraw-Hill Companies, Inc.
- Turpin, B. J., J. J. Huntzicker, and S. V. Hering. 1994. Investigation of organic aerosol sampling artifacts in the Los Angeles basin. Atmos. Environ. 28 (19):3061–71. doi:10.1016/1352-2310(94)00133-6.
- Turpin, B. J., P. Saxena, and E. Andrews. 2000. Measuring and simulating particulate organics in the atmosphere: Problems and prospects. Atmos. Environ. 34 (18):2983–3013. doi:10.1016/S1352-2310(99)00501-4.
- Updyke, K. M., T. B. Nguyen, and S. A. Nizkorodov. 2012. Formation of brown carbon via reactions of ammonia with secondary organic aerosols from biogenic and anthropogenic precursors. Atmos. Environ. 63:22–31. doi:10.1016/j.atmosenv.2012.09.012.
- Utry, N., T. Ajtai, Á Filep, M. Dániel Pintér, A. Hoffer, Z. Bozoki, and G. Szabó. 2013. Mass specific optical absorption coefficient of HULIS aerosol measured by a four-wavelength photoacoustic spectrometer at NIR, VIS and UV wavelengths. Atmos. Environ. 69:321–324. doi:10.1016/j.atmosenv.2013.01.003.
- Vandaele, A. C. 2002. High-resolution Fourier transform measurement of the NO 2 visible and near-infrared absorption cross sections: Temperature and pressure effects. J. Geophys. Res. 107 (D18):4348. doi:10.1029/2001JD000971.
- Vicente, E. D., M. A. Duarte, A. I. Calvo, T. F. Nunes, L. A. C. Tarelho, D. Custódio, C. Colombi, V. Gianelle, A. Sanchez de la Campa, and C. A. Alves. 2015. Influence of operating conditions on chemical composition of particulate matter emissions from residential combustion. Atmospheric Res. 166:92–100. doi:10.1016/j.atmosres.2015.06.016.
- Wagnon, S. W., and M. S. Wooldridge. 2014. Effects of buffer gas composition on autoignition. Combust. Flame 161 (4):898–907. doi:10.1016/j.combustflame.2013.09.022.
- Watson, J. G., J. C. Chow, and L. A. Chen. 2005. Summary of organic and elemental carbon/black carbon analysis methods and intercomparisons. Aerosol Air Quality Res. 5 (1):65–102. doi:10.4209/aaqr.2005.06.0006.
- Willingham, C. B., W. J. Taylor, J. M. Pignocco, and F. D. Rossini. 1945. Vapor pressures and boiling points of some paraffin, alkylcyclopentane, alkylcyclohexane, and alkylbenzene hydrocarbons. J. Res. Nat. Bur. Stand. 35 (3):219. doi:10.6028/jres.035.009.
- Xie, M., M. D. Hays, and A. L. Holder. 2017. Light-Absorbing organic carbon from prescribed and laboratory biomass burning and gasoline vehicle emissions. Sci. Rep. 7 (1):1–9. doi:10.1038/s41598-017-06981-8.
- Yang, M., S. G. Howell, J. Zhuang, and B. J. Huebert. 2009. Attribution of aerosol light absorption to black carbon, brown carbon, and dust in China - Interpretations of atmospheric measurements during EAST-AIRE. Atmos. Chem. Phys. 9 (6):2035–50. doi:10.5194/acp-9-2035-2009.
- Zhang, X., Y. H. Lin, J. D. Surratt, and R. J. Weber. 2013. Sources, composition and absorption Ångström exponent of light-absorbing organic components in aerosol extracts from the Los Angeles basin. Environ. Sci. Technol. 47 (8):3685–3693. doi:10.1021/es305047b.
- Zhang, Y., Q. Zhang, Y. Cheng, H. Su, S. Kecorius, Z. Wang, Z. Wu, M. Hu, T. Zhu, A. Wiedensohler, and K. He. 2016. Measuring the morphology and density of internally mixed black carbon with SP2 and VTDMA: New insight into the absorption enhancement of black carbon in the atmosphere. Atmos. Meas. Tech. 9 (4):1833–43. doi:10.5194/amt-9-1833-2016.