
 ?Mathematical formulae have been encoded as MathML and are displayed in this HTML version using MathJax in order to improve their display. Uncheck the box to turn MathJax off. This feature requires Javascript. Click on a formula to zoom.
Abstract
We suggest a two-dimensional model of adsorption of trace atmospheric gases by mineral dust particles with origin from desert soils. The model is based on the application of theory of turbulent diffusion in the atmospheric boundary layer (ABL) in conjunction with the model of gas adsorption by porous solid particles. The numerical model is formulated using parameterizations based on eolian (by wind) dust emission experiments. The eolian field experiments were performed at a dust source (loess soil in Northern Negev, Israel) using a portable boundary layer wind tunnel to determine the emitted particulate matter (PM) fluxes for different wind speeds and varying soil conditions. The numerical analysis is performed for the adsorption of gas-phase HNO3 by dust PM. We determined numerically concentration distributions of the atmospheric dust PM, and trace gas using shear velocity and emitted dust flux from the soils employed in the experiments. Analysis was performed for the case of neutral and slightly stable stratification of ABL typical for dust storm events in the East Mediterranean. The numerical analysis showed that during dust events the slightly stable atmosphere is characterized by higher concentration of PM10 in the surface layer than the neutrally stable atmosphere. It is found that in the case of neutral stratification as well as for stable atmospheric stratification the concentration of nitric acid HNO3 strongly depends on concentration of atmospheric dust particles. The developed model enhances our capacity of quantification of atmospheric dust effects in climate models as well as health risk assessment.
Copyright © 2019 American Association for Aerosol Research
1. Introduction
Scavenging of active trace gases by aerosols is a result of gas adsorption. Adsorption of active trace gases by aerosols causes spatial and temporal changes of gas concentration in the atmosphere. The mass of all aerosols emitted in the Earth atmosphere during 1 year exceeds Tg (Boucher Citation2015), while a mean lifetime of aerosol particles in the atmosphere do not exceed 3 weeks. Thus, the total year-averaged mass of aerosols in the atmosphere is equal to 100 Tg. Dust aerosols with origin from desert soils constitute the major amount of the total atmospheric particles. Since the specific surface area of atmospheric mineral dust aerosols exceeds a value of 10
(see Adams, Rodriguez, and Cox Citation2005), the total active internal surface area of mineral dust atmospheric aerosols which can adsorb active trace gases is of the order of
, i.e., is larger than a surface area of dry land of the Earth.
Examples of gases, which can be noticeably scavenged by a dust storm of average intensity and duration, are nitric acid vapor (HNO3), sulfur dioxide (SO2), water vapor (H2O), radioisotope of iodine (I-131) and volatile organic compounds (VOCs) (e.g., Karydis et al. Citation2016). International Agency for Research on Cancer (see IARC Citation2013) indicates that the major air pollutants with adversely affecting human health are sulfur dioxide (SO2), nitrogen dioxide (NO2), ozone (O3) and atmospheric particulate matter (PM). The scavenging coefficient of active trace atmospheric gases irreversibly absorbed by rain droplets such as HNO3 is higher than the scavenging coefficient of atmospheric aerosols with the size of the order ≤10 μm at the same value of rain intensity (e.g., Seinfeld and Pandis Citation2016, 863, 873). Therefore, the wet deposition velocity of HNO3 gas is higher than the wet deposition velocity of atmospheric PM10. Thus, trace gases, adsorbed by aerosols can be transported to large distances and can cross continents and oceans. Deposition of atmospheric aerosols into open ocean areas followed by dissolution of active chemical constituents may affect the oceanic biogeochemistry (Chen et al. Citation2012).
One of the main reasons for strong scavenging ability of the above-mentioned gases by mineral dust is a high value of Henry constant of adsorption of these gases (). Nevertheless, concentration of ozone (O3) in the troposphere also decreases appreciably after the dust storm in spite of the low Henry’s constant of adsorption for O3. Indeed, measurements performed by Umann et al. (Citation2005) revealed the up to 30% decrease of ozone concentration after a dust storm in Sahara. Decrease of the ozone concentration after dust storms can be explained as follows. Formation of tropospheric ozone requires sunlight, and presence of VOCs and NOx, where NOx plays a role of catalyst (Dentener and Crutzen Citation1993). Photochemistry accounts for the formation of approximately 4500 Tg of ozone per year in the troposphere while annual flux of ozone that arrives from the stratosphere is smaller by an order of magnitude. Ozone is permanently formed in the troposphere, and is removed from the troposphere by chemical processes, e.g., by reaction with HO2 and HO radicals, and by deposition to the surface of the oceans (Calvert et al. Citation2015). Nitric acid vapor uptake by mineral dust prevents its renoxification by photolysis and reaction with OH, responsible for nitrogen dioxide formation. Depending on the atmospheric conditions, ozone formation can be either NO2-limited or VOCs-limited (see Calvert et al. Citation2015). Note that Henry’s constant of adsorption for NO2 is very low, and this gas is poorly adsorbed by mineral dust while all VOCs are effectively scavenged by mineral dust due to their high value of Henry’s constant. Therefore, even small reduction of HNO3 or VOCs concentrations due to adsorption on mineral aerosols during dust storm can lead to the interruption of ozone formation and decrease of ozone concentration in the troposphere because the process of ozone decomposition still continues.
Table 1. Henry’s law constants of adsorption of trace atmospheric gases by mineral dust and at T = 295 K.
Reduction of ozone concentration after dust storm can affect significantly atmospheric chemistry and physics. Tropospheric ozone can filter a small unabsorbed part of ultraviolet radiation that remains after passage through stratospheric ozone that prevents sunburn in humans and DNA damage in living tissues in animals and plants. Tropospheric ozone is also an atmospheric pollutant. For example, ozone photolysis by UV light produces hydroxyl radical that leads to the formation of components of photochemical smog such as peroxyacyl nitrates, which at the same time can be powerful eye irritants. Ozone being one of the main natural greenhouse gases absorbs some of the infrared radiation emitted from the earth’s surface. Radiative forcing of tropospheric ozone is estimated to be about 25% that of carbon dioxide (see Calvert et al. Citation2015 and references in this book).
Adsorption of water vapor by atmospheric mineral dust particle can change the ability of a particle to act as CCN/ICN. When the dust particle is covered with a water film, its surface becomes hydrophilic and condensation on its surface occurs (Seisel et al. Citation2005). Water vapor adsorption on mineral dust can enhance the uptake coefficient of nitric acid (Goodman, Bernard and Grassian Citation2001). Water vapor adsorption causes swelling of aerosol particles that increases particle size and changes mechanical properties of particles (Metzger et al. Citation2016). These effects may cause cracking of particles, change their coagulation and particle size distribution. In addition, reactions of mineral dust with gaseous nitric acid cause changes in the oxidative potential of the atmospheric particles and increase the water-soluble fraction of many elements, including calcium, iron, magnesium, zinc and lead (Zhan et al. Citation2018).
Starting from 1955, numerous investigations of active gas adsorption by solid porous particles were motivated by engineering applications, e.g., chromatography, catalysis, refrigeration technology, etc. (Glueckauf Citation1955; Bidabehere, Garcia and Sedran Citation2017). Mathematical models of gas adsorption by solid porous particles in engineering considered both solid (surface) and pore diffusion and employed different adsorption isotherms. Chamberlain et al. (Citation1960), Hu, Chen and Hao (Citation2013), Liu et al. (Citation2013) and Chen and Hu (Citation2014) developed mathematical models of active trace gas adsorption by single atmospheric aerosols. All these studies employed a linear form of an isotherm of adsorption for the analysis of mass transfer.
A number of studies were devoted to analysis of an influence of mineral dust aerosols on chemical perturbations in the global troposphere. In particular, Dentener et al. (Citation1996) studied effects of mineral dust aerosols on the chemistry of SOx (SO2+sulfate), NOy (NOx + HNO3) and ozone using the global three-dimensional coarse resolution model for simulation of transport processes in the atmosphere.
De Reus et al. (Citation2005) used chemical box models in conjunction with global and regional chemical-transport models for analysis of evolution of active trace gas concentration in the atmosphere driven by trace gas scavenging by mineral dust. The authors applied the developed model to explain strong reduction of concentrations of ROx (HO2, CH3O2 and higher organic peroxy radicals), H2O2, NOx and O3 after dust storm in Sahara in 2002. Atmospheric measurements of Umann et al. (Citation2005) revealed a significant reduction of nitric acid vapor concentration after the dust storm. The decrease of nitric acid vapor in the atmosphere allows determining the uptake coefficient, , from the in situ measurements. However, the authors did not observed interaction between mineral dust and sulfur dioxide (SO2) in the atmosphere. Dentener and Crutzen (Citation1993) studied interaction of
with tropospheric aerosols using a three-dimensional model of the troposphere. Their study revealed that heterogeneous reactions of
and
on aerosols affect concentrations of
,
and OH. Soler et al. (Citation2016) conducted field investigations of tropospheric ozone depletion during mineral dust outbreaks. Romanias et al. (Citation2016) overviewed investigations of interaction of mineral dust and inorganic and organic species. Direct, indirect and semi-direct effect of dust aerosols on atmospheric climate change are discussed by Evan et al. (Citation2011), Huang et al. (Citation2014) and Chen et al. (Citation2017).
In the present study. we suggest a 2D model of adsorption of trace atmospheric constituents (in particular, gaseous HNO3) by mineral PM emitted from area source in a desert. Gas adsorption by dust particles is an increase of active gas concentration in the vicinity of external and internal interphases of porous particles. Gas adsorption is caused by non-compensation of intermolecular forces near gas–solid interphase. The nature of the physical adsorption forces is van der Waals interaction (Brunauer Citation1943). Our model is based on the application of theory of turbulent diffusion in the atmospheric boundary layer (ABL) in conjunction with the model of gas adsorption by porous solid particles. Note that although the numerical analysis is performed for the case of adsorption of gas-phase HNO3 by dust PM, the model is suitable for describing the adsorption of an arbitrary trace gas by dust particles.
2. Eolian experiments on dust emission
The mean wind velocity profile for the studied case is required for simulating the PM dispersion after emission of dust from the soil source. Assume that wind blows in x-direction and in ABL the wind velocity profile in stratified surface layer reads (Monin and Obukhov Citation1954):
(1)
(1)
Here is friction velocity, which is a scaling parameter proportional to the velocity gradient in boundary layer flow;
is the shear stress at the surface level and
is air density;
is standard deviation of velocity fluctuations (Bagnold Citation1941; Shao, Citation2008; Kok et al. Citation2012); k is the von Karman constant,
;
is the aerodynamic surface roughness length that is approximately equal 1/30 of the field roughness elements height in turbulent flow. In EquationEquation (1)
(1)
(1) ,
is the universal function (similarity function) of the dimensionless height
, and
is Monin–Obukhov length,
specific heat capacity of air at constant pressure,
is the ambient air density,
is the ambient temperature at the reference height,
is gravitational constant and
is the vertical heat flux.
Measurements of wind profiles have been conducted in the Northern Negev using a field experimental wind mast and wind tunnel (for details see Katra et al. Citation2016).
The friction velocity and aerodynamic roughness in EquationEquation (1)(1)
(1) were determined by fitting the experimental data obtained in field wind tunnel experiments. The portable boundary-layer wind tunnel has been designed to study dust emission in the field by simulating eolian processes (for details see Katra et al. Citation2016). The wind tunnel was operated at the experimental soil plots in the Northern Negev at fan frequencies of 32 and 44 Hz, which correspond to the average wind speeds in dust storms in the study area. The suggested model is formulated for two meteorological scenarios (neutral, and slightly stable ABL stratification) typical for the Northern Negev desert. In case of a neutral or slightly stable atmosphere, vertical motions of air are inhibited and turbulence is predominantly generated by wind shear. Herewith, the particles are transported by advection in the horizontal direction while the vertical transport of air and particles can be neglected. The effect of thermal stability becomes unimportant when the average wind speed increases above 6–7 m/s. At high wind speeds, the atmosphere is neutral (Goossens and Offer, Citation1995). Therefore, the fan frequencies were chosen in such a way as to correspond to the conditions typical for neutral (44 Hz) and slightly stable atmosphere (32 Hz). The wind speed profile was measured for each fan frequency. The measured vertical velocity profiles in the wind tunnel () fit the velocity profiles previously measured in the experiments with the 10 m wind mast equipped with 6 cup anemometers positioned at 0.68, 1.18, 2.0, 3.36, 5.64 and 9.43 m above ground level (Katra et al. Citation2016). Wind profiles measured in the portable wind tunnel in the loess bare soil (experimental plots) for fan frequencies of 32 and 44 Hz are shown in .
Figure 1. Wind profiles measured in the portable wind tunnel in the loess bare soil (experimental plots) for fan frequencies of 32 and 44 Hz.
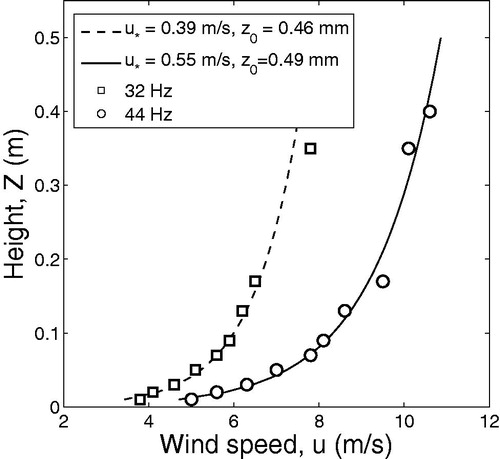
The best fit to the experimental data is determined for the friction (shear) velocities 0.39 and 0.55 m/s and the roughness 0.46 and 0.49 mm for the fan frequencies 32 and 44 Hz correspondingly with 95% confidence bounds.
During the wind tunnel experiments, the concentration of the suspended particles was measured by a real-time dust monitor for background PM10 values (DustTrak 8534, TSI Inc., Shoreview, MN, USA). The DustTrak that was installed in the test section of the wind tunnel recorded PM concentration (in μg m–3) over time during the dust emission experiments (for details see Katra et al. Citation2016). The dust fluxes from the soils () demonstrate the dependence on the soil particle composition (silt-clay content) and wind speed.
Table 2. Values for dust fluxes measured in open area for different wind speed and silt-clay content.
3. Description of the model
3.1. Governing equations
In this section, the theoretical model of adsorption of trace atmospheric gases by atmospheric dust emitted from soil source areas is described. In the atmosphere, typical vertical wind speed is of the order of 10−2 m/s while the typical horizontal wind speed is of the order of 10 m/s, i.e., . In view of this limitation, the trajectory of a dust particle can be calculated as an isentropic trajectory of air parcel taking into account the gravitational deposition of the particle (Shao Citation2008). It is assumed that terminal velocities of dust particles are smaller than the mean vertical component of the Lagrangian velocity of the air parcel containing these particles, i.e.,
. The last inequality is a necessary condition for a long residence time of a dust particle in the air.
Atmospheric measurements indicate that the particle size distribution of the atmospheric aerosol can vary with time due to various atmospheric processes, such as condensation or evaporation of liquid aerosols, coagulation of aerosol particles, or particles deposition. Effects of condensation as well as evaporation of droplets are not relevant to the typical desert dust. Coagulation is the collision of particles with their subsequent coalescence and the formation of more complex aggregates because of Brownian motion, the action of the electric field, as well as the action of hydrodynamic, gravitational and other forces.
Characteristic timescale for Brownian coagulation is , where
is Brownian coagulation coefficient. For considered dust storms, typical values of coagulation coefficient and dust particle concentration are
cm3/s and
cm−3. Thus, characteristic timescale for Brownian coagulation is of the order of 2 × 10⁶ s or more than 550 h.
The relative value of the turbulent shear and Brownian coagulation coefficients for equal size particles in the continuum regime can be estimated using the ratio (Seinfeld and Pandis, Citation2016, 561):
(2)
(2)
where
is the rate of dissipation of kinetic energy per unit mass,
is kinematic viscosity of the fluid,
is dynamic viscosity of the air,
is the Boltzmann constant,
is the temperature and
is the diameter of the particle. The estimations, performed using above equation indicate that coagulation by Brownian motion dominates the collisions of submicrometer particles in the atmosphere. Turbulent shear contributes to the coagulation of large particles under conditions characterized by intense turbulence (Pnueli, Gutfinger, and Fichman Citation1991).
In addition, observations confirm the conclusions about the insignificant contribution of coagulation to the change in particle concentration with time, as well as the change in particle size distribution with time. As it was noted by Jeong et al. (Citation2016), scanning electron microscopy (SEM) images of Saharan mineral dust particles showed that the individual dust particles were sufficiently separated from each other, with no coagulation occurring during deposition.
Mass transfer of dust particles and active trace gas (adsorbate) in the ABL can be described by the system of advection-diffusion equations:
(3)
(3)
where
is the jth component of atmospheric velocity,
,
is the concentration of species i in the atmosphere,
is the rate of addition or loss of species i at location
and time t. In the present model, we adopted the turbulence closure based on the hypothesis of the gradient transport (K-theory) (see Seinfeld and Pandis, Citation2016, Chapter 18):
(4)
(4)
where
are the diagonal components of eddy diffusivity tensor. We assume that the concentration of active trace gas in the atmosphere is significantly lower that the concentration of the carrier gas. Henceforward, we assume that vertical motions of air are inhibited, and particles and gases are transported by advection in a horizontal direction. Under the above assumptions, taking into account deposition of dust particles, the transport of dust particles emitted from area source and active trace gas (adsorbate) in the ABL is governed by the following system of steady-state advection-diffusion equations:
(5)
(5)
where is mean wind velocity in the downwind direction, which is determined by EquationEquation (1)
(1)
(1) ;
and
are the mean concentrations of dust particles and active trace gas correspondingly;
is vertical diffusion coefficient, and
is the rate of loss of active gas due to adsorption by dust particles,
is adsorption rate coefficient for the trace gas;
is the terminal settling velocity of deposited dust particles (Seinfeld and Pandis, Citation2016, 373):
(7)
(7)
where
is the diameter of the dust particle,
is the density of the dust particle;
is gravitational acceleration;
is the Cunningham slip correction factor;
is the coefficient of the dynamic viscosity of the air.
Regarding the EquationEquations (5)(5)
(5) and Equation(6)
(6)
(6) , it is important to note that in the case when atmosphere is stable or neutrally stable, turbulence is predominantly generated by wind shear. Consequently, vertical motions of air are inhibited, particles are transported by advection in the horizontal direction while vertical transport of air and particles can be neglected. In the unstable atmosphere, there is upward air and particle transport, and vertical motions of air and particles must be taken into account in EquationEquations (5)
(5)
(5) and Equation(6)
(6)
(6) .
The adsorption rate coefficient in EquationEquation (6)
(6)
(6) is determined by kinetics of adsorption by mineral dust particles and can be calculated as follows (for details see our previous study Elperin et al. Citation2017):
(8)
(8)
where
and
is the particle density (
g/cm3); m is dimensionless Henry’s constant of adsorption;
is characteristic diffusion time;
is the radius of the dust particle and
is the gaseous-phase controlled mass transfer coefficient. Note that the rate of gas adsorption in EquationEquations (6)
(6)
(6) and Equation(8)
(8)
(8) is the function of concentration of particles and time. However, using the transformation
, we can obtain an expression for the rate of adsorption as a function, which is implicitly depending on time (Elperin et al. Citation2017).
Since vertical motions are required to lift dust particles from the ground, the unstable ABL is the most favorable for the occurrence of dust storms. In contrast, stable ABL suppresses vertical motions and inhibits dust lofting. Herewith, the dust concentration in the ABL strongly depends on the degree of atmospheric stability and it is different for the fine (PM2.5) and coarse (PM10) dust particles (Goroch, Burk, and Davidson Citation1980; Choularton, Fullarton, and Gay Citation1982; Anderson Citation1987; Goossens and Offer Citation1995). The diurnal change of atmospheric stability has also important consequences with respect to the dust in the air. In most arid regions with the lack of vegetation, the ground can experience extreme daytime heating, which creates an unstable stratification in the ABL. As the amount of heating increases, the unstable layer deepens. However, important seasonal variations are observed (Goossens and Offer Citation1995). Atmospheric instability during daytime is higher in summer than in winter, whereas nights are significantly more stable in winter than in summer (Zangvil et al. Citation1991). It is pertinent to note that the long-term observations carried out by Goossens and Offer (Citation1995) revealed that the atmosphere in ABL in Northern Negev is usually slightly stable to neutral during the day (especially in the summer season), but strongly stable during the night (Goossens and Offer Citation1995). The depth of the ABL that corresponds to the mixing depth is of the order of 500–600 m.
The suggested model is formulated for atmospheric conditions typical for the Northern Negev desert, which is associated with frequent regional dust storms. Thus, calculations were performed for two meteorological scenarios: (i) neutral ABL stratification and (ii) slightly stable ABL stratification. The expressions for the coefficient based on Monin–Obukhov similarity theory coupled with observational or computationally generated data (Seinfeld and Pandis Citation2016, Chapter 18) read:
(9)
(9)
where z is vertical coordinate, L is the Monin–Obukhov length. In the case of neutral atmospheric conditions, the gradient Richardson number,
(where T is absolute ambient air temperature and
is potential temperature),
. In the latter case, the function,
, and EquationEquation (9)
(9)
(9) yields the following expression for the eddy diffusivity
in EquationEquations (5)
(5)
(5) and Equation(6)
(6)
(6) :
(10)
(10)
For stable boundary layer (SBL) inside the ABL , and the function of the dimensionless length parameter,
, in EquationEquation (9)
(9)
(9) is given by the following formula (Businger et al. Citation1971):
(11)
(11)
Correlation of the atmospheric stability with Richardson number was investigated in numerous studies (Blackadar Citation1979; Sedefian and Bennett Citation1980; Zoumakis and Kelessis Citation1991; Mohan and Siddiqui Citation1998; Schnelle Citation2001). An alternative model of turbulent transport in stably stratified ABL that is based on turbulence energetics and does not employ the notion of the critical Richardson number was suggested by Zilitinkevich et al. (Citation2013). In the present study, we use the correlation for atmospheric stability with the Monin–Obukhov length using the Golder (Citation1972) correlation:
(12)
(12)
where the values of the coefficients
and
for different atmospheric stability scenarios are shown in .
Table 3. Correlation parameters in EquationEquation (11)(11)
(11) for estimation of Monin–Obukhov length.
3.2. Boundary conditions
The system of conservation EquationEquations (5)(5)
(5) and Equation(6)
(6)
(6) must be supplemented by boundary conditions at the ground level and at the boundary of the ABL formulated for airborne particles:
(13)
(13)
and for the active gas
(15)
(15)
where is the mass transfer coefficient,
is the dust flux density, h is the height of ABL. The value
in boundary condition (15) is the mass flux that quantifies the mass transfer between the gaseous phase and the soil. Gas adsorption whereby molecules from the gaseous phase are adsorbed by a solid surface is governed by molecular diffusion. In this case mass transfer coefficient is determined by the following formula:
(17)
(17)
where
is Sherwood number,
is the coefficient of molecular diffusion of active gas in a carrier gas and
is the characteristic length in the problem. On the other hand, the expression for the mass transfer coefficient in EquationEquation (15)
(15)
(15) can be written as follows:
(18)
(18)
In the case, when , the coefficient
can be estimated as (see Elperin et al. Citation2017)
(19)
(19)
where
is the mean radius of the soil particles,
is the solid fraction of soil particles. EquationEquations (17)
(17)
(17) to Equation(19)
(19)
(19) yield the following formula for the characteristic length scale for adsorption of trace atmospheric gases by soil
:
(20)
(20)
For the large values of m, the characteristic length is of the order of . The solid fraction,
, for soil can be estimated as
. In the case of sandy soils, the bulk density is of the order of
g/cm3, while
g/cm3. Thus, the magnitude of solid fraction is
and the characteristic length scale for adsorption of trace atmospheric gas by the desert soil is of the order of
.
Boundary conditions (12)–(15) must be supplemented by the initial vertical profile of the concentrations of active gas and dust particles:
(21)
(21)
In EquationEquation (22)(22)
(22) ,
is the vertical distribution of the initial concentration of active gas in ABL.
The developed model was applied to analysis of adsorption gas-phase HNO3 by mineral dust emitted from desert soils. The vertical profile of HNO3 in the atmosphere was measured by a variety of instruments since its first observation from the infrared solar absorption spectra in 1968 (Murcray et al. Citation1968). The overview of various instruments for measurement of the HNO3 distributions in the lower atmosphere including ground-based instruments, sounding instruments on board balloons, aircrafts, embarked on satellites or aboard the space shuttle can be found in Ronsmans et al. (Citation2016).
Concentrations of trace atmospheric gases including HNO3 were measured by Luke et al. (Citation2007) in the Tampa, Florida metropolitan area at the surface and throughout the planetary boundary layer PBL. The measurements showed that surface concentration of HNO3 was ≍1.18 ppb and slightly decreased with altitude. In general, it can be assumed that throughout the ABL the concentration HNO3 is uniformly distributed. The highest levels of HNO3 concentration (≍1.2 ppbv) were observed for air parcels ascending from the boundary layer and spending most of their time over Northwestern Europe. The mean level of the observed gaseous phase HNO3 concentration in air parcels ascending from the boundary layer in the Mediterranean region was 0.829 ppbv (Hanke et al. Citation2003). In the present model, we will assume the uniform initial distribution of active gas concentration. Thus, the initial concentration of gas-phase nitric acid does not depend on height. Consequently, the initial condition given by EquationEquation (22)(22)
(22) can be written as follows:
(23)
(23)
In EquationEquation (23)(23)
(23) ,
is the initial concentration of nitric acid in the ABL.
4. Results and discussion
The above-described model was applied to the calculations of adsorption of gas-phase HNO3 by dust PM. Calculations were performed for PM10 with the mean diameter 3.34 μm. In numerical simulations, we accounted for the particle size distribution using Monte-Carlo method (for details see Katra et al. Citation2016) and assumed that the wind velocity profile is determined by EquationEquation (1)(1)
(1) .
Gas adsorption by dust particles described by the system of advection-diffusion EquationEquations (5)(5)
(5) and Equation(6)
(6)
(6) and supplemented with the initial and boundary conditions (13)–(16), and (21), (22) was analyzed numerically using MATLAB numerical toolbox. Numerical calculations were performed for two meteorological scenarios corresponding to neutral and stable ABL stratification. It is worth noting that high wind velocities force the atmosphere towards the neutrality, due to the turbulent mixing, while stable and unstable atmospheric conditions are compatible with the low wind velocities, i.e., typically, with
m/s in the surface layer (Goossens and Offer Citation1995; Repetto and Solari Citation2007). Results of calculations of the concentration profiles and concentration distribution of the dust particles (PM10) near the ground for the length of the source 10 km and neutral atmospheric conditions (
) are shown in and .
Figure 2. Dust (PM10) concentration profiles at the different distances from the origin of the source area (neutral atmospheric conditions).
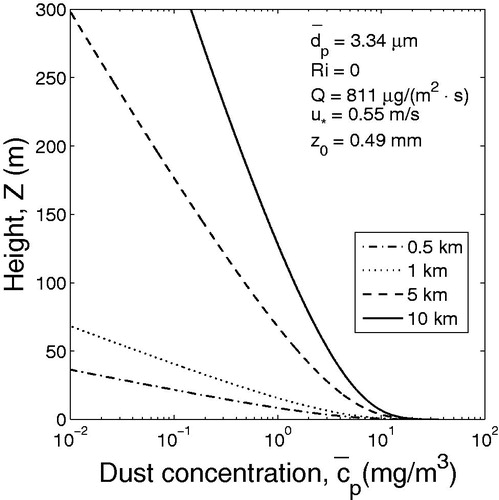
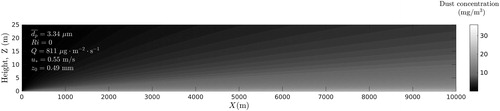
Figure 3. Distribution of dust particles concentration calculated in xz-plane at y = 0 (neutral atmospheric conditions).
Calculations were performed for the dust flux corresponding to silt-clay content 25% (). According to the wind profiles measured in the portable wind tunnel, the friction velocity and roughness parameter were assumed to be
and
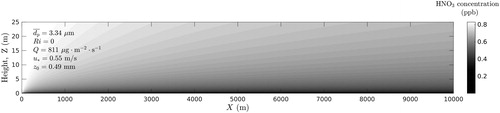
mm, correspondingly, for the case of neutral atmospheric stratification. In order to analyze the effect of gas adsorption of trace gases by windblown dust particles, the vertical concentration profiles of HNO3 were calculated and shown in . In this case, the length of the source area was assumed to be 10 km. Calculations were performed for dust distributions at different distances from the origin of the source area, namely 0.5, 1, 5 and 10 km. It was assumed that initially HNO3 was distributed uniformly in the ABL, and the initial concentration of the nitric acid was 0.829 ppb.
Figure 4. Vertical concentration profiles of HNO3 in atmosphere (neutral atmospheric conditions).
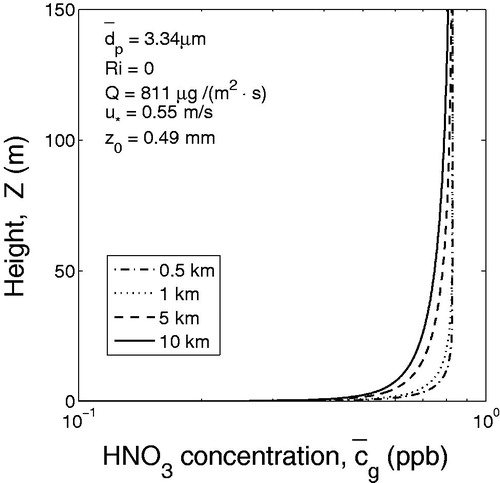
As can be seen from , the concentration of nitric acid HNO3 strongly depends on the concentration of dust particles. Concentration of HNO3 in the surface layer decreases with the length of the source, while the concentration of the windblown dust increases with the length of the source.
Figure 5. Distribution of HNO3 concentration calculated in xz-plane at y = 0 (neutral atmospheric conditions).
Results of calculations of concentration profiles and concentration distributions of dust particles (PM10) near the ground for a source length of 10 km and stable atmospheric conditions are showed in and . In this case according to the wind profiles measured in the portable wind tunnel, the friction velocity and roughness parameter were assumed to be
and
mm, respectively.
Figure 6. Dust (PM10) concentration profiles at the different distances from the origin of the source area (slightly stable atmospheric conditions).
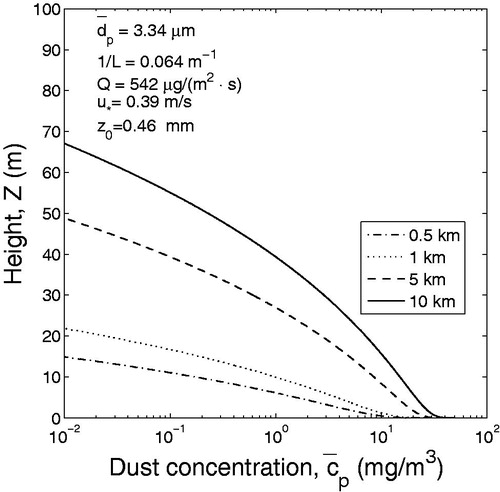
Figure 7. Distribution of dust particles concentration calculated in xz-plane at y = 0 (slightly stable atmospheric conditions).
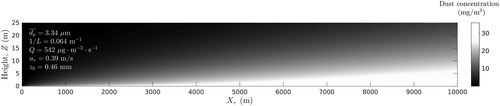
Comparison of and shows that during dust event the slightly stable atmosphere is characterized by higher concentration of PM10 in the surface layer than neutral atmosphere. For example, estimates show that at a height of 10 m above the ground and at a distance of 5 km from the area source, the concentrations of dust particles are approximately 7 and 10 mg/m3 in a neutral and slightly stable atmosphere, respectively ( and ). The obtained results are generally consistent with 24-th month observations conducted by Goossens and Offer (Citation1995) in Northern Negev in Israel. Atmospheric observations showed that when atmosphere was stable, the speed of wind was relatively low, the depth of mixing layer was small and dust concentration was high (see Choularton, Fullarton, and Gay Citation1982; Park Smith, and Exton Citation1990; Goossens and Offer Citation1995).
In the case of stable atmospheric stratification (m−1) the effect of gas adsorption of trace gases by windblown dust particles is illustrated by calculated vertical concentration profiles of HNO3 ( and ).
Figure 8. Vertical concentration profiles of HNO3 in atmosphere (moderately stable atmospheric conditions).
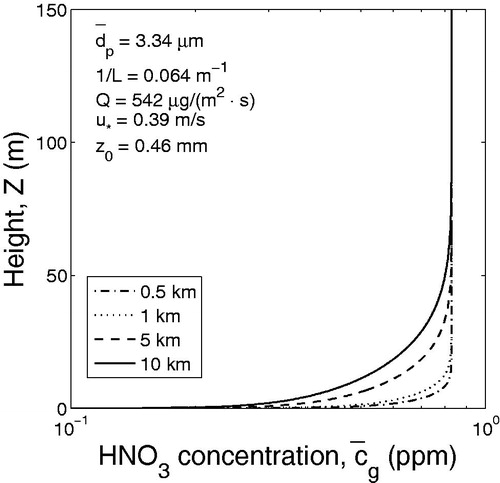
Figure 9. Distribution of HNO3 concentration calculated in xz-plane at y = 0 (stable atmospheric conditions).
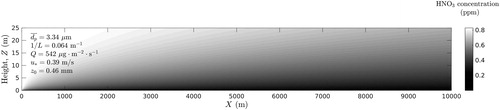
Inspection of shows that in the case of neutral stratification the concentration of nitric acid HNO3 strongly depends on the concentration of dust particles. As in the case of neutral stratification in ABL, in the stable atmosphere the higher is the particle concentration the lower is the concentration of HNO3.
5. Conclusions
We develop a 2D model of adsorption of trace atmospheric gases by dust PM emitted from desert soils. The model is based on the application of theory of turbulent diffusion in the ABL in conjunction with the model of gas adsorption by porous solid particles. The boundary conditions on the ground surface are formulated taking into account the gas adsorption by desert soil. Herewith, we estimated the characteristic length scale for the adsorption of trace atmospheric gas on the surface of the desert soil. The wind speed profile was measured during eolian experiments in the portable wind tunnel operated at the experimental plots at two fan frequencies corresponding to neutral (44 Hz) and slightly stable (32 Hz) stratifications of ABL. The measured dependence of mean wind velocity versus height was approximated by EquationEquation (1)(1)
(1) using the least square method.
We determined numerically concentration distributions of the PM and trace gas based on the values of shear velocity and emitted dust flux from the soil measured in experiments. Analysis was performed for the case of neutral and slightly stable stratification of ABL. The numerical analysis showed that during dust events the slightly stable atmosphere is characterized by higher concentration of PM10 than neutral atmosphere. It is found that in the case of neutral stratification as well as for stable atmospheric stratification the concentration of nitric acid HNO3 strongly depends on concentration of dust particles. As in the case of neutral stratification in ABL, in the stable atmosphere the higher is the particle concentration the lower is the concentration of HNO3. The performed analysis and numerical results are in compliance with atmospheric observations showing that in the stably stratified atmosphere the speed of wind is relatively low, the depth of mixing layer is small and dust concentration is high (Choularton, Fullarton, and Gay Citation1982; Park, Smith, and Exton Citation1990; Goossens and Offer Citation1995).
The obtained results demonstrate a potential to reduce the uncertainties in atmospheric PM transport and trace gases distribution and provide a more realistic picture. The results of the present study can be useful in an analysis of different meteorology–chemistry models including adsorption of trace atmospheric gases by dust aerosol particles emitted from arid source areas. The model enhances our capacity of quantification of atmospheric dust effects in climate models as well as health risk assessment.
| Nomenclature | ||
| = | mean radius of the soil particles | |
| = | Cunningham slip correction factor | |
| = | concentration of species i in the atmosphere | |
| = | fluctuating component of i-th concentration species | |
| = | specific heat capacity of air at constant pressure | |
| = | coefficient of molecular diffusion | |
| = | diameter | |
| = | gravitational constant | |
| h | = | height of atmospheric boundary layer |
| k | = | von Karman constant |
| = | Henry’s law constant of adsorption | |
| = | gaseous-phase controlled mass transfer coefficient | |
| = | diagonal components of eddy diffusivity tensor | |
| L | = | Monin–Obukhov length |
| = | dimensionless Henry’s constant of adsorption | |
| = | dust flux density | |
| = | vertical heat flux | |
| r | = | radius |
| Ri | = | gradient Richardson number |
| = | rate of addition or loss of species i | |
| = | specific surface area of a particle | |
| = | Sherwood number | |
| T | = | temperature |
| t | = | time |
| = | mean wind velocity | |
| = | fluctuating component of the wind velocity | |
| = | friction velocity | |
| = | terminal settling velocity | |
| x | = | downwind coordinate |
| Z | = | vertical coordinate |
| = | aerodynamic surface roughness | |
| Greek symbols | ||
| = | coefficient in EquationEquation (12) | |
| = | coefficient in EquationEquation (12) | |
| = | characteristic length | |
| = | dimensionless height | |
| = | adsorption rate coefficient | |
| = | potential temperature | |
| = | dynamic viscosity | |
| = | density | |
| = | standard deviation of velocity fluctuations | |
| = | shear stress | |
| = | characteristic diffusion time | |
| = | solid fraction | |
| = | universal function of the dimensionless height | |
| Subscripts | ||
| p | = | particle |
| g | = | gas phase |
| s | = | value at the surface |
Disclosure statement
No potential conflict of interest was reported by the authors.
Additional information
Funding
Related Research Data
References
- Adams, J. W., D. Rodriguez, and R. A. Cox. 2005. The uptake of SO2 on Saharan dust: a flow tube study. Atmos. Chem. Phys. 5 (10):2679–2689. doi: 10.5194/acp-5-2679-2005.
- Anderson, R. S. 1987. Eolian sediment transport as a stochastic process: the effects of a fluctuating wind on particle trajectories. J. Geol. 95 (4):497–512. doi: 10.1086/629145.
- Bagnold, R. A. 1941. The physics of blown sand and desert dunes. New York: Methuen.
- Bidabehere, C. M., J. R. Garcia, and U. Sedran. 2017. Transient effectiveness factor in porous catalyst particles. Application to kinetic studies with batch reactors. Chem. Eng. Res. Des. 118:41–50. doi: 10.1016/j.cherd.2016.11.029.
- Blackadar, A. K. 1979. Modeling pollutant transfer during daytime convection. Paper presented at the Fourth Symposium on Atmospheric Turbulence Diffusion and Air Quality, AMS, Reno, NV,443–447.
- Boucher, O. 2015. Atmospheric aerosols. Properties and climate impacts. Dordrecht: Springer.
- Brunauer, S. 1943. The adsorption of gases and vapors. Vol. 1. Physical adsorption. London: Oxford University Press.
- Businger, J. A., J. C. Wyngaard, Y. Izumi, and E. F. Bradley. 1971. Flux-Profile relationships in the atmospheric surface layer. J. Atmos. Sci. 28 (2):181–189. doi: 10.1175/1520-0469(1971)028<0181:FPRITA>2.0.CO;2.
- Calvert, J. G., J. J. Orlando, W. R. Stockwell, and T. J. Wallington. 2015. The mechanisms of reactions influencing atmospheric ozone. New York: Oxford University Press.
- Chamberlain, A. C., A. E. J. Eggleton, W. J. Megaw, and J. B. Morris. 1960. Behavior of iodine vapour in air. Discuss. Faraday Soc. 30:162–169. doi: 10.1039/df9603000162.
- Chen, H., A. Laskin, J. Baltrusaitis, C. A. Gorski, M. M. Scherer, and V. H. Grassian. 2012. Coal fly ash as a source of iron in atmospheric dust. Environ. Sci. Technol. 46 (4):2112–2120. doi: 10.1021/es204102f.
- Chen, Q., and K. Hu. 2014. Prediction model for SVOCs transport in the air and interactions with airborne particles. Atmos. Environ. 96:61–69. doi: 10.1016/j.atmosenv.2014.07.026.
- Chen, S., J. Huang, J. Li, R. Jia, N. Jiang, L. Kang, X. Ma, and T. Xie. 2017. Comparison of dust emission, transport, and deposition between the Taklimakan desert and Gobi desert from 2007 to 2011, 2017. Sci. China Earth Sciences 60 (7):1338–11355. doi: 10.1007/s11430-016-9051-0.
- Choularton, T. W., G. Fullarton, and M. J. Gay. 1982. Some observations of the influence of meteorological variables on the size distribution of natural aerosol particles. Atmos. Environ. 16 (2):315–323. doi: 10.1016/0004-6981(82)90448-6.
- de Reus, M., H. Fischer, R. Sander, V. Gros, R. Kormann, G. Salisbury, R. Van Dingenen, J. Williams, M. Zöllner, and J. Lelieveld. 2005. Observations and model calculations of trace gas scavenging in a dense Saharan dust plume during MINATROC. Atmos. Chem. Phys. 5 (7):1787–1803. doi: 10.5194/acp-5-1787-2005.
- Dentener, F. J., and P. J. Crutzen. 1993. Reactions of N2O5 on tropospheric aerosols: impact on the global distributions of NOx, O3, and OH. J. Geophys. Res. 98 (D4):7149–7163. doi: 10.1029/92JD02979.
- Dentener, F. J., G. R. Carmichael, Y. Zhang, J. Lelieveld, and P. J. Crutzen. 1996. Role of mineral aerosol as a reactive surface in the global troposphere. J. Geophys. Res. Atmos. 101 (D17):22869–22889. doi: 10.1029/96JD01818.
- Elperin, T., A. Fominykh, I. Katra, and B. Krasovitov. 2017. Modeling of gas adsorption by aerosol plumes emitted from industrial sources. Process Saf. Environ. Prot. 111:375–387. doi: 10.1016/j.psep.2017.06.022.
- Evan, A. T., J. P. Kossin, C. E. Chung, and V. Ramanathan. 2011. Strengthening of Arabian Sea tropical cyclones and the South Asian atmospheric brown cloud. Nature 479 (7371):94–97. doi: 10.1038/nature10552.
- Glueckauf, E. 1955. Theory of chromatography. Part X. Formulae for diffusion into spheres and their application to chromatography. Trans. Faraday Soc. 51 (0):1540–1551. doi: 10.1039/TF9555101540.
- Golder, D. 1972. Relations among stability parameters in the surface layer. Boundary-Layer Meteorol. 3 (1):47–58. doi: 10.1007/BF00769106.
- Goodman, A. L., E. T. Bernard, and V. H. Grassian. 2001. Spectroscopic study of nitric acid and water adsorption on oxide particles: enhanced nitric acid uptake kinetics in the presence of adsorbed water. J. Phys. Chem. A 105 (26):6443–6457. doi: 10.1021/jp003722l.
- Goossens, D., and Z. Y. Offer. 1995. Comparisons of day-time and night-time dust accumulation in a desert region. J. Arid Environ. 31 (3):253–281. doi: 10.1016/S0140-1963(05)80032-1.
- Goroch, A., S. Burk, and K. L. Davidson. 1980. Stability effects on aerosol size and height distributions. Tellus 32 (3):245–250. doi: 10.1111/j.2153-3490.1980.tb00951.x.
- Hanke, M., B. Umann, J. Uecker, F. Arnold, and H. Bunz. 2003. Atmospheric measurements of gasphase HNO3 and SO2 using chemical ionization mass spectrometry during the MINATROC field campaign 2000 on monte cimone. Atmos. Chem. Phys. 3 (2):417–436. doi: 10.5194/acp-3-417-2003.
- Hu, K., Q. Chen, and J. H. Hao. 2013. Influence of suspended particles on indoor semi-volatile organic compounds emission. Atmos. Environ. 79:695–704. doi: 10.1016/j.atmosenv.2013.07.010.
- Huang, J., T. Wang, W. Wang, Z. Li, and H. Yan. 2014. Climate effects of dust aerosols over East Asian arid and semiarid regions. J. Geophys. Res. Atmos. 119:11398–11416. doi:10.1002/2014JD021796.
- IARC. 2013. Air pollution and cancer. Scientific publication no. 161, Straif, K., A., Cohen, and J., Samet, eds. International Agency for Research on Cancer (IARC) Publication No. 161.
- Jeong, G. Y., M. Y. Park, K. Kandler, T. Nousiainen, and O. Kemppinen. 2016. Mineralogical properties and internal structures of individual fine particles of Saharan dust. Atmos. Chem. Phys. 16 (19):12397–12410. doi: 10.5194/acp-16-12397-2016.
- Karydis, V. A., A. P. Tsimpidi, A. Pozzer, M. Astitha, and J. Lelieveld. 2016. Effects of mineral dust on global atmospheric nitrate concentrations. Atmos. Chem. Phys. 16 (3):1491–1509. doi: 10.5194/acp-16-1491-2016.
- Katra, I., T. Elperin, A. Fominykh, B. Krasovitov, and H. Yizhaq. 2016. Modeling of particulate matter transport in atmospheric boundary layer following dust emission from source areas. Aeolian Res 20 :147–156. doi: 10.1016/j.aeolia.2015.12.004.
- Kok, J. F., E. J. R. Parteli, T. I. Michaels, and D. Bou Karam. 2012. The physics of windblown sand and dust. Rep. Prog. Phys, 75 (10):106901. doi: 10.1088/0034-4885/75/10/106901.
- Liu, C., S. Shi, C. Weschler, B. Zhao, and Y. Zhang. 2013. Analysis of the dynamic interaction between SVOCs and airborne particles. Aerosol Sci. Technol. 47 (2):125–136. doi: 10.1080/02786826.2012.730163.
- Luke, W. T., J. R. Arnold, T. B. Watson, P. K. Dasgupta, J. Li, K. Kronmiller, B. E. Hartsell, T. Tamanini, C. Lopez, and C. King. 2007. The NOAA twin otter and its role in BRACE: a comparison of aircraft and surface trace gas measurements. Atmos. Environ. 41 (20):4190–4209. doi: 10.1016/j.atmosenv.2006.07.060.
- Metzger, S., B. Steil, M. Abdelkader, K. Klingmüller, L. Xu, J. E. Penner, C. Fountoukis, A. Nenes, and J. Lelieveld. 2016. Aerosol water parameterization: a single parameter framework. Atmos. Chem. Phys. 16 (11):7213–7237. doi: 10.5194/acp-16-7213-2016.
- Mohan, M., and T. A. Siddiqui. 1998. Analysis of various schemes for the estimation of atmospheric stability classification. Atmos. Environ. 32 (21):3775–3781. doi: 10.1016/S1352-2310(98)00109-5.
- Monin, A. S., and A. M. Obukhov. 1954. Basic laws of turbulent mixing in the ground level of the atmosphere. Akad. Nauk SSSR Geofis. Inst. Tr. 151:163–187.
- Murcray, D. G., T. G. Kyle, F. H. Murcray, and W. J. Williams. 1968. Nitric acid and nitric oxide in the lower stratosphere. Nature 218 (5136):78–79. doi: 10.1038/218078a0.
- Noguchi, H., M. Murata, and K. Suzuki. 1990. Adsorption of radioactive iodine gas onto atmospheric aerosol. Jpn. J. Health Phys. 25 (3):209–219. doi: 10.5453/jhps.25.209.
- Park, P. M., M. H. Smith, and H. J. Exton. 1990. The effect of mixing height on Maritime aerosol concentrations over the North Atlantic Ocean. Q. J. R. Meteorol. Soc. 116 (492):461–476. doi: 10.1002/qj.49711649211.
- Pnueli, D., C. Gutfinger, and M. Fichman. 1991. A Turbulent-Brownian model for aerosol coagulation. Aerosol Sci. Technol. 14 (2):201–209. doi: 10.1080/02786829108959483.
- Poling, B. E., J. M. Prausnitz, and J. P. O’Connell. 2001. The properties of gases and liquids. 5th ed. Bangkok: McGraw-Hill.
- Repetto, M. P., and G. Solari. 2007. Wind-induced fatigue of structures under neutral and non-neutral atmospheric conditions. J. Wind Eng. Ind. Aerod. 95 (9–11):1364–1383. doi: 10.1016/j.jweia.2007.02.012.
- Romanias, M. N., H. Ourrad, F. Thevenet, and V. Riffault. 2016. Investigating the heterogeneous interaction of VOCs with natural atmospheric particles: adsorption of limonene and toluene on saharan mineral dusts. J. Phys. Chem. A 120:1197–1212. doi: 10.1021/acs.jpca.5b10323.
- Ronsmans, G., B. Langerock, C. Wespes, J. W. Hannigan, F. Hase, T. Kerzenmacher, E. Mahieu, M. Schneider, D. Smale, D. Hurtmans, M. Mazière, C. Clerbaux, and P.-F. Coheur. 2016. First characterization and validation of FORLI-HNO3 vertical profiles retrieved from Iasi/MetOp. Atmos. Meas. Tech. 9 (9):4783–4801. doi: 10.5194/amt-9-4783-2016.
- Ruiz, J., R. Bilbao, and M. B. Murillo. 1998. Adsorption of different VOC onto soil minerals from gas phase: influence of mineral, type of VOC, and air humidity. Environ. Sci. Technol. 32 (8):1079–1084. doi: 10.1021/es9704996.
- Schnelle, K. B. 2001. In Atmospheric diffusion modeling. Encyclopedia of physical science & Technology. Atmospheric science, ed. Meyers, R. A., 3rd ed. San Diego: Academic Press.
- Sedefian, L., and E. Bennett. 1980. A comparison of turbulence classification schemes. Atmos. Environ. 14 (7):741–750. doi: 10.1016/0004-6981(80)90128-6.
- Seinfeld, J. H., and S. N. Pandis. 2016. Atmospheric chemistry and physics: from air pollution to climate change. 3rd ed. Hoboken, New Jersey: John Wiley & Sons.
- Seisel, S., A. Pashkova, Y. Lian, and R. Zellner. 2005. Water uptake on mineral dust and soot: a fundamental view of the hydrophilicity of atmospheric particles? Faraday Discuss 130:437–451. doi: 10.1039/b417449f.
- Shao, Y. 2008. Physics and modelling of wind erosion. Dordrecht: Kluwer Academic Publishers.
- Soler, R., J. F. Nicolas, S. Caballero, E. Yubero, and J. Crespo. 2016. Depletion of tropospheric ozone associated with mineral dust outbreaks. Environ. Sci. Pollut. Res. 23 (19):19376–19386. doi: 10.1007/s11356-016-7134-y.
- Umann, B., F. Arnold, C. Schaal, M. Hanke, J. Uecker, H. Aufmhoff, Y. Balkanski, and R. van Dingenen. 2005. Interaction of mineral dust with gas phase nitric acid and sulfur dioxide during the MINATROC II field campaign: first estimate of the uptake coefficient γHNO3 from atmospheric data. J. Geophys. Res. 110:D22306.
- Vlasenko, A., T. Huthwelker, H. W. Gäggeler, and M. Ammann. 2009. Kinetics of the heterogeneous reaction of nitric acid with mineral dust particles: an aerosol flowtube study. Phys. Chem. Chem. Phys. 11 (36):7921–7930. doi: 10.1039/b904290n.
- Woodill, L. A., E. M. O’Neill, and R. Z. Hinrichs. 2013. Impacts of surface adsorbed catechol on tropospheric aerosol surrogates: heterogeneous ozonolysis and its effects on water. Uptake J. Phys. Chem. A 117 (27):5620–5631. doi: 10.1021/jp400748r.
- Zangvil, A., Z. Offer, Y. Apterman, O. Miron, A. Sasson, and D. Klepach. 1991. Meteorological analysis of the Shivta region in the Negev. Desert Meteorology Papers, Series B No. (1),210. The Jacob Blaustein Institute for Desert Research.
- Zhan, Y., M. Ginder-Vogel, M. M. Shafer, Y. Rudich, M. Pardo, I. Katra, D. Katoshevski, and J. J. Schauer. 2018. Changes in oxidative potential of soil and fly ash after reaction with gaseous nitric acid. Atmosph. Environ. 173:306–315. doi: 10.1016/j.atmosenv.2017.11.008.
- Zilitinkevich, S. S., T. Elperin, N. Kleeorin, I. Rogachevskii, and I. Esau. 2013. A hierarchy of energy-and flux-budget (EFB) turbulence closure models for stably stratified geophysical flows. Boundary-Layer Meteorol. 146 (3):341–373. doi: 10.1007/s10546-012-9768-8.
- Zoumakis, N. M., and A. G. Kelessis. 1991. The dependence of the bulk Richardson number on stability in the surface layer. Boundary-Layer Meteorol. 57 (4):407–414. doi: 10.1007/BF00120057.