
 ?Mathematical formulae have been encoded as MathML and are displayed in this HTML version using MathJax in order to improve their display. Uncheck the box to turn MathJax off. This feature requires Javascript. Click on a formula to zoom.
Abstract
Refractive index and optical properties of biogenic and anthropogenic secondary organic aerosol (SOA) particles were investigated. Aerosol precursors, namely longifolene, α-pinene, 1-methylnaphthalene, phenol, and toluene were oxidized in a Teflon chamber to produce SOA particles under different initial hydrocarbon concentrations and hydroxyl radical sources, reflecting exposures to different levels of nitrogen oxides (NOx). The real and imaginary components (n and k, respectively) of the refractive index at 375 nm and 632 nm were determined by Mie theory calculations through an iterative process, using the χ2 function to evaluate the fitness of the predicted optical parameters with the measured scattering, absorption, and extinction coefficients from a Photoacoustic Extinctiometer and Cavity Attenuated Phase Shift Spectrometer. Single scattering albedo (SSA) and bulk mass absorption coefficient (MAC) at 375 nm were calculated. SSA values of SOA particles from biogenic precursors (longifolene and α-pinene) were ∼0.98–0.99 (∼6.3% uncertainty), reflecting purely scattering aerosols regardless of the NOx regime. However, SOA particles from aromatic precursors were more absorbing and displayed NOx-dependent SSA values. For 1-methylnaphthalene SOA particles, SSA values of 0.92–0.95 and ∼0.75–0.90 (∼6.1% uncertainty) were observed under intermediate- and high-NOx conditions, respectively, reflecting the absorbing effects of SOA particles and NOx chemistry for this aromatic system. In mixtures of longifolene and phenol or longifolene and toluene SOA under intermediate- and high-NOx conditions, k values of the aromatic-related component of the SOA mixture were higher than that of 1-methylnaphthalene SOA particles. With the increase in OH exposure, kphenol decreased from 0.10 to 0.02 and 0.22 to 0.05 for intermediate- and high-NOx conditions, respectively. A simple relative radiative forcing calculation for urban environments at λ = 375 nm suggests the influence of absorbing SOA particles on relative radiative forcing at this wavelength is most significant for aerosol sizes greater than 0.4 µm.
Copyright © 2019 American Association for Aerosol Research
EDITOR:
Introduction
The Intergovernmental Panel on Climate Change (IPCC) (Myhre et al. 2013) reported that the most significant sources of uncertainty in the total estimated anthropogenic radiative forcing are due to aerosol direct and indirect interactions with solar radiation. In the most recent IPCC report (Myhre et al. 2013), the average global climate forcing for direct and indirect aerosol effects were estimated to be −0.35 Wm−2 (−0.85 to +0.15 Wm−2) and −0.45 (−1.2 to 0.0) Wm−2, respectively. Sub-micron aerosols, those that are longest lived and most important for radiative forcing, are mainly comprised of organic aerosols (OA). It is estimated that 70–90% of OA is secondary organic aerosols (SOA) (Hallquist et al. Citation2009). SOA particles are produced from chemical reactions of volatile and semi-volatile organic species in the atmosphere, leading to compounds with a lower vapor pressure that partition to the particle phase (Hallquist et al. Citation2009; Volkamer et al. Citation2006). Prevalence of oxygenated organic aerosol, representing SOA particles, has been observed in urban centers, downwind of urban sites, and at remote locations (Zhang et al. Citation2007). Typically, OA efficiently scatters light in the visible range and has negative direct radiative forcing values.
In recent studies, brown carbon (BrC) which is emitted directly from biomass burning or formed as SOA particles, has been recognized to play a role in climate forcing in addition to black carbon (BC). BC, which is also emitted through combustion processes and biomass burning, is made of graphene layers, and can absorb radiation in a broad range, from the ultraviolet region to the infrared region (Bond et al. Citation2013; Venkataraman et al. Citation2005). BrC absorbs radiation more strongly in the near ultraviolet to ultraviolet region, contributing to strongly wavelength dependent direct radiative forcing effects and is decribed as “colored” organic compounds consisting of polycyclic aromatic hydrocarbon (PAH) structures, with double bonds and rings, and humic-like substances branched with nitrated and oxidized functional groups (Laskin et al. Citation2015; Andreae and Gelencsér Citation2006; Ramanathan et al. Citation2007; Feng et al. Citation2013). Small PAHs and their derivatives, emitted from automobile and biomass burning, are typically found in the gas phase; however their photooxidation products can lead to SOA particles and BrC formation (Di Filippo et al. Citation2010; Wang et al. Citation2007; Samburova et al. Citation2016; Chan et al. Citation2009; Hersey et al. Citation2011; Claeys et al. Citation2012; Iinuma et al. Citation2010). For example, nitro-aromatics identified in the water soluble organic carbon samples in the Los Angeles basin have been shown to contribute to ∼4% of water soluble BrC absorption at near ultraviolet to ultraviolet region (Zhang et al. Citation2013). In recent studies, light absorption of primary BrC aerosol emitted from biomass burning fuels such as Alaskan and Siberian peat have also shown efficient absorption in wavelengths between 300 and 400 nm (Chakrabarty et al. Citation2016).
Scattering and absorption of light by aerosols is controlled by the real (n) and imaginary (k) components of RI, which are a function of aerosol composition and wavelength of radiation (Bohren and Huffman Citation1998). Therefore, RI values depend on OA chemical precursors, oxidation scheme, temperature, and relative humidity (Kim and Paulson Citation2013; Lambe et al. Citation2013; Kim et al. Citation2012, Citation2010; Saleh et al. Citation2013). Several methods can measure aerosol scattering and absorption in the ambient environment and laboratory, from which complex RI are determined. For laboratory-generated SOA particles, Nakayama et al. (Citation2012) derived values of n ∼1.4–1.5 and negligible k at λ = 405, 532, and 781 nm from the photooxidation of α-pinene using a cavity ring-down spectrometer (CRDS) and photoacoustic soot spectrometer (PAS). In another study, reducing the hydrocarbon to NOx ratio (HC/NOx) from 33 to 8.1 increased n from 1.36 to 1.52 at λ = 532 nm (Kim et al. Citation2012). Nakayama et al. (Citation2013) performed similar toluene photooxidation experiments to determine the complex RI of SOA particles under different NOx conditions using CRDS and PAS. It was observed that reducing HC/NOx ratio from 36 to 7, increased n and k from 1.449 to 1.567 and 0.0018 to 0.0072 at 405 nm, respectively, indicating the importance of NOx to the absorbing components of aromatic SOA particles (Nakayama et al. Citation2013). In contrast, under NOx-free conditions, He et al. (Citation2018) performed aging experiments in an oxidation flow reactor using Broadband Cavity Enhanced Spectroscopy (BBCESVis) and determined β-pinene and p-xylene SOA particles to have a decreasing trend in n with increasing oxidation level for wavelengths of 400–650 nm. Literature values of n and k for chamber-derived SOA particles from a variety of hydrocarbons range from 1.3 to 1.6 and 0.000 to 0.2, respectively, for λ = 350–800 nm (Moise et al. Citation2015). In these studies, complex RI values were determined only for a subset of hydrocarbons and oxidation conditions, and mostly in the visible wavelengths. Given the increasing absorption efficiency of BrC at lower wavelengths, it is valuable to expand the measurements of RI of SOA particles to lower wavelengths and to other hydrocarbons and ranges of oxidation conditions.
In this study, we characterized the RI of SOA particles formed from oxidation of different biogenic and anthropogenic hydrocarbons in a Teflon chamber under variable NOx conditions. Specifically, we explored oxidation of longifolene, α-pinene, 1-methylnaphthalene, phenol, and toluene precursors as representative biogenic and anthropogenic precursors that are commonly found in the ambient environment, and have significantly different structures, but yet have reasonably high SOA particle formation yields (Wang et al. Citation2007; Chan et al. Citation2009). Although refractive index of α-pinene-derived SOA particles has been investigated before, the current chamber oxidation conditions are different than in previous studies, hence extending the range of SOA optical parameters to a wider range of atmospheric-relevant conditions. Furthermore, in the current study, mixtures of aromatic (phenol or toluene) with biogenic (longifolene) SOA particles are studied, allowing us to assess optical properties of such SOA mixtures in contrast to that of pure systems. Oxidation under different HC/NOx ratios was achieved by exposures to different hydroxyl radical sources. Assuming particle sphericity, we determined the complex RI values using Mie theory calculations and iterative minimization of the least-squares deviation function (χ2) using a range of n and k values. Aerosol scattering and absorption coefficients at 375 nm were measured using a Photoacoustic Extinctiometer while a Cavity Attenuated Phase Shift Spectrometer was used to determine extinction coefficient at 632 nm. Additionally, we determined the SSA and bulk mass absorption coefficient (MAC) of SOA particles at λ = 375 nm from 1-methylnaphthalene and phenol with absorbing characteristics. We aim to improve future model predictions of the direct climate effects of anthropogenic and biogenic SOA particles by constraining their optical properties at λ = 375 nm and 632 nm.
Chamber setup and instrumentation
All experiments were conducted in a 2 m3 PFA Teflon chamber bag, enclosed by a metallic frame, irradiated by 16 Sylvannia black lights under relative humidity ranging from 20 to 30% (Vaisala, HMP60 Series relative humidity and temperature probe) at temperatures between 22 and 25 °C. The experiments used either the photolysis of hydrogen peroxide (H2O2) or nitrous acid (HONO) as the hydroxyl radical (OH) source for intermediate- and high-NOx conditions, respectively. Although we did not add additional NOx to the experiments with H2O2, these experiments are classified as intermediate-NOx because of the impurities introduced in the chamber through our compressed zero-air cylinders, resulting in initial NOx mixing ratios of ∼2–15 ppbv. Average OH concentrations of the H2O2 (intermediate-NOx) and HONO (high-NOx) experiments were measured as 6.3 × 10⁶ molecules cm−3 and 3.6 × 10⁷ molecules cm−3, respectively. In experiments with HONO as the OH source, additional NO (PRAXAIR, 484 ppm) was also injected to achieve initial NO mixing ratios of ∼500 ppbv in the chamber. In an effort to further explore the influence of NOx concentrations on 1-methylnaphthalene SOA particle optical characteristics, ∼500 ppbv NO was injected in Experiments I and II after the peak in SOA particle mass concentration was reached. summarizes details of the experimental conditions used in this analysis.
Table 1. Initial conditions for oxidation experiments.
Irradiation was initiated once the hydrocarbon gas phase concentrations were stable. SOA particles from longifolene, α-pinene, and 1-methylnaphthalene systems were generated by nucleation; however, oxidation of phenol and toluene did not result in significant aerosol formation. To facilitate gas to particle partitioning of vapors in these systems, ∼40–50 ppbv of longifolene was first injected and oxidized to provide organic aerosols as seed particles, with typical particle number concentration of ∼103 particles cm−3 and mode of ∼10–15 nm at the time of phenol or toluene injection.
Gas phase concentrations of the hydrocarbon were measured with Gas Chromatography coupled with a Flame Ionizing Detector (GC-FID) using a Hewlett Packard 5890 Series II instrument. A UV photometric ozone analyzer (Thermo, Model 49i) and Thermo chemiluminescence NO-NO2-NOx analyzer (Thermo, Model 42i) were used to measure gas phase ozone and NOx concentrations at 1-Hz. Various aerosol instrumentation sampled air from the chamber through a 30 cm long diffusion sampler, filled with silica-gel (Sigma-Aldrich-Saint Louis, MO, USA) and Purafil (Thermo Scientific) to dry the samples and remove NOx. A Photoacoustic Extinctiometer (PAX, Droplet Measurement Technology) measured the scattering coefficient (βscat) by a reciprocal nephelometer and absorption coefficient (βabs) by photoacoustic measurements at 375 nm (Nakayama et al. Citation2015). Details of the calibration procedures for PAX are presented in supplementary information (SI). Measurements were performed at 1-Hz, with 140 s scattering and absorption detection limits of 1.29 and 1.08 Mm−1, respectively. The detection limits were defined as 3 × standard deviation (3σ) of the measurements when sampling filtered air. Considering the estimated uncertainties from the calibration factor (± 2%) and truncation angle of the PAX instrument (± 4%), we estimated the total scattering and absorption measurement uncertainties to be ∼ ± 4.5% and ± 6%, respectively (Nakayama et al. Citation2015).
A Cavity Attenuated Phase Shift Spectrometer (CAPS-PMex, Aerodyne) (Petzold et al. Citation2013; Massoli et al. Citation2010) measured extinction coefficient (βext) at 632 nm, at 1-Hz with a 140 s (3σ) detection limit of 0.25 Mm−1 and an overall uncertainty of 10% (Massoli et al. Citation2010). Total mass and composition of the SOA particles were measured using a mini aerosol mass spectrometer (mAMS) coupled with a compact time-of-flight mass spectrometer (Dingle et al. Citation2016; Vu et al. Citation2016). A Scanning Electrical Mobility Spectrometer (SEMS, Brechtel Manufacturing Inc.) was utilized to measure aerosol number size distributions (Lopez-Yglesias et al. Citation2014; Wonaschutz et al. Citation2013; Jaramillo et al. Citation2013). Sizing accuracy of the SEMS was determined to be ∼ ± 3% by sampling polystyrene latex sphere standards at a known size while counting accuracy of the SEMS is expected to be better than ∼ ± 10%. During the experiments, SEMS voltage was scanned in 140 s intervals to provide size distributions in the range of 10–800 nm. More details on the experimental setup and instrumentation are provided in the SI.
Refractive index calculations
βscat and βabs obtained from PAX at 375 nm and βext from CAPS-PMex at 632 nm were used to determine the optimized complex values of RI of SOA particles, that is, m = n − ik. Assuming aerosol sphericity, βscat,calc and βabs,calc at 375 nm were calculated with initial guesses for n and k, following EquationEquations (1)(1)
(1) and Equation(2)
(2)
(2) (Bohren and Huffman Citation1998):
(1)
(1)
(2)
(2)
where Qscat,i and Qabs,i are the scattering and absorption efficiencies at a diameter Dp as determined by Mie theory (Seinfeld and Pandis Citation2006; Kokhanovsky Citation2008; Friedlander Citation2000), Ni is the number concentration at a specific size bin in particles cm−3, and Dp,i is the diameter corresponding to that size bin (Bohren and Huffman Citation1998). We assume that aerosol absorption is negligible at 632 nm (Lack et al. Citation2012; Lambe et al. Citation2013) and only calculate the scattering coefficient at this value. Calculated values of optical coefficients were compared with the measured values, and iterations with different values of n and k were carried out to minimize the least-squares deviation function χ2, as defined in EquationEquations (3)
(3)
(3) and Equation(4)
(4)
(4) at 375 nm and 632 nm, respectively:
(3)
(3)
(4)
(4)
where βscat,meas, βabs,meas and βext,meas are the averaged 1-Hz optical coefficients during the 140 s sampling time of SEMS, εmeas is the standard deviation of the corresponding averaged optical data, and βscat,calc and βabs,calc are the calculated optical coefficients (Spindler et al. Citation2007; Riziq et al. Citation2007; Lambe et al. Citation2013) (Figure S1). In this iteration process, values of n in the range of 1.3–1.8 were changed at 0.01 increments while k values in the range of 0–0.05 were incremented by 0.001 to capture the most relevant RI values of organic aerosols found in the atmosphere (Nakayama et al. Citation2010; Nakayama et al. Citation2013, Citation2012; Moise et al. Citation2015).
We examined the uncertainties for n and k based on the uncertainty of the measured diameter, number concentrations from SEMS, βscat and βabs measurements from PAX, and βext from CAPS-PMex. Considering the various measurement uncertainties indicated in the previous section, we determined the range of uncertainties in the deduced RI values by exploring the influence of uncertainties in the measured size distributions and optical coefficients on the deduced RI values. The obtained uncertainties of the RI in each experiment are summarized in . These uncertainties were determined based on the difference between the RI determined using the measured optical properties and size distributions and the RI values determined using the uncertainty-adjusted values of the optical properties and size distributions. The adjusted values were based on the uncertainties for βscat and βabs at 375 nm (4.5 and 6%, respectively), βext at 632 nm (10%), and size distribution uncertainties (sizing uncertainty of 3% and counting uncertainty of 10%). Our results indicate the uncertainties for n at 375 nm, n at 632 nm, and k at 375 nm to be up to ,
, and
, respectively. Additional information for validating our approach to calculate RI is provided in the SI.
Results and discussion
Longifolene
An example of the experimental profile of longifolene oxidation under high-NOx conditions is provided in Figure S2a-c. SOA particle production began immediately after the lights were turned on and particle size grew slowly throughout the experiment (Figure S2b), but coagulation and particle-wall losses caused the total number concentration to decrease sharply soon after the start of irradiation (∼10–15 min after initial irradiation). Trends in βscat and βabs at 375 nm and βext at 632 nm were initially controlled by the increase in number concentration and particle size and ceased to increase during the latter part of the experiment due to the decrease in number concentration and lack of a significant growth. As shown in Figure S2c, absorption coefficient at 375 nm showed maximum values of ∼2 Mm−1 throughout the experiment, suggesting that the SOA particles were mostly scattering.
shows SSA for longifolene SOA particles as a function of size parameter (x) at 375 nm (color-coded to OH exposure). As further discussed in the SI, the propagated uncertainties for SSA are estimated to be ∼6.3% for longifolene SOA. During the fast initial growth of SOA particles, the 140 s SEMS distributions are not truly representative of the aerosol size distribution in the chamber. Therefore, to provide the most certain estimates of optical parameters, we implemented a criteria in all experiments to exclude data points when the mode of the size distribution increased by more than 2.5–3% in two consecutive SEMS runs. Regardless of the NOx regime and the initial HC/NOx condition, longifolene SOA particles were mostly scattering, with minimal absorption, leading to SSA values ∼0.99 for x > 1.5. Although OH exposures for high-NOx conditions were ∼5.5× greater than intermediate-NOx conditions, the overall SSA was insensitive to OH exposure.
Figure 1. (a) SSA vs. size parameter, and (b) n at 375 nm, (c) k at 375 nm, and (d) n at 632 nm vs. OH exposure for longifolene SOA particles.
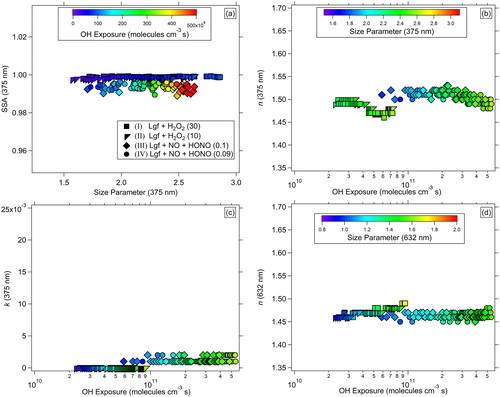
To investigate the intrinsic optical parameters related to chemical composition, we examined trends in RI of SOA particles with the extent of oxidation, that is, OH radical exposure (molecules cm−3 s), and size parameter. Under intermediate-NOx regimes, n = 1.49–1.50 for initial OH exposure of 2 × 10¹⁰ – 3.6 × 10¹⁰ molecules cm−3 s, and decreased to 1.43 when OH exposure increased to 9.5 × 10¹⁰ molecules cm−3 s (). In contrast, under high-NOx regimes, n remained constant at about 1.49–1.52 for OH exposures between 5 × 10¹⁰ and 5.5 × 10¹¹ molecules cm−3 s (x = 1.5–2.5). Regardless of the initial longifolene concentration for experiments under intermediate-NOx regimes, k was mostly zero after OH exposure of 2 × 10¹⁰ molecules cm−3 s. However, under high-NOx regimes, k ranged from 0.001–0.002, showing minimally absorbing SOA products. Although there is a clear difference in the behavior of n between experiments under intermediate- and high-NOx conditions for OH exposure >4 × 10¹⁰ molecules cm−3 s, the SSA remained close to 0.99 for both conditions, indicating formation of mostly scattering SOA products. There was no significant trend in n at 632 nm under intermediate- and high-NOx conditions, with values in the range of 1.45–1.47 at OH exposure >2 × 10¹⁰ molecules cm−3 s for both conditions.
α-pinene
SSA values of α-pinene SOA particles formed under intermediate-NO× conditions were similar to longifolene SOA particles. Note that we only report on α-pinene SOA particles formed under intermediate-NOx regimes with HC/NOx >4 (OH exposure = 2.5 × 10¹⁰ – 9.5 × 10¹⁰ molecules cm−3 s) due to the low SOA particles formed under high-NOx conditions, resulting in optical measurements being below instrumental detection limits. Similar to longifolene SOA particles, α-pinene SOA particles were scattering aerosols with minimal absorption, resulting in SSA values of ∼0.98–0.99 for x > 0.5 (Figure S3a). At 375 nm and for x > 1.5, n and k values ranged between 1.45–1.48 and 0.000–0.002, respectively (Figure S3b-c). At 632 nm, n was constant at 1.45–1.46 (Figures S3d). Limited number of previous retrievals of n and k values at similar wavelengths are available to compare to our estimates. For SOA particles generated from OH oxidation of α-pinene in a Potential Aerosol Mass (PAM) flow reactor in the absence of NOx, Lambe et al. (Citation2013) utilized CRDS (405 nm) and UV-vis spectrometry. Lambe et al. (Citation2013) observed that n decreased from 1.51 (± 0.02) to 1.45 (± 0.04) as OH exposure increased from ∼1 × 10¹¹ to 1.5 × 10¹² molecules cm−3 s, whereas k values at 405 nm ranged from 0.0002 to 0.001 with little trend. Although our measurement wavelengths are not identical, the values we determined for n and k at 375 nm are consistent with those of Lambe et al. (Citation2013) at 405 nm when considering the variability in those measurements and our uncertainties indicated in . More importantly, the decreasing trend in n with the increase in OH exposure was captured by both studies. Nakayama et al. (Citation2010, Citation2012) reported similar n values for ozonolysis of α-pinene at wavelengths of 355 nm (n = 1.458) and 405 nm (n = 1.463–1.475) for NOx levels at 0 and 180 ppbv, respectively, and initial α-pinene concentrations of 100 ppm, utilizing CRDS and PAS techniques. The similarity in n values at near UV to UV ranges for the oxidation of α-pinene suggests consistency in the optical properties of α-pinene SOA products, regardless of the NOx condition or oxidation method.
1-Methylnaphthalene
Figure S4 presents an example of the experimental profile of 1-methylnaphthalene oxidation. Like longifolene, the production of SOA particles began immediately after the lights were turned on and particle size grew slowly throughout the experiment (Figure S4b), but coagulation and particle-wall losses caused the total number concentration to decrease sharply. In contrast to the biogenic systems, βabs also increased significantly with SOA particle production (Figure S4c). βscat and βabs at 375 nm and βext 632 nm peaked at different times after irradiation due to differences in size-dependence of aerosol optical efficiencies at different wavelengths.
The profiles of SSA vs. x showed relatively consistent values in SSA between 0.92 and 0.95 under intermediate-NOx conditions (). However, there is a clear and significant difference in SSA values for a given x between 1-methylnaphthalene experiments at different initial HC/NOx ratios. We observed that under high-NOx regimes (initial HC/NOx ∼0.4) and at x = 0.6–0.8, SSA increased from 0.75 to 0.85 likely due to a combination of an increase in aerosol scattering efficiency due to growth in size and changes in composition. At larger size parameters (x = 0.8–1.25), SSA approached values that are ∼5–10% lower than those under intermediate-NOx regimes (HC/NOx >2.6): 0.85–0.90 vs. 0.92–0.95. Considering the uncertainty of ∼6.1% in the calculated SSA values, this observation suggests that high-NOx conditions resulted in the formation of SOA components that are chemically different and more absorbing, leading to lower SSA values.
Figure 2. (a) SSA vs. size parameter, and (b) n at 375 nm, (c) k at 375 nm, and (d) n at 632 nm vs. OH exposure for 1-methylnaphthalene SOA particles. White crosses indicate NO injection 2 h after irradiation.
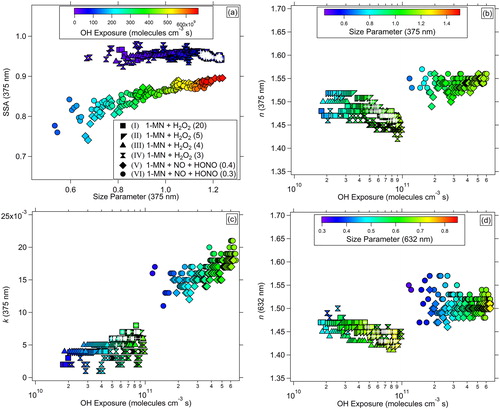
The real components of RI at 375 nm for size parameter x > 0.6 were 1.53–1.57 and 1.53–1.44 (with a decreasing trend) under high- and intermediate-NOx regimes, respectively. We observed an increasing trend in k with increases in x. For intermediate- and high-NOx conditions, k increased from 0.004 to 0.008 and from ∼0.013 to 0.020 for x > 0.6. Focusing on the latter parts of the experiments (OH >5 × 10¹¹ molecules cm−3 s), n under high-NOx conditions was only ∼10% greater than in intermediate-NOx conditions, while k was ∼3 times higher under high-NOx conditions. This relatively higher contribution of absorption to the overall RI is consistent with the lower SSA observed under high-NOx conditions.
Similar to the observations at 375 nm, n at 632 nm was slightly higher under high-NOx regimes compared to intermediate-NOx: 1.49–1.53 vs. 1.41–1.51, respectively, for x > 0.4 (). Differences in the dominant reaction pathways for RO2, that is, RO2+NO reactions under high-NOx and RO2+HO2 under intermediate-NOx conditions (Liu et al. Citation2015; Nakayama et al. Citation2013; Ng et al. Citation2007), likey led to significant compositional differences of 1-methylnaphthalene SOA particles and altered both n (at 375 nm and 632 nm) and k (at 375 nm) values. Further evaluation of the production of light absorbing compounds and chemical difference of SOA particles under high- and intermediate-NOx conditions will be investigated in a follow-up paper.
To further evaluate the impact of RO2+NO chemistry on RI, in experiments under intermediate-NOx and higher initial 1-methylnaphthalene concentrations (experiments referenced I and II), NO was injected in the chamber ∼2 h after the start of irradiation (indicated by the white cross markers in ). Doing so decreased the HC/NOx ratio at the instant of NO injection. No significant change in n at 375 nm and 632 nm and k at 375 nm was observed in comparison to the times before NO injection, indicating that availability of NO radicals to significantly alter RO2 chemistry is more critical during initial stages of 1-methylnaphthalene oxidation and RO2 production.
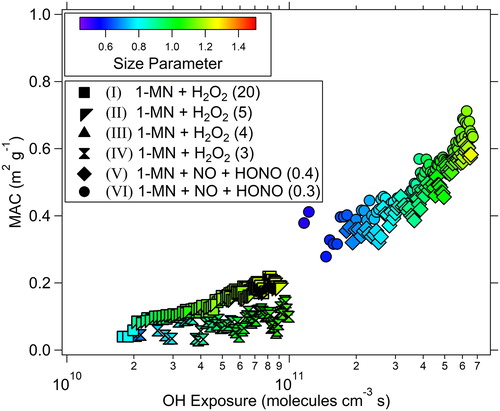
The bulk MAC, that is, mass-normalized values of βabs at 375 nm, were calculated using the mass concentrations based on the SEMS integrated volume distributions and average effective densities that were determined by comparing SEMS volume distributions as a function of mobility diameter and mAMS mass distributions as a function of vacuum aerodynamic diameter (more information on MAC calculations are presented in the SI). MAC is an important parameter in climate models to determine the relationship between aerosol radiative effects and mass concentration (Bond and Bergstrom Citation2006). As shown in , as the OH exposure progressed to values greater than 1 × 10¹¹ molecules cm−3 s, MAC values increased from ∼0.3 to 0.7 m2 g−1 during the high-NOx conditions. During experiments under intermediate-NOx conditions and at OH exposures of 1.5 × 10¹⁰ to 9.9 × 10¹⁰ molecules cm−3 s, MAC increased from ∼0.1 to 0.3 m2 g−1. As shown as an example in Figure S4a, during the latter part of each experiment, SEMS volume concentrations decreased; a decrease in SOA particle volume, and hence mass concentration, could lead to an apparent increase in MAC. MAC values were strongly and positively correlated (r = 0.92 and 0.96) with the derived k values under both high-and intermediate-NOx conditions, respectively. This correlation indicates that the increase in MAC at longer OH exposures and larger size parameters was not due to any sampling artifacts, but rather the presence of more absorbing aerosol (i.e., with higher k values) per unit SOA particle mass. Previous laboratory and field studies have found different aerosol MAC values depending on the source, wavelength of radiation, chemical composition, etc (Moise et al. Citation2015). Hecobian et al. (Citation2010) found that urban water-soluble organic carbon (WSOC) impacted by biomass burning emissions in the South East U.S had MAC (at 355 nm) values of 0.70 ± 0.07 m2 g−1 and 0.31 ± 0.20 m2 g−1 during winter and summer, respectively. In urban-influenced air masses in California, Cappa et al. (Citation2012) observed BrC MAC values (405 nm) of 0.12–0.14 m2 g−1. In comparison to previously measured ambient MAC values, our values under high-NOx conditions are most similar to those observed in biomass burning emissions, whereas MAC under intermediate-NOx conditions reflects similar values to urban aerosols. It should be noted that the measurements made by the groups mentioned above were based on ambient samples of aerosols, not a single hydrocarbon precursor.
Figure 3. Trends in the derived MAC with OH exposure for 1-methylnaphthalene SOA particles.
Mixed biogenic and anthropogenic SOA particles
As described before, to promote condensation of oxidized hydrocarbon vapors, we formed phenol and toluene SOA particles under intermediate- and high-NOx conditions in the presence of longifolene seed aerosol (Lgf + Phe and Lgf + Tol experiments). In these experiments, we initially injected ∼50 ppbv of longifolene into the chamber. Oxidation of longifolene by OH was initiated similar to the other hydrocarbons by photolysis of H2O2 for intermediate-NOx and HONO for high-NOx conditions. Longifolene reacted quickly, resulting in ∼1000 particles cm−3 of SOA in ∼10–15 min after irradiation time, at which point the aromatic hydrocarbon, phenol or toluene, was injected into the chamber. Note that only 10–35% of longifolene had reacted away at the time of aromatic injection. Initial number concentration of longifolene SOA particles provided surface area for condensation of vapors produced from oxidation of phenol or toluene. The OH exposure levels stated for these mixture experiments are based on the time since injection of the aromatic hydrocarbon. We performed Mie calculations and χ2 analysis as described above to obtain the overall n and k values of the mixed SOA particles. To isolate the absorbing properties of phenol and toluene SOA particles, we performed mass weighted calculations (i.e., volume weighted calculations assuming similar densities of the two SOA components) and determined the imaginary component of RI for phenol or toluene SOA particles by using the following equation:
(5)
(5)
where kmix is the imaginary component of RI of mixed SOA, kLgf is that of pure longifolene SOA particles assumed to be 0.002 based on our observations during longifolene experiment III and IV, fLgf is the mass fraction of longifolene in the mixed precursor experiment, and karom is the imaginary component of RI of phenol and tolune SOA particles formed in the mixed-precursor experiments. Note that the k values derived from EquationEquation (5)
(5)
(5) might be different than the values for pure phenol or toluene SOA particles as we cannot exclude the possibility of longifolene and aromatic oxidation products interacting with one another. Mass fraction of longifolene was determined by comparing the mass fraction of a fragment common to terpene-related compounds (i.e., m/z 79) (McLafferty and Turecek Citation1993) in the mAMS mass spectra during the mixed-hydrocarbon experiment with the fraction in pure longifolene experiments at comparable oxidation conditions. Based on this calculation, mass fraction of longifolene was at 1 at the time of aromatic compound injection, and it decreased linearly to 0.87 and 0.73 for phenol and toluene experiments, respectively, by the end of the experiment. Example mass spectra of Lgf, Lgf + Phe, and Lgf + Tol SOA particles at the peak mass concentration of experiments are shown in Figure S5.
Longifolene + phenol SOA mixtures
The SSA for Lgf + Phe SOA (SSALgf+Phe) particles was mostly >0.93 for x > 1.3, suggesting mostly scattering aerosols. At intermediate-NOx conditions (HC/NOx >10), SSALgf+Phe were measured to be ∼0.97–0.99. At high-NOx conditions (HC/NOx <0.2), Lgf + Phe SOA particle mixture were slightly more scattering than 1-methylnaphthalene SOA particles with SSALgf+Phe ∼0.94–0.97 for x > 1.5 (Figure S6a), but the difference is within the estimated uncertainties of SSA in these systems (∼6.1–6.3%).
The real part of the refractive index of Lgf + Phe mixture, nLgf+Phe, at intermediate-NOx conditions ranged from 1.41 to 1.51. At high-NOx conditions, nLgf+Phe was consistent at 1.50–1.52 for OH exposure 4 × 10¹⁰ – 4.3 × 10¹¹ molecules cm−3 s, then decreased only slightly to 1.46 at the longer exposure levels (Figure S6b). In contrast to the decreasing trend in nLgf+Phe, values of kLgf+Phe increased from 0.002 to 0.005 and 0.005 to 0.013 with increase in OH exposure for intermediate- and high-NOx conditions, respectively (Figure S6c), showing a similar behavior to that of 1-methylnaphthalene SOA particles. This observation highlights the contribution of phenol SOA to absorption and suggests that the chemical pathways of aromatics oxidation and SOA particle formation are somewhat preserved within similar conditions and systems. Under intermediate- and high-NOx conditions, nLgf+Phe at 632 nm were relatively constant at 1.50–1.55 and 1.46–1.48 for OH exposure greater than 2 × 10¹⁰ and 3 × 10¹⁰ molecules cm−3 s, respectively.
Similar to pure 1-methylnaphthalene SOA particles, MAC of Lgf + Phe SOA mixtures (MACLgf+Phe) increased with OH exposure (Figure S7), and MACLgf+Phe values were strongly correlated (r = 0.98) with the derived kLgf+Phe values. Under intermediate- and high-NOx conditions, MACLgf+Phe were 0.1–0.2 and 0.2–0.6 m2 g−1, respectively. MAC values for 1-methylnaphthalene ranged from 0.1 to 0.7 m2 g−1, indicating that SOA particles produced from both aromatic systems contain absorbing components.
As described in Liu et al. (Citation2016), in mixtures of biogenic and anthropogenic SOA particles, the non-absorbing biogenic SOA will “dilute” the absorbing properties of the anthropogenic SOA. Using volume weighted calculations, we isolated kphenol as described above (EquationEquation (5)(5)
(5) ). Although kLgf+Phe increased with OH exposure, given the increase in mass fraction of phenol-SOA during the experiments, derived kphenol for phenol fraction >0.05 decreased from 0.10 to 0.02 and 0.22 to 0.05 for intermediate- and high-NOx conditions, respectively, which is in contrast to that of 1-methylnaphthalene. Regardless, the predicted kphenol values were ∼2.5–50 times higher than that of pure 1-methylnaphthalene SOA at comparable OH exposure levels. Additionally, kphenol values were ∼2.6 times higher in high-NOx conditions compared to intermediate-NOx conditions. As apparent from the similarity in the mass spectra of pure longifolene SOA particles vs. Lgf + Phe SOA particles (Figure S5), SOA particles produced in the mixture was dominated by longifolene products. However, even less than 20% contribution of phenol SOA particles appears to have influenced the overall absorbing properties of the mixture due to its strongly absorbing characteristics. Further evaluation of the absorbing properties and chemical nature of the chormophores in the Lgf + Phe SOA aerosol mixture will be made in the future.
Longifolene + toluene SOA mixtures
Similar to SOA products of Lgf + Phe, SSALgf+Tol of Lgf + Tol SOA particles was >0.94 for x > 1, suggesting mostly scattering aerosols (Figure S8a). Under intermediate-NOx (HC/NOx >18) and at x > 1.5, SSALgf+Tol was about 0.98–0.99. For high-NOx conditions (HC/NOx <0.22), SSALgf+Tol approached 0.96–0.98, indicating some SOA particle absorbing characteristics, although the difference is within the measurement uncertainties (∼6.3%).
Similar to phenol, upon oxidation, nLgf+Tol at 375 nm decreased at longer exposures (Figure S8b). For example, under intermediate-NOx conditions, nLgf+Tol decreased from ∼ 1.45 to 1.37 at OH exposure >2 × 10¹⁰ molecules cm−3 s. Under high-NOx conditions, nLgf+Tol was relatively constant at ∼1.51 and 1.47 (for reference experiment V and VI, respectively) until OH exposure levels of ∼4 × 10¹¹ molecules cm−3 s, beyond which it decreased to 1.47 and 1.42, respectively (Figure S8b). Under intermediate-NOx conditions and at OH exposure of 2 × 10¹⁰ to 1.2 × 10¹¹ molecules cm−3 s, kLgf+Tol values were variable between experiments (0.001–0.005). The initial variability in kLgf+Tol might have resulted from variable fractional contributions of toluene SOA particles to the mixture and will be further investigated in the future. However, kLgf+Tol remained constant at OH exposure >5 × 10¹⁰ molecules cm−3 s at values 0.001–0.002 (Figure S8c). In experiments under high-NOx conditions, kLgf+Tol values were ∼0.001–0.011 for OH exposure >5 × 10¹⁰ molecules cm−3 s. In Figure S8d, the trend for nLgf+Tol at 632 nm was explored. In contrast to nmix at 375 nm, nmix at 632 nm remained constant at 1.48–1.53 and 1.45–1.47 under intermediate- and high-NOx conditions at OH exposure >2 × 10¹⁰ molecules cm−3 s.
A similar volume-weighted calculation was performed for the Lgf + Tol SOA mixture during reference experiment VI when enhanced absorption was observed. With the toluene SOA particle fraction increasing to 0.2 at the longest OH exposure, the average ktol during the experiment was 0.036 ± 0.026, with a decreasing trend from 0.12 to 0.02. Previous data on the imaginary component of RI of toluene SOA particles are limited to relatively lower NOx conditions compared to this study, with k values in the range of 0.0018–0.0072 (Nakayama et al. Citation2010; Nakayama et al. Citation2013). The significantly higher ktoluene values determined in our study may be the result of lower HC/NOx levels (<0.23 vs. 7 or 37; Nakayama et al. Citation2010; Nakayama et al. Citation2013) or the consequence of unique chemistry in these mixed SOA systems. Although we observed some absorbing properties in the SOA for Lgf + Tol mixtures under high-NOx conditions, the absorbing properties of the mixture and that of toluene SOA particles were not as strong as in the Lgf + Phe system.
Atmospheric implications
SSA is an important parameter in climate models for estimating radiative forcing. In this section, we compare our SSA values at size parameters >0.8 from laboratory studies and field measurements of ambient aerosols. In this study, OH oxidation of 1-methylnaphthalene, Lgf + Phe mixture, and Lgf + Tol at high- (and intermediate-NOx) conditions resulted in SSA= 0.85–0.90 (and 0.92–0.95), 0.94–0.97 (0.97–0.99), and 0.96–0.98 (0.98–0.99), respectively. However, oxidation of longifolene and α-pinene led to the formation of highly scattering SOA particles, with SSA ∼0.98–0.99. In biomass burning events, Lack et al. (Citation2012) observed SSA = 0.85 at 404 nm in fires near Boulder, Colorado, while Ma and Thompson (Citation2012) reported SSA = 0.83-0.84 (± 0.01) at 355 nm for biomass burning aerosols of pear tree leaves and Afghanistan pine needle in laboratory and ambient studies (Lack et al. Citation2012; Ma and Thompson Citation2012). Ambient biomass burning SSA values reflect the absorbing contribution of BC and are therefore lower than 0.90. For individual hydrocarbon precursors, Lambe et al. (Citation2013) observed SSA for naphthalene SOA particles to be 0.96 at OH exposures most comparable to those in our intermediate-NOx experiments, which is in good agreement with the SSA of 1-methylnaphthalene SOA particles under similar NOx regimes.
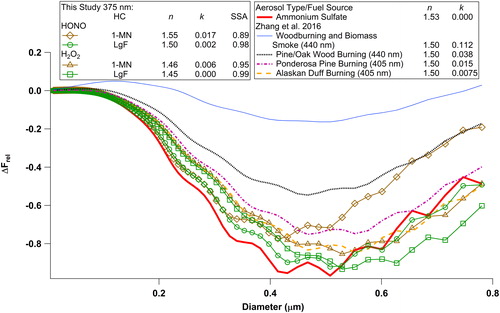
We compared relative radiative forcing effects of SOA particles at λ = 375 nm from the oxidation of 1-methylnaphthalene and longifolene to a purely scattering aerosol component, namely ammonium sulfate, and several biomass burning fuel types (). We evaluated the relative direct radiative forcing values based on a simplified equation (Zarzana et al. Citation2012):
(6)
(6)
Figure 4. Relative radiative forcing calculated for different RI values as a function of aerosol size.
Where is the surface albedo (0.153 to represent the average albedo of urban environments), β is the fraction of radiation scattered in the upward direction, and Qscat and Qabs are the scattering and absorption efficiencies, respectively, based on RI of interest. β was obtained using the following equation (Zarzana et al. Citation2012; Moosmüller and Ogren Citation2017; Sagan and Pollack Citation1967; Hassan et al. Citation2015):
(7)
(7)
where g is the asymmetry parameter that represents the angular distribution of scattering and is assumed as 0.50 (McComiskey et al. Citation2008). Note that the n and k values used in the calculations represent points during the latter part of our experimental runs, with OH exposure greater than 1 × 10¹¹ molecules cm−3 s and 5 × 10¹¹ molecules cm−3 s for intermediate- and high-NOx, conditions, respectively, corresponding to 14–70 h of photochemical oxidation under ambient conditions (assumed OH = 2 × 10⁶ molecules cm−3). Overall, the estimated urban relative radiative forcing at λ = 375 nm (ΔFrel,urban) decreased to a more negative value with increase in size from 0.01 to 0.4 µm, reaching minimum values at ∼0.4–0.5 µm depending on the RI, before increasing at larger sizes, reflecting the size dependency of Qscat and Qabs. We observed that in the size range of 0.01–0.4 µm, 1-methylnaphthalene and longifolene SOA particles under intermediate-NOx conditions follow similar trends as OA formed in burns of ponderosa pine and Alaskan duff. However, at sizes larger than 0.4 µm, longifolene SOA particles are predicted to have the most negative relative forcing while 1-methylnaphthalene followed a similar profile to ammonium sulfate and Alaskan duff burning. For the more absorbing SOA particles from 1-methylnaphthalene under high-NOx conditions, relative forcing values were most similar to OA in emissions from ponderosa pine and Alaskan duff burns at sizes smaller than ∼0.4–0.5 µm. The estimated negative ΔFrel,urban decreased by up to 75% at larger sizes, approaching values observed for OA in pine/wood burning. The influence of absorbing SOA on urban relative radiative forcing at 375 nm is most significant for aerosol sizes greater than 0.4 µm. For example, relative radiative forcing from absorbing SOA particles of 1-methylnaphthalene under high-NOx conditions was ∼40–65% less negative than that of purely scattering SOA particles from longifolene at >0.6 μm whereas this difference was insignificant at 0.4 μm. Additional calculations of ΔFrel with albedo values of global land (0.26) and snow (0.85) surfaces (ΔFrel, land and ΔFrel, snow, respectively) are shown in Figure S9 (Sailor Citation1995; Yu et al. Citation2010; Roesch Citation2006). Increasing
from 0.153 in our base calculation () to 0.26 and 0.85 presents ΔFrel profiles (Figure S9) with less negative values compared to ΔFrel, urban. In Figure S9a, ΔFrel, land from wood burning shows predominantly positive values at all size ranges, while the other aerosol types have ∼24% to 270 times less negative ΔFrel, land when compared to ΔFrel, urban (). Over the reflective surfaces of fresh snow (Figure S9b), all aerosol types with absorbing characteristics led to positive ΔFrel, snow values. In this case, 1-MN SOA particles under high NOx conditions led to ΔFrel, snow being ∼10–60% higher than that from ammonium sulfate for sizes in the range of 0.1–0.8 µm. We note that the relative radiative effect calculations presented above are at λ = 375 nm, which is far from the peak of the solar spectrum. Given the strong wavelength dependence of BrC optical properties, the extent of the bias in estimating direct radiative effects of SOA by neglecting its absorption properties strongly depends on SOA size distributions, the wavelength of interest, and surface reflectivity.
Conclusions
In this study, we observed different optical properties between biogenic and anthropogenic SOA particles. SSA showed that regardless of the NOx regime, longifolene and α-pinene SOA particles were purely scattering with SSA values ∼0.98–0.99. In contrast, anthropogenic SOA particles from 1-methylnaphthalene precursor showed lower SSA values of 0.92–0.95 and 0.75–0.90 under intermediate- and high-NOx regimes, respectively. The significantly lower SSA values in high-NOx conditions corresponded to higher k values (by a factor of 3 compared to intermediate-NOx conditions). In addition, MAC values of 1-methylnaphthalene SOA particles increased with increase in OH exposure from ∼0.3 m2 g−1 to 0.7 m2 g−1 during high-NOx conditions, while in experiments under intermediate-NOx conditions, MAC increased from ∼0.1 to 0.3 m2 g−1, signifying the impact of NOx in oxidation chemistry of 1-methylnaphthalene. In Lgf + Phe mixture experiments, we determined that SSALgf+Phe was ∼0.94–0.99, and kphenol decreased with OH exposure from 0.10 to 0.02 and 0.22 to 0.05 for intermediate- and high-NOx conditions, respectively. However, despite the decrease in kphenol, kphenol was at least 2.5–50 times greater than that of pure 1-methylnaphthalene SOA particles at high-NOx conditions. MACLgf+Phe values were 0.1–0.2 and 0.2–0.6 m2 g−1 for intermediate- and high-NOx conditions, respectively, indicating similarity with 1-methylnaphthalene MAC. In Lgf + Tol SOA particle mixture, the average ktoluene was 0.036 ± 0.026, which is also considerably higher than the values reported in Nakayama et al. (Citation2010, Citation2013), possibly due to the high-NOx conditions in our system or the unique chemistry of the biogenic and aromatic mixture.
Supplemental Material
Download Zip (5 MB)Acknowledgments
The authors would like to thank Dr. Charles A. Brock (NOAA-ESRL) for providing the code for Mie calculations.
Additional information
Funding
Related Research Data
References
- Andreae, M. O., and A. Gelencsér. 2006. Black carbon or brown carbon? The nature of Light-Absorbing carbonaceous aerosols. Atmos. Chem. Phys. 6(10):3131–3148. doi:10.5194/acp-6-3131-2006.
- Bohren, C. F., and D. R. Huffman. 1998. Absorption and scattering of light by small particles. New York: Wiley.
- Bond, T. C., and R. W. Bergstrom. 2006. Light absorption by carbonaceous particles: An investigative review. Aerosol sci. Technol. 40 (1):27–67. doi:10.1080/02786820500421521.
- Bond, T. C., S. J. Doherty, D. W. Fahey, P. M. Forster, T. Berntsen, B. J. DeAngelo, M. G. Flanner, S. Ghan, B. Karcher, D. Koch. 2013. Bounding the role of black carbon in the climate system: A scientific assessment. J. Geophys. Res. Atmos. 118 (11):5380–5552. doi:10.1002/jgrd.50171.
- Cappa, C. D., T. B. Onasch, P. Massoli, D. R. Worsnop, T. S. Bates, E. S. Cross, P. Davidovits, J. Hakala, K. L. Hayden, B. T. Jobson. 2012. Radiative absorption enhancements due to the mixing state of atmospheric black carbon. Science 337 (6098):1078–1081. doi:10.1126/science.1223447.
- Chakrabarty, R. K., M. Gyawali, R. L. N. Yatavelli, A. Pandey, A. C. Watts, J. Knue, L. W. A. Chen, R. R. Pattison, A. Tsibart, V. Samburova, and H. Moosmüller. 2016. Brown carbon aerosols from burning of boreal peatlands: Microphysical properties, emission factors, and implications for direct radiative forcing. Atmos. Chem. Phys. 16 (5):3033–3040. doi:10.5194/acp-16-3033-2016.
- Chan, A. W. H., K. E. Kautzman, P. S. Chhabra, J. D. Surratt, M. N. Chan, J. D. Crounse, A. Kürten, P. O. Wennberg, R. C. Flagan, and J. H. Seinfeld. 2009. Secondary organic aerosol formation from photooxidation of naphthalene and alkylnaphthalenes: Implications for oxidation of intermediate volatility organic compounds (IVOCs). Atmos. Chem. Phys. 9 (9):3049–3060. doi:10.5194/acp-9-3049-2009.
- Claeys, M., R. Vermeylen, F. Yasmeen, Y. Gómez-González, X. Chi, W. Maenhaut, T. Mészáros, and I. Salma. 2012. Chemical characterisation of humic-like substances from urban, Rural and tropical biomass burning environments using liquid chromatography with UV/vis photodiode array detection and electrospray ionisation mass spectrometry. Environ. Chem. 9 (3):273–284. doi:10.1071/EN11163.
- Di Filippo, P., C. Riccardi, D. Pomata, and F. Buiarelli. 2010. Concentrations of PAHs, and nitro- and methyl- Derivatives associated with a size-segregated urban aerosol. Atmos. Environ. 44 (23):2742–2749. doi:10.1016/j.atmosenv.2010.04.035.
- Dingle, J. H., K. Vu, R. Bahreini, E. C. Apel, T. L. Campos, F. Flocke, A. Fried, S. Herndon, A. J. Hills, R. S. Hornbrook. 2016. Aerosol optical extinction during the front range air pollution and photochemistry éxperiment (FRAPPÉ) 2014 summertime field campaign, Colorado U.S.A. Atmos. Chem. Phys. 16 (17):1–21. doi:10.5194/acp-2016-211.
- Feng, Y., V. Ramanathan, and V. R. Kotamarthi. 2013. Brown carbon: A significant atmospheric absorber of solar radiation?. Atmos. Chem. Phys. 13 (17):8607–8621. doi:10.5194/acp-13-8607-2013.
- Friedlander, S. K. 2000. Smoke, Dust, and haze: Fundamentals of aerosol dynamics. 2nd ed. New York: Oxford University Press, Inc.
- Hallquist, M., J. C. Wenger, U. Baltensperger, Y. Rudich, D. Simpson, M. Claeys, J. Dommen, N. M. Donahue, C. George, A. H. Goldstein. 2009. The formation, properties and impact of secondary organic aerosol: Current and emerging issues. Atmos. Chem. Phys. 9 (14):5155–5236. doi:10.5194/acp-9-5155-2009.
- Hassan, T., H. Moosmüller, and C. E. Chung. 2015. Coefficients of an analytical aerosol forcing equation determined with a Monte-Carlo radiation model. J. Quant. Spectrosc. Radiative Transfer 164 :129–136. doi:10.1016/j.jqsrt.2015.05.015.
- He, Q. F., N. Bluvshtein, L. Segev, D. Meidan, J. M. Flores, S. S. Brown, W. Brune, and Y. Rudich. 2018. Evolution of the complex refractive index of secondary organic aerosols during atmospheric aging. Environ. sci. Technol. 52 (6):3456–3465. doi:10.1021/acs.est.7b05742.
- Hecobian, A., X. Zhang, M. Zheng, N. Frank, E. S. Edgerton, and R. J. Weber. 2010. Water-soluble organic aerosol material and the light-absorption characteristics of aqueous extracts measured over the southeastern United States. Atmos. Chem. Phys. 10 (13):5965–5977. doi:10.5194/acp-10-5965-2010.
- Hersey, S. P., J. S. Craven, K. A. Schilling, A. R. Metcalf, A. Sorooshian, M. N. Chan, R. C. Flagan, and J. H. Seinfeld. 2011. The pasadena aerosol characterization observatory (PACO): Chemical and physical analysis of the Western Los Angeles basin aerosol. Atmos. Chem. Phys. 11 (15):7417–7443. doi:10.5194/acp-11-7417-2011.
- Iinuma, Y., O. Boge, R. Grafe, and H. Herrmann. 2010. Methyl-Nitrocatechols: Atmospheric tracer compounds for biomass burning secondary organic aerosols. Environ. Sci. Technol. 44 (22):8453–8459. doi:10.1021/es102938a.
- Jaramillo, G., C. Buffa, M. Li, F. J. Brechtel, G. Langfelder, and D. A. Horsley. 2013. MEMS electrometer with femtoampere resolution for aerosol particulate measurements. IEEE Sensors J. 13 (8):2993–3000. doi:10.1109/JSEN.2013.2266335.
- Kim, H., B. Barkey, and S. E. Paulson. 2010. Real refractive indices of α- and β-Pinene and toluene secondary organic aerosols generated from ozonolysis and photo-oxidation. J. Geophys. Res. Atmos. 115 :D24212. doi:10.1029/2010jd014549.
- Kim, H., B. Barkey, and S. E. Paulson. 2012. Real refractive indices and formation yields of secondary organic aerosol generated from photooxidation of limonene and α-Pinene: The effect of the HC/NOx ratio. J. Phys. Chem. A 116 (24):6059–6067. doi:10.1021/jp301302z.
- Kim, H., and S. E. Paulson. 2013. Real refractive indices and volatility of secondary organic aerosol generated from photooxidation and ozonolysis of limonene, α-pinene and toluene. Atmos. Chem. Phys. 13 (15):7711–7723. doi:10.5194/acp-13-7711-2013.
- Kokhanovsky, A. A. 2008. Aerosol optics: Light absoprtion and scattering by particles in the atmosphere. Chichester, UK: Praxis Publishing.
- Lack, D. A., J. M. Langridge, R. Bahreini, C. D. Cappa, A. M. Middlebrook, and J. P. Schwarz. 2012. Brown carbon and internal mixing in biomass burning particles. Proc. Natl. Acad. Sci. USA 109 (37):14802–14807. doi:10.1073/pnas.1206575109.
- Lambe, A. T., C. D. Cappa, P. Massoli, T. B. Onasch, S. D. Forestieri, A. T. Martin, M. J. Cummings, D. R. Croasdale, W. H. Brune, D. R. Worsnop, and P. Davidovits. 2013. Relationship between oxidation level and optical properties of secondary organic aerosol. Environ. Sci. Technol. 47 (12):6349–6357. doi:10.1021/es401043j.
- Laskin, A., J. Laskin, and S. A. Nizkorodov. 2015. Chemistry of atmospheric brown carbon. Chem. Rev. 115 (10):4335–4382. doi:10.1021/cr5006167.
- Liu, J. M., P. Lin, A. Laskin, J. Laskin, S. M. Kathmann, M. Wise, R. Caylor, F. Imholt, V. Selimovic, and J. E. Shilling. 2016. Optical properties and aging of light-absorbing secondary organic aerosol. Atmos. Chem. Phys. 16 (19):12815–12827. doi:10.5194/acp-16-12815-2016.
- Liu, P. F., N. Abdelmalki, H. M. Hung, Y. Wang, W. H. Brune, and S. T. Martin. 2015. Ultraviolet and visible complex refractive indices of secondary organic material produced by photooxidation of the aromatic compounds toluene and m-Xylene. Atmos. Chem. Phys. 15 (3):1435–1446. doi:10.5194/acp-15-1435-2015.
- Lopez-Yglesias, X. F., M. C. Yeung, S. E. Dey, F. J. Brechtel, and C. K. Chan. 2014. Performance evaluation of the Brechtel Mfg. Humidified tandem differential mobility analyzer (BMI HTDMA) for studying hygroscopic properties of aerosol particles. Aerosol Sci. Technol. 48 (9):969–980. doi:10.1080/02786826.2014.952366.
- Ma, L. L., and J. E. Thompson. 2012. Optical properties of dispersed aerosols in the near ultraviolet (355 nm): measurement approach and initial data. Anal. Chem. 84 (13):5611–5617. doi:10.1021/ac3005814.
- Massoli, P., P. L. Kebabian, T. B. Onasch, F. B. Hills, and A. Freedman. 2010. Aerosol light extinction measurements by cavity attenuated phase shift (CAPS) Spectroscopy: Laboratory validation and field deployment of a compact aerosol particle extinction monitor. Aerosol Sci. Technol. 44 (6):428–435. doi:10.1080/02786821003716599.
- McComiskey, A., S. E. Schwartz, B. Schmid, H. Guan, E. R. Lewis, P. Ricchiazzi, and J. A. Ogren. 2008. Direct aerosol forcing: Calculation from observables and sensitivities to inputs. J. Geophys. Res. Atmos. 113 (D9):D09202. doi:10.1029/2007jd009170.
- McLafferty, F. W., and F. Turecek. 1993. Interpretation of mass spectra. 4th ed. Sausality, CA: University Science Books.
- Moise, T., J. M. Flores, and Y. Rudich. 2015. Optical properties of secondary organic aerosols and their changes by chemical processes. Chem. Rev. 115 (10):4400–4439. doi:10.1021/cr5005259.
- Moosmüller, H., and J. A. Ogren. 2017. Parameterization of the aerosol upscatter fraction as function of the backscatter fraction and their relationships to the asymmetry parameter for radiative transfer calculations. Atmosphere 8 (12):133. doi:10.3390/atmos8080133.
- Myhre, G., D. Shindell, F.-M. Bréon, W. Collins, J. Fuglestvedt, J. Huang, D. Koch, J.-F. Lamarque, B. Mendoza, D. Lee, T. Nakajima, A. Robock, G. Stephens, T. Takemura, and H. Zhang. 2013. Anthropogenic and Natural Radiative Forcing. In: Climate change 2013: The physical science basis. Contribution of working group I to the fifth assessment report of the intergovernmental panel on climate change, ed. Stocker, T.F., D. Qin, G.-K. Plattner, M. Tignor, S.K. Allen, J. Boschung, A. Nauels, Y. Xia, V. Bex and P.M. Midgley. Cambridge: Cambridge University Press.
- Nakayama, T., Y. Matsumi, K. Sato, T. Imamura, A. Yamazaki, and A. Uchiyama. 2010. Laboratory studies on optical properties of secondary organic aerosols generated during the photooxidation of toluene and the ozonolysis of α-Pinene. J. Geophys. Res. Atmos. 115 :D24204. doi:10.1029/2010jd014387.
- Nakayama, T., K. Sato, Y. Matsumi, T. Imamura, A. Yamazaki, and A. Uchiyama. 2012. Wavelength dependence of refractive index of secondary organic aerosols generated during the ozonolysis and photooxidation of α-Pinene. Sola 8 :119–123. doi:10.2151/sola.2012-030.
- Nakayama, T., K. Sato, Y. Matsumi, T. Imamura, A. Yamazaki, and A. Uchiyama. 2013. Wavelength and NOx dependent complex refractive index of SOAs generated from the photooxidation of toluene. Atmos. Chem. Phys. 13 (2):531–545. doi:10.5194/acp-13-531-2013.
- Nakayama, T., H. Suzuki, S. Kagamitani, Y. Ikeda, A. Uchiyama, and Y. Matsumi. 2015. Characterization of a three wavelength photoacoustic soot spectrometer (PASS-3) and a photoacoustic extinctiometer (PAX). J. Meteorol. Soc. Jpn. 93 (2):285–308. doi:10.2151/jmsj.2015-016.
- Ng, N. L., P. S. Chhabra, A. W. H. Chan, J. D. Surratt, J. H. Kroll, A. J. Kwan, D. C. McCabe, P. O. Wennberg, A. Sorooshian, S. M. Murphy. 2007. Effect of NOx level on secondary organic aerosol (SOA) Formation from the photooxidation of terpenes. Atmos. Chem. Phys. 7 (19):5159–5174. doi:10.5194/acp-7-5159-2007.
- Petzold, A., T. Onasch, P. Kebabian, and A. Freedman. 2013. Intercomparison of a cavity attenuated phase shift-based extinction monitor (CAPS PMex) with an integrating nephelometer and a filter-based absorption monitor. Atmos. Meas. Tech. 6 (5):1141–1151. doi:10.5194/amt-6-1141-2013.
- Ramanathan, V., F. Li, M. V. Ramana, P. S. Praveen, D. Kim, C. E. Corrigan, H. Nguyen, E. A. Stone, J. J. Schauer, G. R. Carmichael, B. Adhikary, and S. C. Yoon. 2007. Atmospheric brown clouds: Hemispherical and regional variations in long-range transport, absorption, and radiative forcing. J. Geophys. Res. Atmos. 112 (D22):D22s21. doi:10.1029/2006jd008124.
- Riziq, A. A., C. Erlick, E. Dinar, and Y. Rudich. 2007. Optical properties of absorbing and non-absorbing aerosols retrieved by cavity ring down (CRD) spectroscopy. Atmos. Chem. Phys. 7 (6):1523–1536. doi:10.5194/acp-7-1523-2007.
- Roesch, A. 2006. Evaluation of surface albedo and snow cover in AR4 coupled climate models. J. Geophys. Res. Atmos. 111 (D15):D15111. doi:10.1029/2005jd006473.
- Sagan, C., and J. B. Pollack. 1967. Anisotropic nonconservative scattering and clouds of venus. J. Geophys. Res. 72 (2):469. &. doi:10.1029/JZ072i002p00469.
- Sailor, D. J. 1995. Simulated urban climate response to modifications in surface albedo and vegatative cover. J. Appl. Meteorol. 34 (7):1694–1704. doi:10.1175/1520-0450-34.7.1694.
- Saleh, R., C. J. Hennigan, G. R. McMeeking, W. K. Chuang, E. S. Robinson, H. Coe, N. M. Donahue, and A. L. Robinson. 2013. Absorptivity of brown carbon in fresh and photo-chemically aged biomass-burning emissions. Atmos. Chem. Phys. 13 (15):7683–7693. doi:10.5194/acp-13-7683-2013.
- Samburova, V., J. Connolly, M. Gyawali, R. L. N. Yatavelli, A. C. Watts, R. K. Chakrabarty, B. Zielinska, H. Moosmüller, and A. Khlystov. 2016. Polycyclic aromatic hydrocarbons in biomass-burning emissions and their contribution to light absorption and aerosol toxicity. Sci. Total Environ. 568 :391–401. doi:10.1016/j.scitotenv.2016.06.026.
- Seinfeld, J. H., and S. N. Pandis. 2006. Atmospheric chemistry and physics: From air pollution to climate change. Hoboken, NJ: Wiley.
- Spindler, C., A. A. Riziq, and Y. Rudich. 2007. Retrieval of aerosol complex refractive index by combining cavity ring down aerosol spectrometer measurements with full size distribution information. Aerosol Sci. Technol. 41 (11):1011–1017. doi:10.1080/02786820701682087.
- Venkataraman, C., G. Habib, A. Eiguren-Fernandez, A. H. Miguel, and S. K. Friedlander. 2005. Residential biofuels in South Asia: Carbonaceous aerosol emissions and climate impacts. Science 307 (5714):1454–1456. doi:10.1126/science.1104359.
- Volkamer, R., J. L. Jimenez, F. San Martini, K. Dzepina, Q. Zhang, D. Salcedo, L. T. Molina, D. R. Worsnop, and M. J. Molina. 2006. Secondary organic aerosol formation from anthropogenic air pollution: Rapid and higher than expected. Geophys. Res. Lett. 33 (17):L17811. doi:10.1029/2006gl026899.
- Vu, K. T., J. H. Dingle, R. Bahreini, P. J. Reddy, E. C. Apel, T. L. Campos, J. P. DiGangi, G. S. Diskin, A. Fried, S. C. Herndon. 2016. Impacts of the denver cyclone on regional air quality and aerosol formation in the Colorado front range during FRAPPÉ 2014. Atmos. Chem. Phys. 16 (18):12039–12058. doi:10.5194/acp-16-12039-2016.
- Wang, L., R. Atkinson, and J. Arey. 2007. Dicarbonyl products of the OH radical-initiated reactions of naphthalene and the C-1- and C-2-Alkylnaphthalenes. Environ. Sci. Technol. 41 (8):2803–2810. doi:10.1021/es0628102.
- Wonaschutz, A., M. Coggon, A. Sorooshian, R. Modini, A. A. Frossard, L. Ahlm, J. Mulmenstadt, G. C. Roberts, L. M. Russell, S. Dey. 2013. Hygroscopic properties of smoke-generated organic aerosol particles emitted in the marine atmosphere. Atmos. Chem. Phys. 13 (19):9819–9835. doi:10.5194/acp-13-9819-2013.
- Yu, Y.,. H. B. Chen, X. G. Xia, Y. J. Xuan, and K. Yu. 2010. Significant variations of surface albedo during a snowy period at Xianghe observatory, China. Adv. Atmos. Sci. 27 (1):80–86. doi:10.1007/s00376-009-8151-2.
- Zarzana, K. J., D. O. De Haan, M. A. Freedman, C. A. Hasenkopf, and M. A. Tolbert. 2012. Optical properties of the products of α-Dicarbonyl and amine reactions in simulated cloud droplets. Environ. sci. Technol. 46 (9):4845–4851. doi:10.1021/es2040152.
- Zhang, Q., J. L. Jimenez, M. R. Canagaratna, J. D. Allan, H. Coe, I. Ulbrich, M. R. Alfarra, A. Takami, A. M. Middlebrook, Y. L. Sun. 2007. Ubiquity and dominance of oxygenated species in organic aerosols in anthropogenically-influenced Northern hemisphere midlatitudes. Geophys. Res. Lett. 34 (13):L13801. doi:10.1029/2007gl029979.
- Zhang, X. L., Y. H. Lin, J. D. Surratt, and R. J. Weber. 2013. Sources, Composition and absorption Ångström exponent of light-absorbing organic components in aerosol extracts from the los angeles basin. Environ. Sci. Technol. 47 (8):3685–3693. doi:10.1021/es305047b.