
Abstract
The main sources of particulate emissions from engines are fuel and lubricating oil. In this study, particles emitted by a medium speed diesel engine for locomotive use were characterized chemically by using a soot particle aerosol mass spectrometer (SP-AMS). Additionally, positive matrix factorization (PMF) was applied to the SP-AMS data for the separation of fuel from lubricating oil and/or oil additives in diesel engine emissions. The mass spectra of refractory species, i.e., metals and rBC, were included in the PMF input matrix in addition to organics in order to utilize the benefit of the SP-AMS to measure non-refractory and refractory species. In general, particulate matter emitted by the diesel engine was dominated by organics (51%) followed by refractory black carbon (rBC; 48%), trace metals and inorganic species (1%). Regarding the sources of particles, PMF indicated four factors for particle mass of which two were related to lubricating oil-like aerosol (LOA1, 29% and LOA2, 24%) and two others to diesel-like fuel aerosol (DFA1, 35% and DFA2, 12%). The main difference between LOA1 and LOA2 was the presence of soot in LOA1 and metals in LOA2 factors. DFA factors represented burned (DFA1) and unburned fuel (DFA2). The results from the PMF analysis were completed with particle size distributions, volatility measurements and particle morphology analyses.
Copyright © 2019 American Association for Aerosol Research
EDITOR:
1. Introduction
Diesel-fuel-powered traffic is a substantial source of atmospheric fine particulate matter (PM) and it has implications on climate and human health (Ramanathan and Carmichael Citation2008). The International Agency for Cancer Research (International Agency for Research on Cancer [IARC] Citation2015) has classified diesel engine exhaust as carcinogenic to humans based on sufficient evidence that exposure is associated with an increased risk for lung cancer. Diesel exhaust contains particles of a wide size range. The size distribution of diesel particles consists of, e.g., nonvolatile core at particle sizes smaller than 10 nm (De Filippo and Maricq Citation2008; Matti Maricq Citation2007; Rönkkö et al. Citation2007), nucleation mode at particle sizes smaller than 30 nm and soot mode with mean particle size between 30–100 nm (e.g., De Filippo and Maricq Citation2008). In addition, a coarse mode may be present at larger particle sizes in the mass distribution. In general, the existence of each particle mode and their physical and chemical characteristics depends significantly on technologies used in engines and after-treatment systems, engine loading conditions, environmental conditions, and on the methods used in exhaust sampling, dilution and measurement. The main chemical components in diesel engine exhaust particles are organics, soot, sulfuric acid, water and trace metals (Maricq Citation2007 and references therein).
Diesel engines are widely used both in road transportation and in non-road applications, such as in mobile machines, locomotive use, ships, and power production. Because the regulatory control programs to reduce non-road PM emissions were lagged behind, the on-road vehicle emissions have reduced faster, which increases the relative importance of non-road emissions (Dallman and Menon Citation2016). These non-road emission becomes significant in places where transportation of passengers and goods, e.g., by locomotives, are used.
The use of aftertreatment systems by non-road diesel engines to control PM emission remains modest when compared to on-road vehicles. The use of diesel particulate filter (DPF), which is widely deployed by on-road diesel vehicles, is not common among locomotive engines (Waluś et al. Citation2018). In fact, the European Commission has only recently approved stricter emission standards for non-road mobile machinery (EU stage V) in order to reduce the PM emission by forcing the manufacturers to use DPF (ICCT Citation2016). In addition, the operation of locomotive engines is quite different from on-road heavy-duty vehicles. That is, locomotives have powerful engines designed to operate at low speeds without the frequent transients experienced in on-road applications (MECA Citation2009). Despite the differences, information on the particulate emissions generated by this type of engines remains poorly characterized (Waluś et al. Citation2018; Park et al. Citation2012).
It should be noted that the engine used in this study was a medium speed diesel engine for locomotive use operating without exhaust aftertreatment systems. Thus, the detailed results regarding the engine exhaust represent technologically this special application and, in some extent, engines used in power generation and ships. E.g., engines in new diesel cars and trucks are technologically significantly different and typically equipped with advanced exhaust aftertreatment systems, such as diesel particle filters (DPF) and thus the emissions of such vehicles are not comparable with results of this study in terms of loading.
Efficient actions in particle emission control require knowledge of the origin and formation processes of the particles in combustion engines. It is known that diesel engine exhaust particles originate typically from fuel and lubricating oil. Particle emissions from lubricating oil has been growing importance as lubricating oil contains additives, which are required to adjust oil properties and increase its lifetime. Such additives may have significant impact on metallic ash content of exhausts. The relative importance of lubricating oil in particle formation is also growing due to the increased use of low sulfur fuels and DFP. Lubricating oil has been observed to affect the nucleation mode particle emissions when the vehicle is equipped with a DFP (Vaaraslahti et al. Citation2005; Kittelson Citation1998) and metallic nanoparticles when diesel engines were operated without exhaust particle filtration (Rönkkö et al. Citation2011). In contrast, particulate emissions from fuel combustion are dominated by elemental carbon (EC) fraction (Kleeman et al. Citation2008), that is typically seen in particle size distribution as a soot mode (see, e.g., Harris and Maricq Citation2001; Kittelson Citation1998). It has been shown that lubricating oil is a dominant (Worton et al. Citation2014) source of primary organic aerosol (POA) in vehicle emissions (Kleeman et al. Citation2008; Brandenberger et al. Citation2005), but in addition to POA, lubricating oil contains cycloalkanes (with one or more rings and one or more branched alkyl side chains) and aromatic compounds that have important role in the atmospheric secondary organic aerosol formation (Worton et al. Citation2014; Tobias et al. Citation2001).
Identification of particles originating from lubricating oil, or fuel, is very challenging due to the complicated nature of aerosol exhaust and divergent effects of engine or after-treatment technologies on particles and their precursors. New methodologies for the identification of the origin of compounds in exhaust particles are needed. Toner et al. (Citation2006) associated a class of aerosol particles containing elemental carbon (EC), calcium (Ca), organic carbon (OC) and phosphate with lubricating oil and/or coagulation of lubricating oil in heavy-duty diesel vehicle exhaust measurements made with the Aerosol time-of-flight mass spectrometer (ATOFMS, Toner et al. Citation2006). Several studies have also utilized Aerosol Mass Spectrometer (AMS) to investigate the relative contributions of fuel and lubricating oil in diesel exhaust by using the mass spectra (MS) of organics (e.g., Tobias et al. Citation2001; Canagaratna et al. Citation2004). Recently, Dallmann et al. (Citation2014) improved this separation by combing organic MS with the trace elements, zinc and phosphorus, detected in particles by using the Soot Particle Aerosol Mass Spectrometer (SP-AMS).
In addition to chemical composition, statistical methods can be utilized to examine the sources of particles. Positive matrix factorization (PMF) has been shown to be a powerful tool in ambient studies to separate particles originating from different sources (e.g., Lanz et al. Citation2010; Ng et al. Citation2010; Carbone et al. Citation2014). In ambient studies, organic aerosol can be typically split to fresh hydrocarbon-like organic aerosol (HOA), and more oxidized semi-volatile and low-volatility organic aerosol (SV-OOA and LV-OOA, respectively) fractions. Also local sources such as biomass burning (BBOA) or cooking (CCOA) are quite often identified (Crippa et al. Citation2014; Timonen et al. Citation2013). PMF has also been utilized for data collected in emission measurements in order to distinguish sources or characteristics of particles. Tiitta et al. (Citation2016) separated two POA and three SOA factors with the PMF analysis of logwood combustion emission. Concerning the coating, Lee et al. (Citation2015) observed that only 28% of the small particles measured in Toronto were thinly coated by HOA, and that 90% of the HOA-rich particles did not contain detectable amounts of rBC. Regarding engine emissions, Timko et al. (Citation2014) utilized PMF for analyzing AMS data from aircraft engines. They were able to identify six factors of which two were related to lubricating oil, two were aliphatic factors, and additionally there was an aromatic factor and a siloxane factor.
In this study, we demonstrate the separation of fuel and lubricating oil fragments from diesel engine exhaust emissions in laboratory conditions by applying PMF method on the data measured by the SP-AMS. This approach combines the advantage of the SP-AMS to measure non-refractory and refractory species with the well-known statistical data analysis method. Two different PMF analyses approaches were tested. In the first analysis mass spectra of refractory species, i.e., metals and rBC, were included in mass spectra of organics whereas in the second analysis only mass spectra of non-refractory organics were utilized. In addition, the results from the PMF analysis are compared with particle size distribution, volatility and morphology.
2. Material and methods
2.1. Measurement setup
The measurements were performed in the emission laboratory of Wärtsilä Finland Oy in 2011. The tested engine was a medium speed diesel engine (W6L20L; Output 880 kW) deployed typically for locomotive use and the fuel used was ultra-low sulfur (8 ppm) diesel fuel. Six engine power conditions spanning highest power (notch 8) to lowest power (notch 0), including high power with low load (8 0%, according to locomotive engine performance testing; ) were measured in two consecutive days. The Notch value corresponds to a certain engine operating point (RPM and load). In normal engine operation, with increasing notch value both RPM and load increases. In addition to the normal operation points the point notch 8 0% was added, which corresponds to the RPM value of notch 8 (1000 RPM) but it is run without any external load. After each operating point, the new engine parameters were set and engine was let to run in order to stabilize it prior to starting the next measurement point. The RPM and load values corresponding to each notch value can be found in . There was a minor modification in the engine configuration after the first test day and therefore day 1 and day 2 were kept separate when analyzing and presenting the results. Each power condition was tested for approximately 30 min. The engine exhaust was sampled using partial sampling with two-stage dilution, Figure S1. The primary diluter was situated in the exhaust transfer tube. It had an axial design so that the dilution air was led to the sampling point in the outer part of the sampling probe simultaneously reaching the exhaust temperature, and after the sampling and dilution point at the top of the sampling probe, the diluted air was led to the secondary diluter through the inner part of the probe. Nearly similar sampling method has been used, e.g., in coal-combustion studies made by Mylläri et al. (Citation2017). The secondary diluter was an ejector type diluter operating with a constant dilution ratio of 8, and it decreased the sample temperature and concentrations into the measurement range of instruments. The sampling design was chosen to suppress the formation of nanoparticles in sampling system and thus to maximize the yield of semivolatile compounds to larger particle sizes. The final dilution ratios were calculated from CO2 and NOx concentrations before and after the dilution.
Table 1. Tested engine power conditions, and the average concentrations of Organics (Org) and rBC, the average contributions of LOA1, LOA2, DFA1 and DFAs (% of organic + rBC + elements) and the elemental ratios of OM:OC, H:C and O:C in each point at two test days.
2.2. Instruments
A Soot Particle Aerosol Mass Spectrometer (Aerodyne Research Inc., USA; Onasch et al. Citation2012) was used to measure the chemical composition of diesel particles. The operation of the SP-AMS is introduced elsewhere (Onasch et al. Citation2012) and therefore only a short description is given here. The aerodynamic lens in the SP-AMS leads particles to the instrument and vacuum chambers to enable transmission of particles to the vaporizer. The SP-AMS has a dual vaporizer system, with an intracavity Nd:YAG laser vaporizer (1064 nm) in addition to standard tungsten vaporizer. Tungsten vaporizer (600 °C) enables detection of non-refractory particulate PM (typically organics, sulfate, nitrate, ammonium and chloride) while the laser enables vaporization of refractory particles, specifically laser-light absorbing refractory black carbon (rBC) particles that are not detected in the standard AMS without the laser. The laser vaporizer does not interfere with the tungsten vaporizer or generate chemical ions. Therefore, the SP-AMS instrument can be operated with the laser vaporizer alone, with both the laser and tungsten vaporizers, or only with the tungsten vaporizer. In this study the SP-AMS was operated with both the vaporizers. The laser was modulated on and off in order to measure rBC and associated particulate material (e.g., metals and their salts) in addition to the standard AMS non-refractory particulate species. Vaporized compounds were ionized with electron ionization (70 eV) and ions were analyzed by time-of-flight chamber (V-mode) and multichannel plate detector. Acquisition mode was also switched between Particle-Time-of-Flight (pToF; size distributions PM < 1 µm, with 100% lens transmission in the size range of 60–600 nm, Liu et al. Citation2007) and MS (mass concentration without particle size information) mode every other minute. The collection efficiency used was 1, meaning that 100% of particles were assumed to be captured and measured by this instrument. Because the low-sulfur content, very small amounts of sulfates and nitrates were found in the composition of the fine PM. In addition, the relative humidity (RH) in the line was kept under 80%. For those reasons, no CE composition-dependence correction (Middlebrook et al. Citation2012) was needed to the data.
C1+ ion was quantified as suggested by the literature (Onasch et al. Citation2012). The relative ionization efficiencies (RIE) for the trace elements Ca, Zn, Sr and Ba were taken from the previous studies (Carbone et al. Citation2015), and the RIE value for rBC was obtained through mass calibration with the Regal black (RIE = 0.2). Because, the RIE of P was not available, this RIE was obtained from the literature (Freund et al. Citation1990). Due to mass-to-charge (m/z) overlap, Ca and Zn mass loadings were estimated based on the isotopic abundances of Ca42 and Zn68, respectively, similar to proposed by Carbone et al. (Citation2015). For the PMF matrices, only the isotopes Ca42 and Zn68 were used.
The elemental ratios H:C, O:C and OM:OC were calculated for the organic fraction using the analytic procedure for elemental separation (APES, Aiken et al. Citation2007), version 1.06, further improved with calibration factors (Canagaratna et al. Citation2015). A slight difference in the calibration factors is possible due to the different vaporization scheme as in this study the laser and tungsten vaporizer were utilized.
Two Scanning Mobility Particle Sizers (SMPS) were used to measure the number size distribution of exhaust particles. In the SMPS, a Differential Mobility Analyzer (DMA) classifies particles according to their electrical mobility by scanning the voltage and allowing only a narrow particle size range to penetrate the DMA after which the number of particles is subsequently detected by a Condensation Particle Counter (CPC). One SMPS (hereafter called Nano-SMPS) was equipped with DMA model 3085 (TSI Inc.) and CPC model 3025 (TSI Inc.) and the other SMPS (hereafter called long-SMPS) with DMA model 3081 (TSI Inc.) and CPC model 3010 (TSI Inc.). The Nano-SMPS was used to measure particles in a size range of 3–64 nm (in mobility diameter) and the long-SMPS in a range of 14.6–661 nm.
Exhaust particle volatility was investigated by using a thermodenuder (TD). In the TD the diluted sample was first heated to 265 °C and after that led into the denuder part where active charcoal collected evaporated compounds (Rönkkö et al. Citation2011). The mean residence time in the heated TD was approximately 1 s, but it should be noted that it depends on the temperature settings; lower temperature leads to longer residence time. In Rönkkö et al. (Citation2011), the evaporation of sulfuric acid particles with particulate mass loading of 4.2 ng/s was studied, resulting to the complete evaporation of particles relatively close to the inlet of the TD. However, regarding the organic material the situation is different since the organic compounds have large spectrum of volatilities. It can be expected that some organic compounds have volatilities lower than it is for sulfuric acid, and, e.g., EL-VOCs, if present in the exhaust, are not completely evaporated from particles (see, e.g., Alanen et al. Citation2017). The size distributions measured after the TD were corrected for the solid particle losses in TD (see Figure 2 in Heikkilä et al. Citation2009).
Additionally, particle samples were collected on holey-carbon grids (Agar Scientific) from the engine exhaust in order to get insight to particle morphology. Particles were collected during notch 4 onto the grids from the diluted exhaust sample by a flow-through sampler with 1 l/min flow and after that, analyzed using a transmission electron microscopy (TEM). Two samples were chosen for energy dispersive spectrometry (EDS) analysis to get information on elemental composition of particles. It should be noted that the presented samples were not collected simultaneously with other data, thus they can only be used qualitatively when interpreting other results.
2.3. Positive matrix factorization (PMF)
In order to investigate the sources and/or characteristics of chemical species found in exhaust particles, the SP-AMS data was analyzed by using the Positive Matrix Factorization (PMF, Paatero and Tapper CitationCitation1994) through the graphical user interface Source Finder (SoFi, Canonaco et al. Citation2013) within the software package Igor Pro (Wavemetrics, Inc., Portland, OR, USA). PMF is a multivariate factor analysis tool that decomposes a sample data matrix into two or more matrices with varying factor contributions (in this data the concentration at given time) and constant factor profiles (in this data the mass spectrum representing certain similar chemical composition or source). One feature in using SoFi is that the user can constrain the factors, however, this technique was not adopted here, so the factors were fully unconstrained.
Two different PMF analyses were tested. In the first analysis MS collected with both the tungsten and laser vaporizers were analyzed whereas in the second analysis MS obtained only with the tungsten vaporizer were utilized. In both cases the input matrices consisted of the mass concentrations of organics, rBC and trace metals, and the respective uncertainties or errors, all in µg m−3. However, in the second configuration the signals corresponding to rBC and most of the trace metals were negligible (refractory material), since they require more than the tungsten vaporizer temperature (600 °C) to evaporate. The PMF input matrices, where rows represent time series and the columns different ion mass-to-charge ratios, consisted of 203 different measurements of mass spectra (each containing 170 ions). A pretreatment of the input matrices was recommended in previous publication (Ulbrich et al. Citation2008) and this procedure was followed here. The periods when the thermodenuder was on were used inside the matrices to generate the PMF solution.
This article focuses on the PMF results obtained with both tungsten and laser vaporizer, and therefore the PMF results obtained only with tungsten vaporizer are discussed solely in Section 3.2.3.
3. Results and discussions
3.1. Characterization of diesel engine exhaust particles
3.1.1. Chemical composition
The chemical composition of diesel engine exhaust particles measured with the SP-AMS is depicted in . On average particle mass was split between organics (∼51%) and rBC (∼48%) their relative fractions depending on engine conditions. The sum of inorganic species, sulfate, nitrate and trace metals, represented less than 1% of the total PM1 mass.
Figure 1. Average chemical composition of diesel engine exhaust particles (others = sum of inorganic species + metals) (a), and inorganic species and metals (=others left side figure) (b) for each engine power condition (notch 8, notch 6, notch 4, notch 2, notch 0 and notch 8 with 0% load; ) for the two measurement days measured with the SP-AMS.
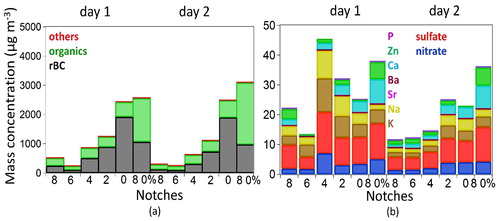
With respect to different notches, the most abundant compounds (organics and rBC) decreased in mass concentration as the notches increased from 0 to 8, Figure S3. However, the organic to rBC ratio clearly increased for the higher notches, indicating better engine operational conditions at the notches 6–8, with less emission of rBC mass concentration. These findings differ from previous studies where the EC fraction increases and OC fraction decreases with the engine load (Shi et al. Citation2000). At the notch 8 0% much higher mass concentrations were achieved as typical of this point, however, the organics were still dominant, with the largest organic to rBC ratio (1.9).
Organics presented a typical hydrocarbon-like mass spectrum where the main fragments were C3H5+, C3H7+, C4H7+, C4H9+, C5H7+, C5H9+, C5H11+, C6H9+, C6H11+, C6H13+, C7H11+, C7H13+ (m/z’s 41.039, 43.055, 55.055, 57.070, 67.055, 69.070, 71.086, 81.070, 83.086, 85.102, 95.086, 97.102, respectively; Figure S4). These hydrocarbon fragments represented on average 50% of organics, however, the other half was also mostly composed of hydrocarbons, followed by a small amount of oxygenated (C2H3O+, CO2+) and nitrogen-containing (CHN+) fragments.
Due to the large amount of hydrocarbons, the observed hydrogen to carbon ratio (H:C) of organic fraction ranged from 1.70 to 2.08 (average 1.94 ± 0.1, ). Similar H:C values have been observed for PM associated to traffic sources (e.g., Carbone et al. Citation2014; Timonen et al. Citation2013). In terms of oxidation the aerosol presented low to moderate degree of oxidation, i.e., the oxygen to carbon ratio (O:C) ranged from 0.03 to 0.42 (average 0.19 ± 0.09). Organic matter to organic carbon ratio (OM:OC) ranged from 1.22 to 1.77 (average 1.42 ± 0.1), which was similar to strongly traffic-impacted sites. For example, Brown et al. (Brown et al. Citation2013) found average OM:OC to be 1.54 ± 0.20 in ambient measurements close to a major roadway. Average OM:OC of 1.88 was found near a high-diesel-impacted highway (DeWitt et al. Citation2015). Thus, the results obtained in this emission study are consistent with low to moderate oxidized aerosol, typical for fresh combustion fuel emissions.
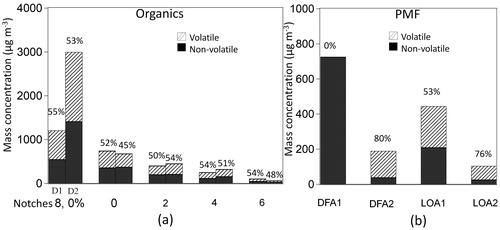
Half of organics measured by the SP-AMS seemed to present a more volatile character. On average, a reduction of 50% of the organic fraction was observed during the periods when the thermodenuder was on, however, there was no significant difference in the volatility between the notches ().
Figure 2. Average mass concentrations of volatile (diagonal filling) and nonvolatile (solid) organics for each notch in day 1 (D1) and day 2 (D2) (a), and TD on (volatile, diagonal filling) and TD off (nonvolatile, solid) PMF factors (organics, rBC, metals) for the day 1 (b). The numbers on the top of the bars represent the reduction in mass due to the thermodenuder (at 265 °C).
The elevated rBC mass loadings are a typical product of incomplete combustion of diesel fuel emissions (Tiwari et al. Citation2016; Toner et al. Citation2006). In this study, the rBC mass fraction was the highest when the engine was operated at low power conditions (0–125 kW; notches 2, 0 and 8 0%; ). The generation of rBC is tightly related to factors, such as in-cylinder temperature and poor air mixing ratio (Pignon Citation2005). Refractory BC was composed of carbon fragments with one to 9 carbons (called hereafter C1–C9). The largest signal was obtained for C3 followed by C1 and C2. The C1–C9 pattern was similar for all notches. However, the fullerenes (a C series around C60+, m/z 720, Figure S4) were observed only for the 0–2 and 8 0% notches. Using the C60+ as a surrogate for fullerenes, the highest fraction was found at the notch 8 0%, followed by the notches 0 and 2.
The contribution of inorganic ions and metals was low (<1%) in all measured conditions (). The observed low sulfate content in particle phase is due to the reduced amount of sulfur in the fuel, which was also confirmed by the fuel laboratory analyses (S < 0.05% m/m). Due to the extreme low concentrations of ammonium in the measured aerosol, sulfate was likely in the form of sulfuric acid or metal-sulfate salts. Regarding sulfate salts, the fragments KSO+, KSO2+, CaS+, CaSO2+, CaSO3+ were identified in the mass spectrum (Figure S5) with the laser vaporizer. In addition to calcium and potassium, the trace amount of the elements Na, P, Zn, Sr and Ba were identified by the SP-AMS (). However, the trace elements fraction was dominated by Ca (∼0.28% in PM1).
3.1.2. Physical properties
Number size distribution of exhaust particles was investigated by using nano- and long-SMPS. The number size distribution for diesel engine exhaust particles consisted generally of three partially overlapping modes. There was a mode at very small particle sizes (3–5 nm, later called as particle mode 1), another mode between 5 nm and 30 nm (later called as particle mode 2) and the third mode between 30 nm and 660 nm (later called as particle mode 3; ).
Figure 3. Particle number size distributions (a) and particle volume size distributions (b) at notch 2 measured with Nano-SMPS and Long-SMPS. Size distributions measured with the thermodenuder are indicated by “dry” and without the thermodenuder by “all.” Examples of individual particles analyzed with TEM and EDS (c–e).
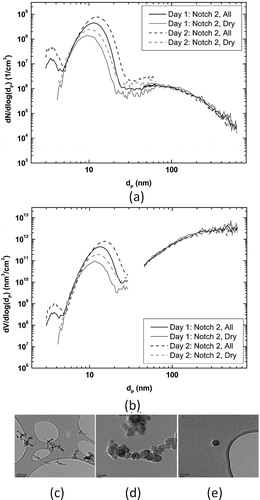
Particle mode 1 consisted of very volatile compounds suggested by the TD measurement that eliminated totally the smallest particles. It seems that mode 1 particles were formed in sampling system during the cooling and dilution of exhaust sample, similar to the other diesel engine exhaust studies (Vaaraslahti et al. Citation2005; Kittelson Citation1998).
The particle mode 2 clearly dominated the total particle number; compared, e.g., to the particle mode 3 its number concentration was even 2–3 orders of magnitude higher. TD treatment affected the particle mode 2 by diminishing its mean particle size few nanometers and by decreasing its concentration, however, the particle mode 2 still existed in particle size distribution and kept its dominating role in total particle number. The largest change in the mode 2 due to the TD was observed for notch 4 whereas for notch 1 there was only a small difference between the TD on and off (Figure S6). In general the results showed that the particles in the particle mode 2 consisted of some amount of semi-volatile material but also of nonvolatile compounds.
Particle mode 3 represents soot mode typical for all diesel engines without filtration in tailpipe system. The TD did not affect the particle mode 3 significantly. However, it should be kept in mind that the SMPS measures the mobility particle size distribution of exhaust particles. Soot particles are typically carbonaceous agglomerates formed in combustion process and their complicated fractal-like structure allows the evaporation of semi-volatile compounds from the particles without change in mobility size (Sorensen Citation2001). Thus, the reduction of organics in the SP-AMS due to the TD was clearly related to the changes in the mode 2 but likely also to the changes in the mode 3.
All three modes observed in number size distributions can be seen also in volume size distributions (). However, the relative contributions of modes are significantly different for particle volume (and thus also for mass). The particle mode 3 clearly dominates the volume size distribution with smaller contribution of the particle mode 2. Particle number size distributions for all engine power conditions are given in the online supplementary information (SI; Figure S6).
TEM and EDS analyses show that the collected particles in different size modes had different morphologies (). Soot particles () with agglomerated fractal-like morphology were observed. These particles had large size range varying from approximately 100 nm to several hundred nanometers. Additionally, the grids contained large amounts of small, approximately 10 nm spherical particles, which were difficult to distinguish from TEM grids (, contrast compared to grid was low). Also clearly distinguishable spherical particles existed on the grids (). The EDS analyses indicated that these spherical particles contained zinc, sulfur, calcium and oxygen.
3.2. Separation of lubricating oil and diesel fuel contribution in particulate emission
Sources and characteristics of chemical species found in exhaust particles were investigated by analyzing the SP-AMS data with the PMF. PMF solutions from two to five factors were examined. PMF solution with only two factors separated clearly the emissions originated from lubricating oil (called hereafter lubricating oil-like aerosol, LOA) and fuel (called hereafter diesel like-fuel aerosol, DFA). In the MS of LOA, long chain alkanes and cycloalkanes fragments are found, similar to Canagaratna et al. (Citation2004). In contrast, in the MS of DFA fragments have a series of n-alkanes similar to diesel MS as well as clear correlation with rBC (Dallmann et al. Citation2014; Canagaratna et al. Citation2004). For the data collected only with the tungsten vaporizer, the PMF solution with two factors was most reasonable. However, for the data collected with both tungsten and laser vaporizer four factor solution was found to provide more information than two factor solution. In four factor solution, two of the PMF factors were interpreted to be related to lubricating oil-like aerosol (LOA1 and LOA2) and other two to diesel-like fuel aerosol (DFA1 and DFA2). The four factor solution was chosen here for the further analysis, .
Figure 4. HR mass spectra (left) and time series (right) of the four factors LOA1, LOA2, DFA1 and DFA2 obtained with the SP-AMS using PMF analysis and both vaporizers embedded.
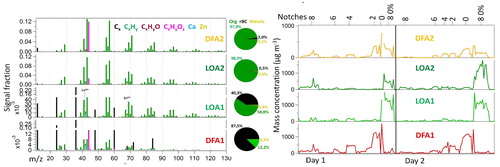
represents the average contributions of LOA1, LOA2, DFA1 and DFA2 (% of organic + rBC + elements) for each measurement point. On average, LOA1 and LOA2 presented rather similar contributions to the measured mass (29 and 24%, respectively) whereas DFA1 had significantly larger contribution (35%) than DFA2 (12%). The total contribution of lubricating oil obtained in this study (53% of mass) is slightly larger than that of fuel (47%). However LOA importance in mass fraction enhances from the lower (8%, notch 0) to higher (67%, notch 6) notches, Figure S3, with larger contribution at the notch 8 0% (LOA = 89%).
Regarding the notches it was possible to observe that although the rBC and organic mass concentrations decrease as the notches increase, the individual PMF factors responded differently. For instance, DFAs mass concentration clearly decreases as the notches increase, while the LOAs were rather stable, especially the LOA2. In addition, the LOAs were dominant at the notch 8 0%. It is important to note that the particle size distributions were different at the notch 8 0% and 0. In notch 0 there was a dominant mode 2 between ∼10–20 nm whereas mode 1 was very small (Figure S5). Similarly in notch 8 0%, mode 1 was small, however, there were two modes for the size range of mode 2. First mode had a maximum at ∼10 nm while the second mode peaked at ∼20 nm. Mode 3 had a larger maximum concentration for notch 8 0% but the mode was located at larger particle size for notch 0. The SP-AMS measures particles with 100% lens transmission in the size range of 60–600 nm in vacuum aerodynamic diameter. Therefore the SP-AMS results are mostly affected by the behavior of particle mode 3, however, the changes in the mode 2 can also partially be seen in the SP-AMS results.
3.2.1 Chemical characterization of diesel-fuel like aerosol (DFA)
The DFA factors present organic MS with the series of n-alkanes being very similar to that of diesel fuel. The following fragments of saturated alkanes are the most pronounced in the diesel fuel and the DFA factors mass spectra C4H9+ (57.070), C5H11+ (71.086), C6H13+ (85.102) and C7H13+ (97.102) (Canagaratna et al. Citation2004; Tobias et al. Citation2001), where the numbers in parenthesis represent the exact mass-to-charge ratios of the respective fragments.
DFA differed from LOA especially for the signal intensity of the fragments C5H7+ (67.055), C5H9+ (69.07), C5H11+ (71.086), C6H9+ (81.07), C6H11+ (83.086), C6H13+ (85.102), C7H11+ (95.086) and C7H13+ (97.102), of which C5H9+ (69.07) signal is smaller than C5H11+ (71.086), and C6H11+ (83.086) is smaller than C6H13+ (85.102) for LOA. That applies for both DFA1 and DFA2 factors.
Both DFA factors presented excellent correlation with rBC (Pearson correlation, R = 0.84 and 0.93 for DFA1 and DFA2). These results are in line with the literature, which indicates that most of the soot is expected to be related to the incomplete combustion process of fuel especially in lower engine power conditions (Karjalainen et al. Citation2016). However, DFA1 and DFA2 differed in rBC contribution and mass spectra. DFA1 had large mass faction of rBC (88%) with the dominant fragments of C3+ (m/z 36), followed by C2+, C1+, C5+, C4+, C7+ and C6+ (m/z’s 24, 12, 60, 48, 84 and 72) and respective isotopes, with C1+ to C3+ ratio value defined as described by previous studies (0.63, Carbone et al. Citation2015; Onasch et al. Citation2012). In addition, the fullerenes correlated with the DFA1 factor (Pearson correlation, R = 0.91) (see the average MS in Figure S4). Fullerenes are very relevant in toxicology and nanomaterials studies (Baker et al. Citation2008) and they are often observed in diesel exhaust emissions (Tiwari et al. Citation2016; Su and Mu Citation2004). In addition, the oxidized soot fragments C2O+ (39.995), C3O+ (51.995) and C3O2+ (67.989) were observed in DFA1 factor. They originated most likely from the oxidation of C2+ and C3+ rBC fragments. Oxidized soot fragments presented a good agreement with rBC and they were only present when the laser was on, indicating their refractory nature. The presence of CO2+ in this factor suggests that this fragment could be due to oxidation of C+ from rBC, instead of decomposition of organic dicarboxylic acids, which is typical in ambient datasets. The DFA1 contained also small amount of Ca (0.03%). Laboratory analyses of fuel indicated that the Ca content of fuel was low (<11 mg/Kg).
DFA2 had very low concentrations of rBC (∼2%) but similar hydrocarbon pattern to the DFA1 factor. The presence of hydrocarbon fragments and absence of rBC suggests that DFA2 could be related to unburned fuel, i.e., diesel that came from the engine without burning. The MS of DFA2 had a prominent signal for CO2+ (11% of the DFA2 mass concentration) representing the most oxidized fuel fraction. DFA2 factor also showed a good agreement with sulfate (Pearson correlation, R = 0.85), probably related to the sulfur content in the fuel.
DFA1 and DFA2 had clearly different volatilities. DFA1 factor, that was mostly comprised of soot, had no change in the mass when the TD was added indicating that DFA1 was totally nonvolatile (). In contrast, the low soot content in the DFA2 factor was the main responsible for its large volatility character (80%). In addition, the latter factor presented larger H:C (2.0) and smaller O:C (0.1) ratio values than the DFA1 (H:C = 1.5 and O:C = 0.3).
3.2.2 Chemical characterization of lubricating oil-like aerosol (LOA)
LOA1 and LOA2 had similar mass spectrum to lubricating oil (Canagaratna et al. Citation2004; Tobias et al. Citation2001) that has long chain alkanes and cycloalkanes fragments in its mass spectrum. Different from DFAs, in the LOA factors the C5H9+ (69.07), C6H11+ (83.086) fragments were prominent. The LOA hydrocarbon-like character was also confirmed by elevated H:C (LOA1 = 1.96 and LOA2 = 1.97) and low O:C (LOA1 = 0.01 and LOA2 = 0.02) ratio values. The MS of LOA1 contained significant amount of rBC fragments rBC representing 40% of the total mass of LOA1 (). The presence of rBC in this factor is likely due to the condensation of lubricating oil originated compounds onto the surfaces of soot particles. The condensation could occur due to exhaust temperature decrease in the tailpipe or in the sampling system. In addition to rBC, some trace elements were present in LOA1, such as Ca (0.06% of mass) and Zn (0.03% of mass). This factor also showed good agreement with P (Pearson correlation, R = 0.85). Ca, Zn and P are well-known constituents, of lubricating oils (Jung et al. Citation2003). Moreover, there was a modest agreement between LOA1 and sulfate (R = 0.73) and LOA1 and CaS+ fragment (R = 0.74) explained by calcium sulfonate that is an additive used in lubricating oils.
LOA2 was dominated by organics and was slightly more oxidized than LOA1 with a notable CO2+ signal (2.5% of mass). Similar to LOA1, LOA2 also contained trace metals, however, there was less Ca (0.01% of mass) and more Zn (0.04% of mass) in LOA2 than in LOA1. Different from LOA1, there was no significant agreement between LOA2 and P or sulfate. Since the rBC fragments were not found in the MS of LOA2, this factor could represent unburned lubricating oil originated particles formed, e.g., during such phases of combustion cycles when the fuel burning and related soot formation does not take place in the cylinder (Karjalainen et al. Citation2016). In this study, the detection of non-soot containing particles by the SP-AMS was possible because the tungsten vaporizer was embedded.
In terms of volatility character, the LOA2 was more volatile than LOA1 (76 and 53%, respectively; ) that can be explained by the larger fraction of rBC in LOA1. The LOA2 volatility was comparable to that observed for the DFA2 (80%), probably because both factors presented similar soot content.
Also the TEM/EDS analyses performed for the individual particles indicated the presence of lubricating oil particles. Zn, S, Ca and O were found in clearly distinguishable spherical particles that most likely originated from lubricating oil. Based on TEM analysis, the morphology of these particles significantly differed from soot that is typically seen as agglomerated structures on TEM grids.
3.2.3 Separation of LOA and DFA from the data measured only with tungsten vaporizer
In order to investigate the effect of trace elements and rBC on PMF solution, PMF analysis was also applied to the data collected only with the tungsten vaporizer. For the tungsten vaporizer, the input matrices consisted of the same variables (m/z’s) as for dual vaporizer system, however, the observed refractory fragments (rBC, metals) were close to zero. For the data obtained with only tungsten vaporizer two main factors were identified, one related to lubricating oil and another to diesel fuel. These factors are named here as LOAT and DFAT, T in subscript referring to tungsten vaporizer (Figure S2).
For the comparison with the PMF results obtained with both laser and tungsten vaporizer described in the previous section, the LOA1, LOA2, DFA1 and DFA2 were grouped into two factors LOAL+T =(LOA1 + LOA2) and DFAL+T =(DFA1 + DFA2), where L + T is referring to the dual vaporizer system with laser and tungsten vaporizers. The time series of LOAT and LOAL+T and DFAT and DFAL+T were very similar (R = 0.95 and 0.93, respectively), and also the mass spectra of hydrocarbon fragments were similar (R = 0.98 and 0.92 for LOAT/LOAL+T and DFAT/DFAL+T, respectively; Figure S2). However, some difference were found in the mass fractions of DFA and LOA. With the dual vaporizer, the fraction of organics originating from lubricating oil (LOAL+T) was slightly smaller (71%) than that obtained with the tungsten vaporizer (LOAT; 79%).
3.2.4 Comparison with ambient HOA
In the ambient studies hydrocarbon-like organic aerosol (HOA) is often considered to be strongly related to vehicular emissions (e.g., Carbone et al. Citation2014; Timonen et al. Citation2013; Lanz et al. Citation2010). In situations when heavy-duty vehicles dominate, the combination of LOA and DFA factors obtained in this study could have resemblance to the ambient HOA. However, it is important to take into account that LOA and DFA found in this study represent fresh, unprocessed emissions, while the ambient HOA might have also other sources than traffic (e.g., biomass burning, cooking) and it is likely processed in the atmosphere to some degree (Chirico et al. Citation2010). For example, the emissions from a high-diesel-impacted road measured with an AMS in Grenoble, France (DeWitt et al. Citation2015) presented an HOA with larger C4H7+ than C4H9+, which is opposite to this study, and several oxidized fragments (CHO+, C2H3O+, C3HO+, C4H3O+, C4H5O+, C4H7O+). However, similar to us their HOA had elevated H:C value.
Bus emission measurements conducted in Helsinki for the Euro III type of emission level using the SP-AMS (Saarikoski et al. Citation2016), with both vaporizers embedded, show very similar hydrocarbon and rBC pattern with the factors obtained in this study, especially for the factors dominated by organics, LOA1, LOA2 and DFA2 (Figure S7). For example, the comparison for CH fragments between the Euro III type of emissions and the LOA1, LOA2 and DFA2 factors presented Pearson correlations of 0.98, 0.98 and 0.97, respectively.
The HOA reported in ambient studies is most likely a combination of the 4 PMF factors found in this study. However, in addition to lubricating oils and diesel fuel (both burned and unburned), the ambient HOA also contains gasoline fuel (burned and unburned). The presence of gasoline as a fuel implies the presence of more branched alkanes in the mass spectra (Gentner et al. Citation2012), mostly because of the gasoline octane rating.
4. Summary and conclusions
This study showed that PMF combined with detailed chemical composition analysis provides a powerful tool for separating emissions initially originated from fuel and lubricating oil. On average, diesel fuel and lubricating oil produced similar amount of PM, however, diesel fuel produced slightly more rBC and less organics than lubricating oil. Both diesel fuel and lubricating oil related exhaust emissions include burned and unburned fractions. The volatilities of burned and unburned fractions were different as the volatility was mostly associated with the contribution of rBC and hydrocarbon fragment type.
The relative impact of burned and unburned diesel fuel and lubricating oil depended strongly on engine loading conditions (notches). The influence of both burned and unburned diesel fuel was larger for smaller notches (0–4 and 8 0%). The contribution of lubricating oil was rather stable over the notches, in mass concentration, except for the notch 8 0%, at which the lubricating oil contribution was the highest.
The diesel fuel and lubricating oil mass spectra obtained in this study are similar to those measured by on-road vehicles (Saarikoski et al. Citation2017; Canagaratna et al. Citation2004; Tobias et al. Citation2001). In this study a medium size diesel engine was deployed (for locomotive application), although this type of engine differs in terms of operation conditions to on-road engines, both depend on fuel, lubricating oil and additives to operate. This is why similar results, i.e., distinction between fuel and lubricating oil in PM exhaust, could be achieved by experiments conducted for other diesel engines, using same method as proposed by the current study. In fact, it was found that the separation between the two distinct particle sources in combustion engine (fuel and lubricating oil) can also be achieved by an HR-AMS without the laser, however, the inclusion of metals and rBC to PMF (using the SP-AMS) enabled the separation and identification of the different fractions of diesel fuel and lubricating oil; burned and unburned fractions.
Results from studies performed using on-road diesel vehicles, suggest that most of the soot come from the diesel fuel, instead of the lubricating oil (Kleeman et al. Citation2008), which is similar to what was found in this study. Conversely, the highest soot contribution took place under the lowest operation conditions in this study. In addition, the organic fraction measured here was larger for the lubricating oil factors, whereas OC was evenly apportioned between fuel and lubricating oil on heavy-duty vehicles (Kleeman et al. Citation2008).
Overall, the detailed data on chemical composition and physical properties, e.g., volatility and morphology of PM produced by diesel engine improves our understanding on burning and exhaust emission formation process. Information provided by this study will be beneficial for further studies including health, climate effect studies and it can be used in the development of improved emission reduction and exhaust aftertreatment systems.
Supplemental data for this article can be accessed on the publisher's website.
Download Zip (1.4 MB)Funding
The study was financially supported by Helsinki Energy; the Ministry of Traffic and Communications; TEKES in the CLEEN/MMEA program (WP4.5.2); the Graduate School in Physics, Chemistry, Biology and Meteorology of Atmospheric Composition and Climate Change (University of Helsinki); the Academy of Finland (grant no. 259016); and the Sao Paulo Research Foundation (FAPESP, grant no. 2014/05238-8).
Related Research Data
References
- Aiken, A. C., P. F. DeCarlo, J. L. Jimenez, and J. J. L. 2007. Elemental analysis of organic species with electron ionization high-resolution mass spectrometry. Anal. Chem. 79 (21):8350–8358. doi: 10.1021/ac071150w.
- Alanen, J., P. Simonen, S. Saarikoski, H. Timonen, O. Kangasniemi, E. Saukko, R. Hillamo, K. Lehtoranta, T. Murtonen, H. Vesala, J. Keskinen, and T. Rönkkö. 2017. Comparison of primary and secondary particle formation from natural gas engine exhaust and of their volatility characteristics. Atmos. Chem. Phys. 17 (14):8739–8755. doi: 10.5194/acp-17-8739-2017.
- Baker, G. L., A. Gupta, M. L. Clark, B. R. Valenzuela, L. M. Staska, S. J. Harbo, J. T. Pierce, and J. A. Dill. 2008. Inhalation toxicity and lung toxicokinetics of C60 fullerene nanoparticles and microparticles. Toxicol. Sci. 101 (1):122–131. doi: 10.1093/toxsci/kfm243.
- Brandenberger, S., M. Mohr, K. Grob, and H. P. Neukom. 2005. Contribution of unburned lubricating oil and diesel fuel to particulate emission from passenger cars. Atmos. Environ. 39 (37):6985–6994. doi: 10.1016/j.atmosenv.2005.07.042.
- Brown, S. G., T. Lee, P. T. Roberts, and J. L. Collett. Jr., 2013. Variations in the OM/OC ratio of urban organic aerosol next to a major roadway. J. Air Waste Manag. Assoc.. 63 (12):1422–1433.
- Canagaratna, M., J. L. Jimenez, J. H. Kroll, Q. Chen, S. H. Kessler, P. Massoli, L. Hildebrandt Ruiz, E. Fortner, L. R. Williams, K. R. Wilson, J. D. Surratt, N. M. Donahue, J. T. Jayne, and D. R. Worsnop. 2015. Elemental ratio measurements of organic compounds using aerosol mass spectrometry: Characterization, improved calibration, and implications. Atmos. Chem. Phys. 15 (1):253–272. doi: 10.5194/acp-15-253-2015.
- Canagaratna, M. R., J. T. Jayne, D. A Ghertner, S. Herndon, Q. Shi, J. L. Jimenez, P. J. Silva, P. Williams, T. Lanni, F. Drewnick, K. L. Demerjian, C. E. Kolb, and D. R. Worsnop. 2004. Chase studies of particulate emissions from in-use New York city vehicles. Aerosol Sci. Technol. 38 (6):555–573. doi: 10.1080/02786820490465504.
- Canonaco, F., M. Crippa, J. G. Slowik, U. Baltensperger, and A. S. H. Prévôt. 2013. SoFi, an IGOR-based interface for the efficient use of the generalized multilinear engine (ME-2) for the source apportionment: ME-2 application to aerosol mass spectrometer data. Atmos. Meas. Tech. 6 (12):3649–3661. doi: 10.5194/amt-6-3649-2013.
- Carbone, S., M. Aurela, K. Saarnio, S. Saarikoski, H. Timonen, A. Frey, D. Sueper, I. M. Ulbrich, J. L. Jimenez, M. Kulmala, D. R. Worsnop, and R. E. Hillamo. 2014. Wintertime aerosol chemistry in Sub-Arctic urban air. Aerosol Sci. Technol. 48 (3):313–323.
- Carbone, S., T. Onasch, S. Saarikoski, H. Timonen, K. Saarnio, D. Sueper, T. Rönkkö, L. Pirjola, A. Häyrinen, D. Worsnop, and R. Hillamo. 2015. Characterization of trace metals with the SP-AMS: detection and quantification. Atmos. Meas. Tech. 8 (11):4803–4815.
- Chirico, R., P. F. DeCarlo, M. F. Heringa, T. Tritscher, R. Richter, A. S. H. Prévôt, J. Dommen, E. Weingartner, G. Wehrle, M. Gysel, M. Laborde, and U. Baltensperger. 2010. Impact of aftertreatment devices on primary emissions and secondary organic aerosol formation potential from in-use diesel vehicles: results from smog chamber experiments. Atmos. Chem. Phys. 10 (23):11545–11563. doi: 10.5194/acp-10-11545-2010.
- Crippa, M., F. Canonaco, V. A. Lanz, M. Äijälä, J. D. Allan, S. Carbone, G. Capes, D. Ceburnis, M. Dall'Osto, D. A. Day, P. F. DeCarlo, M. Ehn, A. Eriksson, E. Freney, L. Hildebrandt Ruiz, R. Hillamo, J. L. Jimenez, H. Junninen, A. Kiendler-Scharr, A.-M. Kortelainen, M. Kulmala, A. Laaksonen, A. A. Mensah, C. Mohr, E. Nemitz, C. O'Dowd, J. Ovadnevaite, S. N. Pandis, T. Petäjä, L. Poulain, S. Saarikoski, K. Sellegri, E. Swietlicki, P. Tiitta, D. R. Worsnop, U. Baltensperger, and A. S. H. Prévôt. 2014. Organic aerosol components derived from 25 AMS data sets across Europe using a consistent ME-2 based source apportionment approach. Atmos. Chem. Phys. 14 (12):6159–6176. doi: 10.5194/acp-14-6159-2014.
- Dallman, T., and A. Menon. 2016. Technology pathways for diesel engines used in non-ROAD vehicles. Washington, DC: International Council on Clean Transportation (ICCT).
- Dallmann, T. R., T. B. Onasch, T. W. Kirchstetter, D. R. Worton, E. C. Fortner, S. C. Herndon, E. C. Wood, J. P. Franklin, D. R. Worsnop, A. H. Goldstein, and R. A. Harley. 2014. Characterization of particulate matter emissions from on-road gasoline and diesel vehicles using a soot particle aerosol mass spectrometer. Atmos. Chem. Phys. 14 (14):7585–7599. doi: 10.5194/acp-14-7585-2014.
- De Filippo, A., and M. M. Maricq. 2008. Diesel nucleation mode particles: Semivolatile or solid? Environ. Sci. Technol. 42 (21):7957–7962.
- DeWitt, H. L., S. Hellebust, B. Temime-Roussel, S. Ravier, L. Polo, V. Jacob, C. Buisson, A. Charron, M. André, A. Pasquier, J. L. Besombes, J. L. Jaffrezo, H. Wortham, and N. Marchand. 2015. Near-highway aerosol and gas-phase measurements in a high-diesel environment. Atmos. Chem. Phys. 15 (8):4373–4387.
- Freund, R. S., C. Robert, R. J. Shul, T. R. Hayes, T. Laboratories, and M. Hill. 1990. Cross-section measurements for electron-impact ionization of atomcs. Phys. Rev. A. 41 (7):7.
- Gentner, D. R., G. Isaacman, D. R. Worton, A. W. H. Chan, T. R. Dallmann, L. Davis, S. Liu, D. A. Day, L. M. Russell, K. R. Wilson, R. Weber, A. Guha, R. A. Harley, and A. H. Goldstein. 2012. Elucidating secondary organic aerosol from diesel and gasoline vehicles through detailed characterization of organic carbon emissions. Proc. Natl. Acad. Sci. U. S. A. 109 (45):18318–18323. doi: 10.1073/pnas.1212272109.
- Harris, S. J., and M. M. Maricq. 2001. Signature size distributions for diesel and gasoline engine exhaust particulate matter. J. Aerosol Sci. 32 (6):749–764. doi: 10.1016/S0021-8502(00)00111-7.
- Heikkilä, J., T. Rönkkö, T. Lähde, M. Lemmetty, A. Arffman, A. Virtanen, J. Keskinen, L. Pirjola, and D. Rothe. 2009. Effect of open channel filter on particle emissions of modern diesel engine. J. Air Waste Manag. Assoc. 59 (10):1148–1154. doi: 10.3155/1047-3289.59.10.1148.
- IARC - International Agency for Research on Cancer 2015. To Humans Outdoor Air Pollution.
- ICCT 2016. EUROPEAN STAGE V NON-ROAD EMISSION STANDARS.
- Jung, H., D. B. Kittelson, and M. R. Zachariah. 2003. The influence of engine lubricating oil on diesel nanoparticle emissions and kinetics of oxidation. SAE paper 2003–01-3179, SAE Technical Paper.
- Karjalainen, P., L. Ntziachristos, T. Murtonen, H. Wihersaari, P. Simonen, F. Mylläri, N.-O. Nylund, J. Keskinen, and T. Rönkkö. 2016. Heavy duty diesel exhaust particles during engine motoring formed by lube oil consumption. Environ. Sci. Technol. 50 (22):12504–12511. doi: 10.1021/acs.est.6b03284.
- Kittelson, D. B. 1998. Engines and nanoparticles. A Review. J. Aerosol Sci. 29 (5-6):575–588. doi: 10.1016/S0021-8502(97)10037-4.
- Kleeman, M. J., S. G. Riddle, M. A. Robert, and C. A. Jakober. 2008. Lubricating oil and fuel contributions to particulate matter emissions from light-duty gasoline and heavy-duty diesel vehicles. Environ. Sci. Technol. 42 (1):235–242. doi: 10.1021/es071054c.
- Lanz, V. A., A. S. H. Prévôt, M. R. Alfarra, S. Weimer, C. Mohr, P. F. DeCarlo, M. F. D. Gianini, C. Hueglin, J. Schneider, O. Favez, B. D'Anna, C. George, and U. Baltensperger. 2010. Characterization of aerosol chemical composition with aerosol mass spectrometry in Central Europe: an overview. Atmos. Chem. Phys. 10 (21):10453–10471. doi: 10.5194/acp-10-10453-2010.
- Lee, A. K. Y., M. D. Willis, R. M. Healy, T. B. Onasch, and J. P. D. Abbatt. 2015. Mixing state of carbonaceous aerosol in an urban environment: single particle characterization using the soot particle aerosol mass spectrometer (SP-AMS). Atmos. Chem. Phys. 15 (8):1823–1841. doi: 10.5194/acp-15-1823-2015.
- Liu, P. S. K., R. Deng, K. A Smith, L. R. Williams, J. T. Jayne, M. R. Canagaratna, K. Moore, T. B. Onasch, D. R. Worsnop, and T. Deshler. 2007. Transmission efficiency of an aerodynamic focusing lens system: Comparison of model calculations and laboratory measurements for the aerodyne aerosol mass spectrometer. Aerosol Sci. Technol. 41 (8):721–733. doi: 10.1080/02786820701422278.
- Maricq, M. 2007. Chemical characterization of particulate emissions from diesel engines: A review. J. Aerosol Sci. 38 (11):1079–1118. doi: 10.1016/j.jaerosci.2007.08.001.
- MECA 2009. Case studies of the use of exhaust emission controls on locomotives. Washington, DC: Manufacturers of Emission Controls Association (MECA).
- Middlebrook, A. M., R. Bahreini, J. L. Jimenez, and M. R. Canagaratna. 2012. Evaluation of Composition-Dependent collection efficiencies for the aerodyne aerosol mass spectrometer using field data. Aerosol Sci. Technol. 46 (3):258–271. doi: 10.1080/02786826.2011.620041.
- Mylläri, F., P. Karjalainen, R. Taipale, P. Aalto, A. Häyrinen, J. Rautiainen, L. Pirjola, R. Hillamo, J. Keskinen, and T. Rönkkö. 2017. Physical and chemical characteristics of flue-gas particles in a large pulverized fuel-fired power plant boiler during co-combustion of coal and wood pellets. Combust. Flame. 176 :554–566. doi: 10.1016/j.combustflame.2016.10.027.
- Ng, N. L., M. R. Canagaratna, Q. Zhang, J.L. Jimenez, J. Tian, I. M. Ulbrich, J. H. Kroll, K. S. Docherty, P. S. Chhabra, R. Bahreini, S. M. Murphy, J. H. Seinfeld, L. Hildebrandt, N. M. Donahue, P. F. DeCarlo, V. A. Lanz, A. S. H. Prévôt, E. Dinar, Y. Rudich, D. R. Worsnop. 2010. Organic aerosol components observed in Northern Hemispheric datasets from Aerosol Mass Spectrometry. Atmos. Chem. Phys. 10 (10):4625–4641. doi: 10.5194/acp-10-4625-2010.
- Onasch, T. B., A Trimborn, E. C. Fortner, J. T. Jayne, G. L. Kok, L. R. Williams, P. Davidovits, and D. R. Worsnop. 2012. Soot particle aerosol mass spectrometer: Development, Validation, and initial application. Aerosol Sci. Technol. 46 (7):804–817. doi: 10.1080/02786826.2012.663948.
- Paatero, P., and U. Tapper. 1994. Positive matrix factorization: A non-negative factor model with optimal utilization of er- ror estimates of data values. Environmetrics 5 :111–126. doi: 10.1002/env.3170050203.
- Park, D., Y. Yoon, S. B. Kwon, W. Jeong, Y. Cho, and K. Lee. 2012. The effects of operating conditions on particulate matter exhaust from diesel locomotive engines. Sci. Total Environ. 419 :76–80. doi: 10.1016/j.scitotenv.2012.01.002.
- Pignon, J. 2005. Diesel engines: Design and emissions. Platin. Met. Rev. 49 (3):119–121. doi: 10.1595/147106705X58394.
- Ramanathan, V., and G. R. Carmichael. 2008. Global and regional climate changes due to black carbon. Nature Geosci. 1 (4):221–227. doi: 10.1038/ngeo156.
- Rönkkö, T., A. Arffman, P. Karjalainen, T. Lähde, L. Pirjola, D. Rothe, and J. Keskinen. 2011. Diesel exhaust nanoparticle volatility studies by a new thermodenuder with low solid nanoparticle losses. 15th ETH conference on Combustion generated nanoparticles. Zurich, p. 1. http://www.nanoparticles.ch/archive/2011_Roenkkoe_PR.pdf
- Rönkkö, T., A. Virtanen, A. Kannosto, J. Keskinen, J. Lappi, and L. Pirjola. 2007. Nucleation mode particles with a nonvolatile core in the exhaust of a heavy duty diesel vehicle. Environ. Sci. Technol. 41 (18):6384–6389.
- Saarikoski, S.,. H. Timonen, S. Carbone, H. Kuuluvainen, J. V. Niemi, A. Kousa, T. Rönkkö, D. Worsnop, R. Hillamo, and L. Pirjola. 2016. Investigating the chemical species in submicron particles emitted by city buses. Aerosol Sci. Technol. 51 (3):1–13.
- Saarikoski, S.,. H. Timonen, S. Carbone, H. Kuuluvainen, J. V. Niemi, A. Kousa, T. Rönkkö, D. Worsnop, R. Hillamo, L. Pirjola, H. Timonen, S. Carbone, H. Kuuluvainen, and J. V. Niemi. 2017. Investigating the chemical species in submicron particles emitted by city buses. Aerosol Sci. Technol. 51 (3):317–329. doi: 10.1080/02786826.2016.1261992.
- Shi, J. I. P., D. Mark, and R. O. Y. M. Harrison. 2000. Characterization of particles from a current technology Heavy-Duty diesel engine. Environ. Sci. Technol. 34 (5):748–755. doi: 10.1021/es990530z.
- Sorensen, C. M. 2001. Light scattering by fractal aggregates: A review. Aerosol Sci. Technol. 687 :648–687. doi: 10.1080/02786820117868.
- Su, D. S., and J. Mu. 2004. Fullerene-like soot from EuroIV diesel engine: consequences for catalytic automotive pollution control. Top. Catal. 2004 (July):241–245. doi: 10.1023/B:TOCA.0000029756.50941.02.
- Tiitta, P., A. Leskinen, L. Hao, P. Yli-pirilä, M. Kortelainen, J. Grigonyte, J. Tissari, H. Lamberg, A. Hartikainen, K. Kuuspalo, and A. M. Kortelainen. 2016. Transformation of logwood combustion emissions in a smog chamber: formation of secondary organic aerosol and changes in the primary organic aerosol upon daytime and nighttime aging. Atmos. Chem. Phys. 16 (3):13251–13269. doi: 10.5194/acp-16-13251-2016.
- Timko, M. T., S. E. Albo, T. B. Onasch, E. C. Fortner, Z. Yu, R. C. Miake-Lye, M. R. Canagaratna, N. L. Ng, and D. R. Worsnop. 2014. Composition and sources of the organic particle emissions from aircraft engines. Aerosol Sci. Technol. 48 (1):61–73. doi: 10.1080/02786826.2013.857758.
- Timonen, H., S. Carbone, M. Aurela, K. Saarnio, S. Saarikoski, N. L. Ng, M. R. Canagaratna, M. Kulmala, V.-M. Kerminen, D. R. Worsnop, and R. Hillamo. 2013. Characteristics, sources and water-solubility of ambient submicron organic aerosol in springtime in helsinki, Finland. J. Aerosol Sci. 56 :61–77. doi: 10.1016/j.jaerosci.2012.06.005.
- Tiwari, A. J., M. Ashraf-Khorassani, and L. C. Marr. 2016. C60 fullerenes from combustion of common fuels. Sci. Total Environ. 547 :254–260. doi: 10.1016/j.scitotenv.2015.12.142.
- Tobias, H. J., D. E. Beving, P. J. Ziemann, H. Sakurai, M. Zuk, P. H. McMurry, D. Zarling, R. Waytulonis, and D. B. Kittelson. 2001. Chemical analysis of diesel engine nanoparticles using a nano-DMA/thermal desorption particle beam mass spectrometer. Environ. Sci. Technol. 35 (11):2233–2243. doi: 10.1021/es0016654.
- Toner, S. M., D. A Sodeman, and K. A Prather. 2006. Single particle characterization of ultrafine and accumulation mode particles from heavy duty diesel vehicles using aerosol time-of-flight mass spectrometry. Environ. Sci. Technol. 40 (12):3912–3921. doi: 10.1021/es051455x.
- Ulbrich, I. M., M. R. Canagaratna, Q. Zhang, D. R. Worsnop, and J. L. Jimenez. 2008. Interpretation of organic components from positive matrix factorization of aerosol mass spectrometric data. Atmos. Chem. Phys. Discuss. 8 (2):6729–6791. doi: 10.5194/acpd-8-6729-2008.
- Vaaraslahti, K., J. Keskinen, B. Giechaskiel, A. Solla, T. Murtonen, and H. Vesala. 2005. Effect of lubricant on the formation of heavy-duty diesel exhaust nanoparticles. Environ. Sci. Technol. 39 (21):8497–8504.
- Waluś, K. J., Ł. Warguła, P. Krawiec, and J. M. Adamiec. 2018. Legal regulations of restrictions of air pollution made by non-road mobile machinery-the case study for Europe: a review. Environ. Sci. Pollut. Res. Int. 25 (4):3243–3259. doi: 10.1007/s11356-017-0847-8.
- Worton, D. R., G. Isaacman, D. R. Gentner, T. R. Dallmann, A. W. H. Chan, C. Ruehl, T. W. Kirchstetter, K. R. Wilson, R. A Harley, and A. H. Goldstein. 2014. Lubricating oil dominates primary organic aerosol emissions from motor vehicles. Environ. Sci. Technol. 48 (7):3698–3706. doi: 10.1021/es405375j.