
 ?Mathematical formulae have been encoded as MathML and are displayed in this HTML version using MathJax in order to improve their display. Uncheck the box to turn MathJax off. This feature requires Javascript. Click on a formula to zoom.
Abstract
Identification of particulate matter is important in assessing an individual’s exposure to potentially harmful particles, such as aeroallergens, toxins, and emissions from combustion sources, which can contribute to cardio-pulmonary diseases. Efficient collection of aerosols is essential for aerosol exposure studies such as analysis of chemical and biological components. We present the design and evaluation of a capillary collector that collects PM2.5 onto the outer surface of a capillary for in-situ spectroscopic analysis. The capillary collector uses a needle-to-ring corona generator to charge particles; the electric field between a cylinder and a wire inserted into the bore of a capillary is used to collect the charged particles. Corona and repelling voltages are optimized for maximum collection of ambient PM2.5 particles and fluorescent polystyrene latex microspheres in the PM2.5 size range, on the capillary. The capillary collection efficiency of ambient PM2.5 at 3 slpm operating flow rate and optimal operating voltages is 63%. Fluorescence spectroscopy is used to quantify the collection of polystyrene latex microspheres. The fluorescence-based capillary collection efficiency is in close agreement with the capillary collection efficiency of ambient PM2.5. The collection and analysis methodology can be used to develop a compact, low-cost sensor for in-situ spectroscopic analysis of aerosols to determine their chemical composition for source apportionment.
Copyright © 2019 American Association for Aerosol Research
1. Introduction
Particulate matter (PM) is a pollutant caused by emission from agricultural processes, mobile and industrial combustion sources, forest fires, and other natural and anthropogenic sources. Environmental and occupational exposure to PM is linked to serious health problems. PM2.5 (particles having an aerodynamic diameter less than 2.5 μm) associated with combustion products cause significant lung inflammation and other adverse respiratory effects. (Becker et al. Citation2005; Dick et al. Citation2003; Gilmour et al. Citation2007; Gilmour et al. Citation2004; Happo et al. Citation2007; Seagrave et al. Citation2005; Singh et al. Citation2004). Cardiovascular diseases are also suspected of being related to environmental exposure (Dominici et al. Citation2006; Pope et al. Citation2004). The toxic potential of inhaled particles depends on particle size and chemical composition. However, it is challenging for current exposure monitoring approaches to provide chemical analysis of the collected sample (especially in field settings). There is a need for robust, low-cost approaches for sampling and analysis that can measure individual exposure to PM2.5. Ultimately, such improved assessment methods can enhance our understanding of the health effects of air pollutant mixtures, leading to improved human health risk assessment and guidance for the managing of diseases and intervention strategies.
Current methods for PM exposure monitoring, such as using gravimetric filters, tapered element oscillating microbalances (TEOM), beta attenuation monitors (BAM), and aerodynamic particle sizers (APS) are accurate and precise. However, it is expensive and cumbersome to use them for personal monitoring purposes. For example, filter collection and analysis is limited by high elution volumes, the form factor of the sampling setup, and high-power requirements. Hence, applications such as personal monitoring demand development of inexpensive and compact instruments without sacrificing sizing accuracy and reliability. Due to the progress in miniaturization of sampling pumps and electronics, new exposure methods are becoming more popular in epidemiological studies and air quality monitoring applications. Recent examples of miniature PM samplers are presented in (Cai et al. Citation2014; Chartier et al. Citation2017; Koehler and Peters Citation2015; Nakayama et al. Citation2018; Volckens et al. Citation2017), including biological aerosol collectors (Ariessohn and Novosselov Citation2010; Foat et al. Citation2016; Han, Thomas, and Mainelis Citation2017; Roux et al. Citation2016), real-time time PM monitoring devices (Austin et al. Citation2015; Dacunto et al. Citation2015; Dons et al. Citation2017; Njalsson and Novosselov Citation2018), and low-cost distributed sensor networks (Gao, Cao, and Seto Citation2015; Johnson et al. Citation2016; Seto et al. Citation2014) that are used for pollution exposure estimates.
Of particular interest is the collection and analysis of PM2.5. Their smaller particle size presents a challenge for real-time optical scattering instruments due to their low optical cross-section and their low Stokes number, which presents difficulties for inertial focusing (Ariessohn and Novosselov Citation2011; Marple and Chien Citation1980; Novosselov and Ariessohn Citation2014) and inertial collection (He and Novosselov Citation2017; Marple, Rubow, and Behm Citation1991; Marple, Rubow, and Olson Citation1995; Novosselov et al. Citation2014). Filter collection of PM2.5 is currently a standard method used in air quality assessment. Electrostatic precipitation is another advantageous method for PM2.5 collection because the electrostatic force acting on a charged particle in the electric field is significantly higher than gravitational, inertial, and thermal forces, allowing for the manipulation of particles. Electrostatic precipitator (ESP) devices have been reported in the mid-20th century, e.g. (Morrow and Mercer Citation1964; Trichel Citation1938). Although electrostatic precipitators are widely used in the industry, miniaturized electrostatic precipitator devices have not been widely used for exposure monitoring. Collectors using electrostatic precipitation having novel designs and high PM2.5 collection efficiencies are being developed (Foat et al. Citation2016; Han, Thomas, and Mainelis Citation2017; Lee et al. Citation2016). More recent work includes the design and evaluation of collectors integrated with analysis capabilities such as microscale optical spectroscopies (Zheng et al. Citation2017) and fluidic assays, e.g. (Han, An, and Mainelis Citation2010; Han et al. Citation2011; Ma et al. Citation2016; Pardon et al. Citation2015).
Chemical analysis of PM is routinely performed to determine organic fraction in the sample (Buzcu-Guven et al. Citation2007); Total Organic Carbon (TOC) analysis is often augmented by sample extraction followed by GCMS (Bergauff et al. Citation2008) or LCMS (Lin et al. Citation2018; Samburova et al. Citation2016) to provide more detailed information about the organic fraction. Determination of chemical composition using laboratory techniques involves PM collection on filters, followed by Soxhlet extraction as pre-processing steps. This makes offline laboratory analysis cumbersome. Furthermore, instruments used for the standard laboratory analysis techniques are bulky and expensive. Hence, new technologies are being developed for PM2.5 analysis to complement conventional analysis techniques (Diwakar et al. Citation2012; Ji, Dai, and Zhang Citation2015; Sheesley et al. Citation2015; Sivaprakasam et al. Citation2011; Yu et al. Citation2018). Among these, spectroscopic and microscopic methods have some advantages such as measurement of chemical species of individual particles, ambient pressure operation and nondestructive analysis. Spectroscopic analysis such as UV laser-induced fluorescence (UV-LIF) and Raman spectroscopy have been used for classification of the aerosol particles (Campbell et al. Citation2005; Dippel and Heintzenberg Citation1999; Huffman and Santarpia Citation2017; Pan Citation2015; Sengupta et al. Citation2005). These spectroscopic techniques are particularly useful for analysis of bioaerosols and PM containing high fluorescent yield compounds that can be extracted using solid-state solvents to avoid multi-step sample preparation.
In this manuscript, we present the design and evaluation of a novel ESP-based capillary sensor which can be integrated for subsequent in-situ spectroscopic analysis of PM2.5. The collector charges the particles in the corona discharge region; the charged particles are collected on the outer surface of a fused silica capillary in the collection region. Operating conditions of the capillary collector are optimized to maximize the collection of PM2.5 in ambient air. Fluorescence-based methods are used to verify capillary collection efficiency. In-situ spectroscopic analysis capability is demonstrated using fluorescence spectroscopy. This paper describes the analysis of the collection of PM2.5, while also providing the basic design and proof-of-concept demonstration for the development of a compact PM monitor.
2. Experimental methods
2.1. Sensor design considerations
The sensor design is aimed at collecting and analyzing PM2.5. The geometric dimensions and low power consumption requirements of personal exposure monitors limit their sampling rate, typically to less than 10 slpm, e.g. IOM Sampler (SKC) and 37 mm closed face cassette (Gorner et al. Citation2010). For a sampler with a relatively low flow rate, the high collection efficiency of PM is desired to overcome the concentration limits, especially for PM2.5, as their mass concentration in the environment is typically low. In the presented design, particles are charged in the corona ionization region and collected on the outer surface of the capillary in the coaxial cylindrical electric field. Particle trajectory is governed by their electrical mobility (charge-to-mass ratio), the residence time in the collection region, flow regime (laminar or turbulent), the strength of the field, and collection region geometry. The effect of these parameters on the collection of PM2.5 is investigated experimentally. The operating flow rate of the device is maintained at 3 slpm. Optimization of collection efficiency (CE) for PM2.5 in the ambient air is performed for different operating voltages. The CE for ambient particles measurement is verified using bulk fluorescent measurements of fluorescent dye coated polystyrene latex (PSL) particles. Furthermore, fluorescence spectra of PSL particles collected on the capillary are recorded using internal excitation through the capillary and compared to spectra obtained by conventional epifluorescence spectroscopy technique, as a proof concept for further integration of the device for in-situ spectroscopic analysis.
2.2. Collector geometry
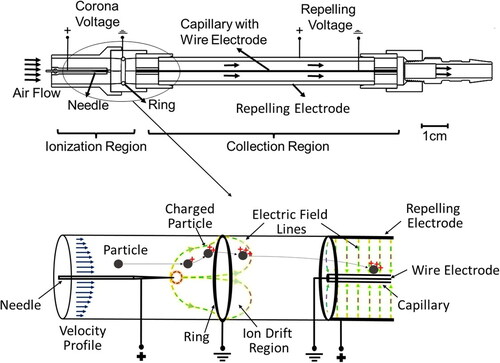
The capillary collector is divided into two regions: the ionization region and the collection region, see (top). The individual elements of the collector are held in the 3D-printed enclosure to control the spacing and alignment. The ionization region consists of a high voltage corona needle and a grounded ring electrode. The anode needle is a 0.5 mm thick tungsten needle with a radius of curvature of 1 μm at the tip (measured using optical microscopy). The ground electrode is a 1.58 mm thick solid solder with an inner radius of 10 mm. The needle is held at the axis of the ring at 5 mm from the center of the ring. A variable high voltage power supply (Glassman High Voltage Inc. EH Series) is used to create the electric potential between the electrodes, referred to as corona voltage (φC) in this paper. In the positive corona mode, positive ion discharge occurs at a corona voltage greater than 2.5 kV, indicated by a small positive anode current of around 0.1µA. Particles are charged as they enter the capillary collector. The ionization region is fluidically connected to the collection region, consisting of a high voltage aluminum tube and a grounded thin metal wire placed inside the fused silica capillary. The positively charged aluminum tube (100 mm long, 12.7 mm OD) acts as a repelling electrode. The ground electrode wire (100 µm in diameter) is inserted into the bore of a fused silica capillary (250 µm ID, 350 µm OD, Length: 100 mm). The capillary with the grounded wire is placed concentric to the aluminum tube. Charged particles enter the electrical field formed between the aluminum tube (repelling electrode) and the capillary (with the ground electrode) and are collected on the outer capillary wall. Hence, this region is called the collection region. A variable high voltage power supply (Glassman High Voltage Inc. EH Series) is used to create the electric potential between the wire and tube, referred to as repelling voltage (φR) in this paper. The collection region is connected to a pump through a barb connection. From the Lagrangian perspective, the particles passing through the corona discharge become positively charged, as shown in (bottom). Their trajectories in the ionization region depend on their mass/charge ratio, the strength of the electrical field, their residence time, and their initial position. The time-dependent particle charging in the strong, rapidly changing electric field and the high ion concentration is a very complicated process and is a subject of future research. As the ring in the ionization region is grounded, a fraction of the charged particles can be collected on the ring, and the rest of the particles enter the collection region. The electric field between the wire and tube in the collection region repels the positively charged particles towards the ground wire. Since the wire is concentric to the capillary, particles which change their trajectories significantly due to the force exerted by the electric field in the ionization region collect on the outer surface of the capillary wall. During this time, a fraction of the PM can exit the device. The optimization of the collector operating conditions is shown in this paper.
Figure 1. Capillary collector design: The needle ring assembly is called the ionization region and wire tube assembly is called the collection region (top). Particles entering the device are charged due to the corona discharge in the ionization region and are repelled by the electric field in the collection region leading to the collection of particles on the capillary surface (bottom).
2.3. Ambient particles collection experiments
The experimental study to assess the collection efficiency was performed for several corona voltages (φC) and repelling voltages (φR) in a temperature range of 22–25 °C, relative humidity of 23%–25% and at ambient pressure. The experimental setup was placed on a benchtop in a laboratory setting having a PM2.5 mass concentration of 8 µg/m3 measured by an aerodynamic particle sizer (APS 3310, TSI, Shoreview, MN). In the ionization region, corona discharge was stable for a range of corona voltages, from 2.5 kV to 7 kV. The onset of ion generation was at φC > 2.5 kV. The current measured on the cathode ring, based on the voltage drop across a 1 MΩ resistor, increased with increasing corona voltage, having values of 0.8 µA for φC = 4 kV and 7.5 µA for φC = 7 kV. For φC > 7 kV, the cathode current became unstable and not reproducible over a range of atmospheric and operating conditions (RH, T, flow rate), eventually leading to a spark discharge. Hence, φC was varied from 3 kV to 7 kV for collection efficiency experiments, and φR was varied from 0 kV to 2 kV. Increasing φR above 2 kV resulted in arcing between the collection and repelling electrodes which damaged the capillary substrate. The capillary collector requires lower pump power to operate compared to commercially available personal aerosol samplers because of the ionic wind generation, which adds to the flow in the device, and because of the absence of flow restricting collection filters. In this paper, we present the collection results for a flow rate of 3 slpm to operate the device; however, the device can be optimized for higher flow rates.
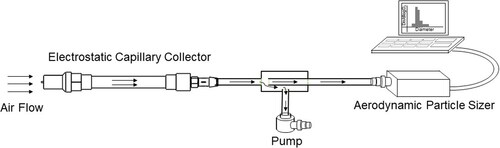
In ambient particle collection experiments, efficiency was determined based on the total number of ambient air particles collected in the capillary collector with respect to the number of particles entering the device, referred to as Total Collection (TC). The outlet of the device was attached to a T-connection, as shown in . One end of the T-connection was connected to a pump, and the other end was connected to the APS. The sampling flow rate of the APS was set to 1 slpm. The flow rate of the pump was set to 2 slpm via a digital rotameter. The dimension of the sampling tube and the inner dimension of the T-connector were chosen, such that the velocities were approximately the same for a total flow rate of 3 slpm. For each sampling experiment, φC and φR were fixed. The sampling time was 60 seconds. Five reference measurements of particle concentrations were recorded by the APS with φC, and φR turned off. Five sample measurements were recorded with φc, and φR turned on. The average of these five measurements was used to calculate the TC, as given by (1). The measurements were repeated for each sampling condition,
(1)
(1)
where TCN,M (%) is the TC at fixed φC = N (kV) and φR = M (kV), APSN,M (µg/m3) is the concentration of particles measured by the APS at φC = N (kV) and φR = M (kV), and APS0,0 is the concentration recorded for reference measurement. When φC > 0 kV and φR > 0 kV, TC measurement includes particles collected on the capillary and particles collected elsewhere in the device. The fraction of particles entering the device which are collected on the capillary substrate can be quantified using Capillary Collection (CC). While TC is the measurement of all particles collected in the device, CC is a fraction of TC for particles which are collected on the capillary. It is necessary since only the particles on the substrate will be used for subsequent spectroscopic analysis; the particles collected on the grounded ring electrode or other parts of the geometry cannot be analyzed. When φC > 0 kV and φR = 0 kV, TC represents the fraction of particles lost on the ring and other parts of the ionization region. The difference in TC between φR > 0 kV and φR = 0 kV for the same φC can be used to calculate CC given by (2),
(2)
(2)
where CCN,M (%) is the CC at φC = N (kV) and φR = M (kV). The N and M values for which CCN,M is the highest, are set as the optimum operating conditions for a given flow rate. The ozone concentration was measured using an ozone analyzer (Model 450, Teledyne Instruments, San Diego, CA, USA) downstream of the capillary collector at optimum operating conditions and sampling flow rate of 3 slpm.
Figure 2. Schematic diagram of the experimental setup used to optimize φC and φR for maximum capillary collection efficiency. The particle concentration leaving the device was measured by the APS, and the CE of the device was calculated.
2.4. Capillary collection efficiency using bulk fluorescence
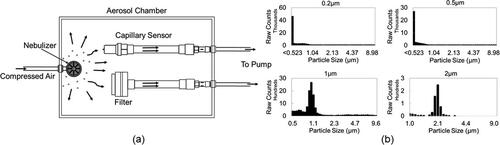
While the collection of polydisperse ambient PM provides the most relevant data for exposure monitoring applications and allows for the collection of large amounts of data over a range of particle sizes, it may have uncertainties with calculations of particle loss in the ionization zone and losses associated with particle transmission in the tubing connected to the particle sizer. To validate the ambient PM results, additional experiments with monodisperse model particles were performed. The capillary collector was placed in an aerosol chamber, which is a sealed container having an inlet port to press fit the nebulizer and output ports for connecting devices, filters, and the APS. Two variable high voltage power supplies (Glassman High Voltage Inc. EH Series), which provide φC and φR, were placed outside the aerosol chamber and were electrically connected to the collector. The operating voltages were set at the optimum values obtained from the experiments with ambient particles. A reference filter (Spectrum Poretics® polycarbonate membrane filters, 47 mm, 0.1 µm or 0.6 µm pore sizes) was placed in an open face aerosol filter holder (EDM Millipore, Billerica, MA, model XX5004710). The collector and the filter were operated at a sampling flow rate of 3 slpm. The experiments used PSL particles (Fluoresbrite® YG Microspheres, Polysciences, Inc., Warrington, PA, USA) having sizes 0.2 µm, 0.5 µm, 1 µm, and 2 µm. A stock particle solution from the manufacturer (typically 2%–3% solid fraction) was diluted 100X in distilled water. shows the schematic of the experimental setup. During the experiment, about 5 ml of prepared solution was nebulized from the liquid suspension using the MADA Up-Mist™ Medication nebulizer (MADA Products, Carlstadt, NJ). The aerodynamic particle sizer (APS 3321, TSI, Shoreview, MN) was used to verify the particle size and monitor the particle concentration in the chamber. Typical particle size distribution in the aerosol chamber for each particle size is shown in . APS measurements confirmed that there was no significant aerosol agglomeration during the experiments. Particles were collected for 20 minutes in each experiment. Three collection experiments were performed for each particle size.
Figure 3. (a) Fluorescent PSL particles in the PM2.5 size range were sampled using the capillary collector and a reference filter in an aerosol chamber. The capillary collection was determined by measuring the bulk fluorescence signal of particles collected on the capillary and filter. (b) Typical size distribution of PSL particles during the collection, recorded by the APS.
After collection, the capillary was removed from the collector for analysis. The collection efficiency was calculated by comparing the bulk fluorescence emission intensity of particles captured on the capillary surface to the bulk fluorescence emission intensity of particles captured on the reference filters. Particles on the capillary substrate and the reference filters were first eluted with 10 mL of 0.05% Tween 20 solution using 50 mL centrifuge tubes. The centrifuge tubes containing the capillary and the reference filters were placed in an ultrasonic bath for 5 minutes which was followed by 5 minutes of shaking in a vortexer. Additional elution steps or increased times did not produce any significant increase in the fluorescent signal. A 2 mL aliquot of total 10 mL volume was then transferred into a 12 mm × 75 mm borosilicate glass cuvette, and the solution fluorescence was measured with a spectrofluorometer (Sequoia-Turner model 450). The calibration of the spectrofluorometer and the flow meters was confirmed before and after each experiment. This methodology has been previously described in several research studies (He and Novosselov Citation2017; Novosselov et al. Citation2014). Fluorescence-based capillary collection (FCC) is defined as the efficiency of particle collection on the capillary surface based on the fluorescence intensity reading from the capillary solution and reference filter solution:
(3)
(3)
where I is the bulk fluorescence intensity from the filter or the capillary eluent.
2.5. Spectroscopic analysis of collected particles
Fused silica substrates are used for spectroscopic and vibrational analysis since they have a high optical transmission in the UV, visible, and infrared range and a high thermal and chemical resistance. They are also good electrical insulators. Tube substrates in the form of capillaries and fibers have an advantage as 1. They act as waveguides which enable application of optical and vibrational spectroscopic techniques in-situ and 2. They enable the use of novel technologies like evanescent wave spectroscopy, Surface Enhanced Raman Spectroscopy (SERS), Cavity Ring Down Spectroscopy (CRDS), etc. (Dhadwal et al. Citation2004; Li, Loock, and Oleschuk Citation2006; Shanthil, Fathima, and Thomas Citation2017; Tao et al. Citation2007). While other spectroscopic techniques can be integrated with the capillary substrate, we demonstrate the integration of capillary substrate used in the capillary collector for in-situ analysis through fluorescence spectroscopy of PSL particles. PSL particles having sizes 0.1 µm, 0.2 µm, 0.5 µm, 1 µm, and 2 µm were used for fluorescence analysis. Particle collection experiments were performed at 3 slpm sampling flow rate and optimum operating voltages. Three collectors were used in the aerosol chamber for collection, as shown in Supplemental Information Figure S1. Five collection experiments were performed for each particle size. After the collection, the capillary was removed and inserted into the optical analysis module. We tested two different excitation configurations: 1. internal excitation, where the light was passed from the capillary end, and 2. standard external excitation used in epifluorescence microscopy in which the light source was fixed perpendicular to the capillary. The lens used for the collection of emitted light was always placed perpendicular to the capillary. shows the schematic of the experimental setup.
Figure 4. Fluorescence spectra of PSL particles collected on capillary were recorded using internal excitation and external excitation as shown in the schematic.
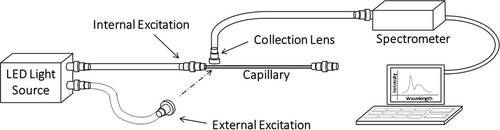
In the internal excitation scenario, the capillary propagated the excitation light along its axis, serving as a light waveguide. The particles located on the outer wall were excited due to an evanescent field and via direct particle excitation through the wall due to a mismatch in refractive indices between the particles and the capillary. The excitation light source was 430 nm UVTOP LED (LED430L, Thorlabs Inc., Newton, New Jersey, USA). The LED was powered by a driver circuit that controls the intensity of the light. For experiments with internal excitation, an optical fiber transmitted light from the LED to the capillary. In the external excitation setup, the light was focused on a spot on the capillary using a collimating lens held perpendicular to the capillary axis. An optical fiber transmitted light from the LED to the collimating lens placed at 25 mm from the capillary axis. The size of the interrogated area on the capillary was around 5 mm. The emitted fluorescence was collected by a collimating lens placed close to the capillary, perpendicular to the excitation direction and perpendicular to the capillary axis. An optical fiber connected the collection lens to a spectrometer (FLAME-UV-VIS-ES, Ocean Optics, Inc., Dunedin, FL, USA) which measured and recorded the emission spectra. For both internal and external excitation, the integration time for recording the emission spectra was set to 1 second. The LED input power used for external excitation was lower than the internal excitation to avoid saturation of the CCD of the spectrometer. Standard data processing software (MATLAB, Mathworks Inc.) was used for post-processing of data.
Detection of a strong excitation light signal or a stray light signal presents a problem during optical analysis. To minimize the amount of stray light produced due to scattering or reflection from reaching the detector, a number of methods are used, e.g. spatial filtering in the optical scattering devices (Sacks, Smith, and Hiester Citation1997), long pass filters in spectroscopy (Hofmann et al. Citation2006), and polarization (Weiss Citation1999). In fluorescence measurements, the excitation light may overlap with the useful fluorescence spectrum. This is especially important for relatively broad excitation sources that are used in low-cost detectors (25 nm for a typical LED) where the excitation light may mask the signal. Fluorescence emission with respect to excitation light captured by the detector was investigated for both internal and external excitation methods. No additional filtering was used in the experiments. The emission spectra for internal and external excitations were recorded for each sample at the same location, without changing the sample position. The background light was recorded by the Oceanview software (Ocean Optics, Inc., Dunedin, FL, USA) with the input light off. Then, the input LED was turned on for the internal excitation setup, and the emission intensity for each wavelength was recorded. The LED input was then switched to the external excitation setup, and the emission intensity for each wavelength was recorded. The recorded spectra were limited to the 350 nm to 650 nm wavelength range for analysis. All negative intensities in the data were removed.
3. Results and discussion
3.1. Optimization of operating voltages for capillary collector
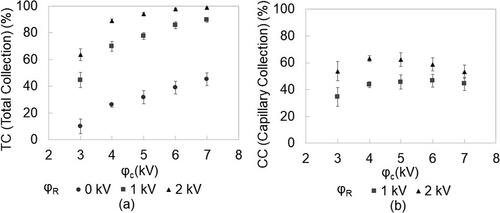
Operating voltages were optimized in the ambient particle collection experiments at a collector flow rate of 3 slpm. The ambient particle concentration in each bin did not change significantly during the experiments. An average of 5 measurements was used for the calculation of TC. shows the TC for the PM2.5 range. When φC > 0 kV, particles are charged in the ionization zone. The particle charging mechanism and their exact trajectories in the ionization region, which has a strong electrical field gradient and a high ion concentration, are beyond the scope of this manuscript. However, three possibilities with respect to particle fate are apparent and are also observed experimentally: 1. the particle is charged and captured in the ionization zone before entering the collection region, 2. the particle travels through the ionization zone and is captured on the collection substrate, and 3. the particle is not captured anywhere in the device, exits the collection zone, and is counted by the APS. In the first scenario, the charged particle deviates in the electrical field of the ionization region and eventually lands on the wall or the ground electrode. The fraction of particles exhibiting this behavior can be measured by operating the device with the corona voltage “on” (φC > 0 kV) and the repelling voltage “off” (φR = 0 kV). For zero repelling voltage, as corona voltage is increased, the number of particles charged and the amount of charge on the particles increases. Hence, changing φC from 3 kV to 7 kV increases particle capture from 10% to 35%. When the repelling voltage is turned on, TC increases significantly due to particle capture in the collection region. An increase in the repelling voltage results in a stronger electrical field and a greater force acting on the charged particles. Hence, TC increases with increasing repelling voltage. For φC > 4 kV and φR = 2 kV, more than 90% of all particles entering the device are collected. CC is found to be maximum for φC ∼ 4 – 5 kV. An additional increase in φC results in an efficiency drop due to particle loss in the ionization zone. At lower values of φC, a significant number of particles escape the collector (35% at φC = 3 kV) even when φR is set to the highest value, suggesting that these particles are not charged in the ionization zone. A maximum CC of 63% is observed for φC = 4 kV and φR = 2 kV; this condition is chosen as optimal for the collector operation. φR is restricted to 2 kV to prevent arcing and damage to the capillary. Ozone concentration measured at φC = 4 kV and φR = 2 kV and a sampling flow rate of 3 slpm is 28 ppb.
Figure 5. (a) The TC of the capillary sensor for PM2.5 increases with increasing corona voltage (φC). (b) The CC of the capillary sensor for PM2.5 is maximum at corona voltage (φC) = 4 kV and repelling voltage (φR) = 2 kV.
3.2. Collection efficiency using polystyrene latex particles
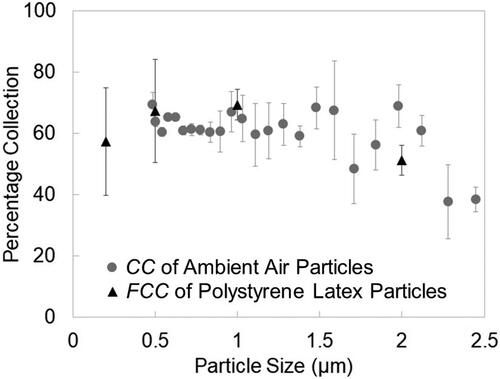
Experiments with monodisperse fluorescent PSL particles were performed to validate the ambient particle collection efficiency measurements. Here, the fluorescence from the capillary collection is directly compared with the reference filters operated in parallel in the aerosol chamber. compares capillary collection as a function of particle size for ambient air particles (APS sizing) and PSL particles. In ambient air experiments, APS measurements show that particle concentration is highest in the 0.5 µm to 1 µm size range and decreases as particle size increases. Capillary collection obtained from bulk fluorescence measurements is the highest for 0.5 µm and 1 µm particle sizes and decreases for 2 µm particles, which compares well with the APS data. The average FCC for PM2.5 particles at optimum voltage conditions is 61% (based on equal particle binning), which is close to the 63% CC, which validates the measurements taken with the ambient particles.
Figure 6. Comparison of PM2.5 collection on the capillary obtained by two methods: (i) bulk fluorescent measurements of PSL particles (FCC), and (ii) particle concentration measurement of ambient air (CC).
3.3. Fluorescence emission of PSL particles
For PSL collection in the aerosol chamber, it is difficult to achieve controlled and uniform collection on the capillary. The particle loading and collection position on the capillary depends on the electrical mobility of the particle, its initial position at the inlet, and other parameters that were not controlled during particle collection. Comparison of internal excitation fluorescence with bulk fluorescence is challenging since only about 5 mm of the capillary length with an unknown concentration of particles is interrogated for internal excitation technique, while for bulk fluorescence, all collected particles are eluted and analyzed. In general, experiments have shown that, for smaller particles (dp < 500 nm), the concentration on the capillary substrate is greater near the entrance to the collection region, and it decreases along the length of the capillary while 2 µm particles have a more uniform distribution along the capillary length, see Supplemental Information Figure S2. This suggests that the capillary length can be reduced for the collection of PM2.5, which will reduce the device length. Additionally, some size classifications are possible; however, the ambiguity in initial particle location and charging efficiency of the test particles needs to be further investigated. After collection of PSL particles, it was found that for all particle sizes, the capillary end closer to the ionization region had enough concentration of particles for fluorescence measurements. Hence, measurements by internal and external excitation techniques were done on a spot located at a distance of 10 mm from the capillary end closer to the ionization region.
Emission spectra recorded by internal and external excitation consist of fluorescence peaks from PSL particles and an excitation peak due to the detection of scattered excitation light, as shown in Supplemental Information Figure S3. For both internal and external excitation, the maximum intensity of the excitation peak is greater than the maximum intensity of the fluorescence peaks in the emission spectra. If fluorescence peaks have very low intensity compared to the excitation peak, it will be challenging to discern fluorescence peaks in emission spectra since they will be covered by the broad excitation peak. Therefore, for the same intensity of the excitation peak, spectra which have higher fluorescence intensity will be easy to identify and interpret. The emission spectra of collected samples are normalized by their maximum value. The normalized spectrum of the LED light source is subtracted from the emission spectra to get the fluorescence spectra for each method. The maximum fluorescence intensity in the resultant spectra for internal excitation is compared to those for external excitation in .
Figure 7. The normalized maximum fluorescence intensity for the internal excitation method is greater than the external excitation method; plotted with standard error (n = 3).
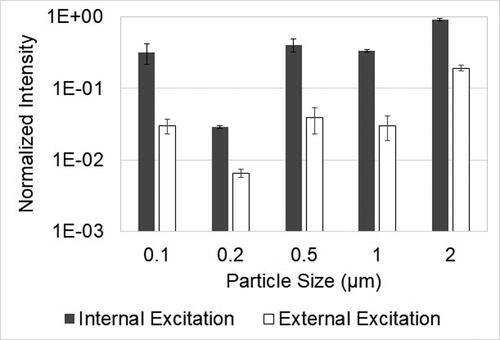
For all particle sizes, the peak fluorescence intensity for the internal excitation method is always greater than that for the external excitation. This means that fluorescence peaks can be distinguished easily from emission spectra obtained using internal excitation than the ones obtained using external excitation. Internal excitation technique with a capillary substrate will work better in compact, low-cost devices to analyze fluorescence of collected particles when broad excitation LEDs are used. The result does not imply that the internal excitation technique has higher sensitivity than the external excitation technique. Additional work is needed for sensitivity analysis.
The collection of particles charged in the ionization region along the capillary length is governed by the electrical mobility of the particles. Particles with greater electrical mobility will collect closer to the entrance of the collection region. For the same charge, electrical mobility increases with the particle size in the PM2.5 size range; however, large particles can acquire a higher number of elementary charges depending on the charging mechanism. Due to corona discharge in the ionization region and the electric field in the collection region, particles in the capillary collector are charged by both diffusion and field charging mechanisms. In this complex environment, particle electrical mobility is not well controlled. Additionally, the collection location depends on the initial particle position which was not controlled in the experiments. However, as discussed earlier, preliminary experiments show that for the smaller particles (dp < 500 nm), the concentration on the capillary substrate is higher near the entrance to the collection region, and it decreases along the length of the capillary, while 2 µm particles have a more uniform distribution along the capillary length. Particle size classification based on their collection region requires additional modifications to the experimental setup which is beyond the scope of this manuscript.
3.4. Integration with spectroscopic analysis techniques
The capillary collector is designed to collect an aerosol sample on a relatively small collection surface resulting in high collection surface density to facilitate in-situ spectroscopic analysis of PM. The overall design is similar to other ESP collectors, e.g. (Han, Thomas, and Mainelis Citation2017). However, it is compact and has lower operating voltages; hence it can be used as a wearable PM exposure monitor. Most ESP based collectors presented in the literature have limited in-situ analysis capability. The collected sample is typically analyzed via laboratory methods such as GCMS, organic carbon analysis, biological assay, etc. The main advantages of the presented capillary collector are 1. A high collection efficiency over a broad range of the aerosols in a single-stage device, and 2. Collection directly onto the analysis substrate amenable for in-situ nondestructive spectroscopic analysis, e.g. fluorescence (as demonstrated in this paper), Raman, absorption, reflectance, etc. The sample can be archived and used for other laboratory analysis techniques too. Laboratory generated particles and dyes have been used to study physical and chemical phenomena as they tend to mimic the actual process in various studies (Davis et al. Citation2017; Hosny et al. Citation2013). The operation of the collector is demonstrated for highly fluorescent particles with a significantly higher quantum yield than the ambient aerosols. Additional optical elements may be required to enhance the fluorescence signal associated with biological aerosols. The analysis of the fluorescence associated with combustion-generated particles may require modifications to the capillary substrate. PDMS, sol-gel and other extraction media can be coated on the outer surface of the capillary wall for solid phase extraction of collected particles to analyze fluorescence and absorbance of various compounds in aerosols (Hawthorne, St Germain, and Azzolina Citation2008; Kulkarni et al. Citation2010). Gravimetric analysis of collected aerosols is possible as its weight is comparable to standard filters used for aerosol collection. CRDS can be performed by using the capillary cross section as a cavity (Waechter et al. Citation2010). Metal nanoparticles or sheets can be coated to perform SERS (Hwang et al. Citation2010; Shanthil, Fathima, and Thomas Citation2017). Laser-induced plasma spectroscopy can be used to detect heavy metals in aerosols since it has been performed using quartz filters and requires a small interrogation area (Panne et al. Citation2001).
4. Conclusions
We designed and evaluated a capillary collector for the collection of PM2.5 which can be integrated with in-situ spectroscopic analysis techniques. The device combines particle charging and electrostatic collection to collect PM2.5. Two methods are used to determine the capillary collection: real-time particle concentration measurements of ambient air using particle sizers and bulk fluorescent measurements based on the collection of fluorescent PSL particles. The average capillary collection of PM2.5 from APS measurements of ambient air particles is 63% and is 61% from bulk fluorescence measurements of PSL particles. At optimized operating conditions, the collection efficiency is relatively constant (∼ 65%) for all particles in the 0.2–2 µm range and drops below 50% for particles larger than 2 µm, likely due to a lower charge-to-mass ratio. Total collection measurements for ambient PM2.5 also show that most of the lost particles are in the particle charging region due to their collection on the walls and the ground electrode in the ionization region. Fluorescence spectroscopy is used to demonstrate the integration of the capillary collector with in-situ spectroscopic analysis techniques.
| List of Symbols and Abbreviations | ||
| φC | = | corona voltage |
| φR | = | repelling voltage |
| APSN,M | = | concentration of particles measured by the APS at φC = N (kV) and φR = M (kV) |
| APS | = | aerodynamic particle sizer |
| BAM | = | beta attenuation monitor |
| CC | = | capillary collection |
| CCN,M | = | CC at φC = N (kV) and φR = M (kV) |
| CCD | = | charge-coupled device |
| CE | = | collection efficiency |
| CRDS | = | cavity ring down spectroscopy |
| ESP | = | electrostatic precipitator |
| FCC | = | fluorescence-based capillary collection |
| GCMS | = | gas chromatography mass spectroscopy |
| I | = | bulk fluorescence intensity |
| ID | = | inner diameter |
| LED | = | light emitting diode |
| LCMS | = | liquid chromatography mass spectroscopy |
| OD | = | outer diameter |
| PDMS | = | polydimethylsiloxane |
| PM | = | particulate matter |
| PM2.5 | = | particulate matter having aerodynamic diameter less than 2.5 μm |
| PSL | = | polystyrene latex |
| RH | = | relative humidity |
| SERS | = | surface enhanced Raman spectroscopy |
| T | = | temperature |
| TC | = | total collection |
| TCN,M | = | TC at φC = N (kV) and φR = M (kV) |
| TEOM | = | tapered element oscillating microbalances |
| TOC | = | total organic carbon |
| UV-LIF | = | Ultraviolet laser-induced fluorescence |
Supplemental data for this article is available on the publisher's website.
Download Zip (573.8 KB)Additional information
Funding
Related Research Data
References
- Ariessohn, P. C., and I. V. Novosselov. 2011. Skimmer for concentrating an aerosol. World Intellectual Property Organization (The Patent Cooperation Treaty), WO2009143016A2.
- Ariessohn, P. C., and I. V. Novosselov. 2010. Aerosol collection and microdroplet delivery for analysis. World Intellectual Property Organization (The Patent Cooperation Treaty), WO2009134495A2.
- Austin, E., I. Novosselov, E. Seto, and M. G. Yost. 2015. Laboratory evaluation of the Shinyei ppd42ns low-cost particulate matter sensor (vol 10, e0137789, 2015). Plos One 10:2 doi:10.1371/journal.pone.0141928.
- Becker, S., L. A. Dailey, J. M. Soukup, S. C. Grambow, R. B. Devlin, and Y. C. T. Huang. 2005. Seasonal variations in air pollution particle-induced inflammatory mediator release and oxidative stress. Environ. Health Perspect. 113 (8):1032–1038. doi:10.1289/ehp.7996.
- Bergauff, M., T. Ward, C. Noonan, and C. P. Palmer. 2008. Determination and evaluation of selected organic chemical tracers for wood smoke in airborne particulate matter. Int. J. Environ. Anal. Chem. 88 (7):473–486. doi:10.1080/03067310701809110.
- Buzcu-Guven, B., S. G. Brown, A. Frankel, H. R. Hafner, and P. T. Roberts. 2007. Analysis and apportionment of organic carbon and fine particulate matter sources at multiple sites in the midwestern United States. J. Air Waste Manage. Assoc. 57:606–619. doi:10.3155/1047-3289.57.5.606.
- Cai, J., B. Z. Yan, J. Ross, D. N. Zhang, P. L. Kinney, M. S. Perzanowski, K. Jung, R. Miller, and S. N. Chillrud. 2014. Validation of microaeth (r) as a black carbon monitor for fixed-site measurement and optimization for personal exposure characterization. Aerosol Air Quality Res. 14 (1):1–9. doi:10.4209/aaqr.2013.03.0088.
- Campbell, S. D., D. P. Tremblay, F. Daver, and D. Cousins. 2005. Multiwavelength bioaerosol sensor performance modeling. Eur. Opt. Photonics Defence Security 5990 doi:10.1117/12.629081.
- Chartier, R., M. Phillips, P. Mosquin, M. Elledge, K. Bronstein, S. Nandasena, V. Thornburg, J. Thornburg, and C. Rodes. 2017. A comparative study of human exposures to household air pollution from commonly used cookstoves in Sri Lanka. Indoor Air 27 (1):147–159. doi:10.1111/ina.12281.
- Dacunto, P. J., N. E. Klepeis, K.-C. Cheng, V. Acevedo-Bolton, R.-T. Jiang, J. L. Repace, W. R. Ott, and L. M. Hildemann. 2015. Determining pm2.5 calibration curves for a low-cost particle monitor: Common indoor residential aerosols. Environ. Sci. Processes Impacts 17:1959–1966. doi:10.1039/C5EM00365B.
- Davis, R. D., M. I. Jacobs, F. A. Houle, and K. R. Wilson. 2017. Colliding-droplet microreactor: Rapid on-demand inertial mixing and metal-catalyzed aqueous phase oxidation processes. Anal. Chem. 89 (22):12494–12501. doi:10.1021/acs.analchem.7b03601.
- Dhadwal, H. S., P. Kemp, J. Aller, and M. M. Dantzler. 2004. Capillary waveguide nucleic acid based biosensor (vol 501, p. 205, 2004). Anal. Chim. Acta 522 (1):133–133. doi:10.1016/j.aca.2004.06.029.
- Dick, C. A. J., P. Singh, M. Daniels, P. Evansky, S. Becker, and M. I. Gilmour. 2003. Murine pulmonary inflammatory responses following instillation of size-fractionated ambient particulate matter. J. Toxicol. Environm. Health-Part A 66 (23):2193–2207. doi:10.1080/15287390390241231.
- Dippel, B., and J. Heintzenberg. 1999. Soot characterization in atmospheric particles from different sources by NIR FT Raman spectroscopy. J. Aerosol Sci. doi:10.1016/S0021-8502(99)80464-9.
- Diwakar, P. K., K. H. Loper, A.-M. Matiaske, and D. W. Hahn. 2012. Laser-induced breakdown spectroscopy for analysis of micro and nanoparticles. J. Anal. Atomic Spectom. doi:10.1039/C2JA30012E.
- Dominici, F., R. D. Peng, M. L. Bell, L. Pham, A. McDermott, S. L. Zeger, and J. M. Samet. 2006. Fine particulate air pollution and hospital admission for cardiovascular and respiratory diseases. JAMA 295 (10):1127–1134. doi:10.1001/jama.295.10.1127.
- Dons, E., M. Laeremans, J. P. Orjuela, I. Avila-Palencia, G. Carrasco-Turigas, T. Cole-Hunter, E. Anaya-Boig, A. Standaert, P. De Boever, T. Nawrot, T. Gotschi, A. de Nazelle, M. Nieuwenhuijsen, and L. I. Panis. 2017. Wearable sensors for personal monitoring and estimation of inhaled traffic-related air pollution: Evaluation of methods. Environ. Sci. Technol. 51:1859–1867. doi:10.1021/acs.est.6b05782.
- Foat, T. G., W. J. Sellors, M. D. Walker, P. A. Rachwal, J. W. Jones, D. D. Despeyroux, L. Coudron, I. Munro, D. K. McCluskey, C. K. L. Tan, and M. C. Tracey. 2016. A prototype personal aerosol sampler based on electrostatic precipitation and electrowetting-on-dielectric actuation of droplets. J. Aerosol Sci. 95:43–53. doi:10.1016/j.jaerosci.2016.01.007.
- Gao, M. L., J. J. Cao, and E. Seto. 2015. A distributed network of low-cost continuous reading sensors to measure spatiotemporal variations of pm2.5 in Xi’an, china. Environ. Pollut. 199:56–65. doi:10.1016/j.envpol.2015.01.013.
- Gilmour, M. I., J. McGee, R. M. Duvall, L. Dailey, M. Daniels, E. Boykin, S. H. Cho, D. Doerfler, T. Gordon, and R. B. Devlin. 2007. Comparative toxicity of size-fractionated airborne particulate matter obtained from different cities in the United States. Inhalation Toxicol. 19 (supp 1):7–16. doi:10.1080/08958370701490379.
- Gilmour, M. I., S. O’Connor, C. A. J. Dick, C. A. Miller, and W. P. Linak. 2004. Differential pulmonary inflammation and in vitro cytotoxicity of size-fractionated fly ash particles from pulverized coal combustion. J. Air Waste Manage. Assoc. 54:286–295. doi:10.1080/10473289.2004.10470906.
- Gorner, P., X. Simon, R. Wrobel, E. Kauffer, and O. Witschger. 2010. Laboratory study of selected personal inhalable aerosol samplers. Ann. Occup. Hyg. 54:165–187. doi:10.1093/annhyg/mep079.
- Han, T., H. R. An, and G. Mainelis. 2010. Performance of an electrostatic precipitator with superhydrophobic surface when collecting airborne bacteria. Aerosol Sci. Technol. 44 (5):339–348. doi:10.1080/02786821003649352.
- Han, T., Y. Nazarenko, P. J. Lioy, and G. Mainelis. 2011. Collection efficiencies of an electrostatic sampler with superhydrophobic surface for fungal bioaerosols. Indoor Air 21 (2):110–120. doi:10.1111/j.1600-0668.2010.00685.x.
- Han, T. T., N. M. Thomas, and G. Mainelis. 2017. Design and development of a self-contained personal electrostatic bioaerosol sampler (PEBS) with a wire-to-wire charger. Aerosol Sci. Technol. 51 (8):903–915. doi:10.1080/02786826.2017.1329516.
- Happo, M. S., R. O. Salonen, A. I. Halinen, P. I. Jalava, A. S. Pennanen, V. M. Kosma, M. Sillanpaa, R. Hillamo, B. Brunekreef, K. Katsouyanni, J. Sunyer, and M. R. Hirvonen. 2007. Dose and time dependency of inflammatory responses in the mouse lung to urban air coarse, fine, and ultrafine particles from six European cities. Inhalation Toxicol. 19 (3):227–246. doi:10.1080/08958370601067897.
- Hawthorne, S. B., R. W. St Germain, and N. A. Azzolina. 2008. Laser-induced fluorescence coupled with solid-phase microextraction for in situ determination of PAHs in sediment pore water. Environ. Sci. Technol. 42:8021–8026. doi:10.1021/es8011673.
- He, J. Y., and I. V. Novosselov. 2017. Design and evaluation of an aerodynamic focusing micro-well aerosol collector. Aerosol Sci. Technol. 51 (9):1016–1026. doi:10.1080/02786826.2017.1329515.
- Hofmann, O., X. H. Wang, A. Cornwell, S. Beecher, A. Raja, D. D. C. Bradley, A. J. deMello, and J. C. deMello. 2006. Monolithically integrated dye-doped pdms long-pass filters for disposable on-chip fluorescence detection. Lab a Chip 6 (8):981–987. doi:10.1039/b603678c.
- Hosny, N. A., C. Fitzgerald, C. L. Tong, M. Kalberer, M. K. Kuimova, and F. D. Pope. 2013. Fluorescent lifetime imaging of atmospheric aerosols: a direct probe of aerosol viscosity. Faraday Discuss. 165:343–356. doi:10.1039/c3fd00041a.
- Huffman, J. A., and J. Santarpia. 2017. Online techniques for quantification and characterization of biological aerosols – microbiology of aerosols. In Microbiology of aerosols, ed. A. -M. Delort and P. Amato. Hoboken, NJ: Wiley.
- Hwang, J. S., K. Y. Chen, S. J. Hong, S. W. Chen, W. S. Syu, C. W. Kuo, W. Y. Syu, T. Y. Lin, H. P. Chiang, S. Chattopadhyay, K. H. Chen, and L. C. Chen. 2010. The preparation of silver nanoparticle decorated silica nanowires on fused quartz as reusable versatile nanostructured surface-enhanced Raman scattering substrates. Nanotechnology 21:6. doi:10.1088/0957-4484/21/2/025502.
- Ji, Z. R., R. C. Dai, and Z. M. Zhang. 2015. Characterization of fine particulate matter in ambient air by combining tem and multiple spectroscopic techniques – NMR, FTIR and Raman spectroscopy. Environ. Sci.-Processes Impacts 17:552–560. doi:10.1039/C4EM00678J.
- Johnson, K. K., M. H. Bergin, A. G. Russell, and G. S. W. Hagler. 2016. Using low cost sensors to measure ambient particulate matter concentrations and on-road emissions factors. Atmos. Meas. Tech. 1–22. doi:10.5194/amt-2015-331.
- Koehler, K. A., and T. M. Peters. 2015. New methods for personal exposure monitoring for airborne particles. Curr. Environ. Health Rep. 2 (4):399–411. doi:10.1007/s40572-015-0070-z.
- Kulkarni, A., J. H. Lee, J. D. Nam, and T. Kim. 2010. Thin film-coated plastic optical fiber probe for aerosol chemical sensing applications. Sens. Actuators B-Chem. 150 (1):154–159. doi:10.1016/j.snb.2010.07.026.
- Lee, M.-H., J.-H. Kim, P. Biswas, S.-S. Kim, Y. J. Suh, H. D. Jang, S. H. Bhang, T. Yu, J.-H. Kim, and K. Cho. 2016. Enhanced collection efficiency of nanoparticles by electrostatic precipitator with needle-cylinder configuration. J. Nanosci. Nanotechnol. 16 (7):6884–6888. doi:10.1166/jnn.2016.11322.
- Li, R. K., H. P. Loock, and R. D. Oleschuk. 2006. Capillary electrophoresis absorption detection using fiber-loop ring-down spectroscopy. Anal. Chem. 78 (16):5685–5692. doi:10.1021/ac060289o.
- Lin, P., L. T. Fleming, S. A. Nizkorodov, J. Laskin, and A. Laskin. 2018. Comprehensive molecular characterization of atmospheric brown carbon by high resolution mass spectrometry with electrospray and atmospheric pressure photoionization. Anal. Chem. 90 (21):12493–12502. doi:10.1021/acs.analchem.8b02177.
- Ma, Z. S., Y. H. Zheng, Y. N. Cheng, S. Xie, X. Y. Ye, and M. S. Yao. 2016. Development of an integrated microfluidic electrostatic sampler for bioaerosol. J. Aerosol Sci. 95:84–94. doi:10.1016/j.jaerosci.2016.01.003.
- Marple, V. A., and C. M. Chien. 1980. Virtual impactors: a theoretical study. Environ. Sci. Technol. doi:10.1021/es60168a019.
- Marple, V. A., K. L. Rubow, and S. M. Behm. 1991. A microorifice uniform deposit impactor (moudi): description, calibration, and use. Aerosol Sci. Technol. 14 (4):434–446. doi:10.1080/02786829108959504.
- Marple, V. A., K. L. Rubow, and B. A. Olson. 1995. Diesel exhaust/mine dust virtual impactor personal aerosol sampler: Design, calibration and field evaluation. Aerosol Sci. Technol. 22 (2):140–150. doi:10.1080/02786829408959735.
- Morrow, P. E., and T. T. Mercer. 1964. A point-to-plane electrostatic precipitator for particle size sampling. Am. Ind. Hygiene Assoc. J. 25 (1):8–14. doi:10.1080/00028896409342547.
- Nakayama, T., Y. Matsumi, K. Kawahito, and Y. Watabe. 2018. Development and evaluation of a palm-sized optical pm2.5 sensor. Aerosol Sci. Technol. 52 (1):2–12. doi:10.1080/02786826.2017.1375078.
- Njalsson, T., and I. Novosselov. 2018. Design and optimization of a compact low-cost optical particle sizer. J. Aerosol Sci. 119:1–12. doi:10.1016/j.jaerosci.2018.01.003.
- Novosselov, I. V., and P. C. Ariessohn. 2014. Rectangular slit atmospheric pressure aerodynamic lens aerosol concentrator. Aerosol Sci. Technol. 48 (2):163–172. doi:10.1080/02786826.2013.865832.
- Novosselov, I. V., R. A. Gorder, J. A. Van Amberg, and P. C. Ariessohn. 2014. Design and performance of a low-cost micro-channel aerosol collector. Aerosol Sci. Technol. 48 (8):822–830. doi:10.1080/02786826.2014.932895.
- Pan, Y. L. 2015. Detection and characterization of biological and other organic-carbon aerosol particles in atmosphere using fluorescence. J. Quant. Spectrosc. Radiat. Transfer 150:12–35. doi:10.1016/j.jqsrt.2014.06.007.
- Panne, U., R. E. Neuhauser, M. Theisen, H. Fink, and R. Niessner. 2001. Analysis of heavy metal aerosols on filters by laser-induced plasma spectroscopy. Spectrochim. Acta Part B-Atomic Spectrosc. 56 (6):839–850. doi:10.1016/S0584-8547(01)00209-9.
- Pardon, G., L. Ladhani, N. Sandstrom, M. Ettori, G. Lobov, and W. van der Wijngaart. 2015. Aerosol sampling using an electrostatic precipitator integrated with a microfluidic interface. Sens. Actuators B-Chem. 212:344–352. doi:10.1016/j.snb.2015.02.008.
- Pope, C. A., R. T. Burnett, G. D. Thurston, M. J. Thun, E. E. Calle, D. Krewski, and J. J. Godleski. 2004. Cardiovascular mortality and long-term exposure to particulate air pollution - epidemiological evidence of general pathophysiological pathways of disease. Circulation 109 (1):71–77. doi:10.1161/01.CIR.0000108927.80044.7F.
- Roux, J. M., R. Sarda-Esteve, G. Delapierre, M. H. Nadal, C. Bossuet, and L. Olmedo. 2016. Development of a new portable air sampler based on electrostatic precipitation. Environmental Sci. Pollution Res. 23 (9):8175–8183. doi:10.1007/s11356-015-5522-3.
- Sacks, M. S., D. B. Smith, and E. D. Hiester. 1997. A small angle light scattering device for planar connective tissue microstructural analysis. Ann. Biomed. Eng. 25 (4):678–689. doi:10.1007/BF02684845.
- Samburova, V., J. Connolly, M. Gyawali, R. L. N. Yatavelli, A. C. Watts, R. K. Chakrabarty, B. Zielinska, H. Moosmuller, and A. Khlystov. 2016. Polycyclic aromatic hydrocarbons in biomass-burning emissions and their contribution to light absorption and aerosol toxicity. Sci. Total Environ. 568:391–401. doi:10.1016/j.scitotenv.2016.06.026.
- Seagrave, J. C., J. D. McDonald, M. D. Reed, S. K. Seilkop, and J. L. Mauderly. 2005. Responses to subchronic inhalation of low concentrations of diesel exhaust and hardwood smoke measured in rat bronchoalveolar lavage fluid. Inhalation Toxicol. 17 (12):657–670. doi:10.1080/08958370500189529.
- Sengupta, A., M. L. Laucks, N. Dildine, E. Drapala, and E. J. Davis. 2005. Bioaerosol characterization by surface-enhanced raman spectroscopy (sers). J. Aerosol Sci. 36 (5–6):651–664. doi:10.1016/j.jaerosci.2004.11.001.
- Seto, E., E. Austin, I. Novosselov, and M. Yost. 2014. Use of low-cost particle monitors to calibrate traffic-related air pollutant models in urban areas. In International Congress on Environmental Modelling and Software.
- Shanthil, M., H. Fathima, and K. G. Thomas. 2017. Cost-effective plasmonic platforms: Glass capillaries decorated with ag@sio2 nanoparticles on inner walls as SERS substrates. ACS Appl. Mater. Interfaces 9:19470–19477. doi:10.1021/acsami.6b12478.
- Sheesley, R. J., M. Mieritz, J. T. DeMinter, B. R. Shelton, and J. J. Schauer. 2015. Development of an in situ derivatization technique for rapid analysis of levoglucosan and polar compounds in atmospheric organic aerosol. Atmos. Environ. 123:251–255. doi:10.1016/j.atmosenv.2015.10.047.
- Singh, P., D. M. DeMarini, C. A. J. Dick, D. G. Tabor, J. V. Ryan, W. P. Linak, T. Kobayashi, and M. I. Gilmour. 2004. Sample characterization of automobile and forklift diesel exhaust particles and comparative pulmonary toxicity in mice. Environ. Health Perspect. 112 (8):820–825. doi:10.1289/ehp.6579.
- Sivaprakasam, V., H. B. Lin, A. L. Huston, and J. D. Eversole. 2011. Spectral characterization of biological aerosol particles using two-wavelength excited laser-induced fluorescence and elastic scattering measurements. Opt. Express 19 (7):6191–6208. doi:10.1364/OE.19.006191.
- Tao, S. Q., S. D. Gong, J. C. Fanguy, and X. M. Hu. 2007. The application of a light guiding flexible tubular waveguide in evanescent wave absorption optical sensing. Sens. Actuators B-Chem. 120 (2):724–731. doi:10.1016/j.snb.2006.03.039.
- Trichel, G. W. 1938. The mechanism of the negative point to plane corona near onset. Phys. Rev. 54 (12):1078–1084. doi:10.1103/PhysRev.54.1078.
- Volckens, J., C. Quinn, D. Leith, J. Mehaffy, C. S. Henry, and D. Miller-Lionberg. 2017. Development and evaluation of an ultrasonic personal aerosol sampler. Indoor Air 27 (2):409–416. doi:10.1111/ina.12318.
- Waechter, H., J. Litman, A. H. Cheung, J. A. Barnes, and H. P. Loock. 2010. Chemical sensing using fiber cavity ring-down spectroscopy. Sensors 10 (3):1716–1742. doi:10.3390/s100301716.
- Weiss, S. 1999. Fluorescence spectroscopy of single biomolecules. Science. 283 (5408):1676–1683. doi:10.1126/science.283.5408.1676.
- Yu, X., W. Song, Q. Q. Yu, S. Li, M. Zhu, Y. L. Zhang, W. Deng, W. Q. Yang, Z. H. Huang, X. H. Bi, and X. M. Wang. 2018. Fast screening compositions of pm2.5 by atr-ftir: Comparison with results from IC and OC/EC analyzers. J. Environ. Sci. 71:76–88. doi:10.1016/j.jes.2017.11.021.
- Zheng, L. N., P. Kulkarni, K. Zavvos, H. Y. Liang, M. E. Birch, and D. D. Dionysiou. 2017. Characterization of an aerosol microconcentrator for analysis using microscale optical spectroscopies. J. Aerosol Sci. 104:66–78. doi:10.1016/j.jaerosci.2016.11.007.