
 ?Mathematical formulae have been encoded as MathML and are displayed in this HTML version using MathJax in order to improve their display. Uncheck the box to turn MathJax off. This feature requires Javascript. Click on a formula to zoom.
Abstract
The physical, chemical, and biological properties of an aerosol droplet/particle are dependent on the morphology of the droplet/particle itself; for example, a liquid droplet will be processed by oxidants in the gas phase in a fundamentally different way than a solid particle. Additionally, given their small size, aerosol droplets may change phase over timescales in the order of milliseconds (e.g., deliquescence or crystallisation). Thus, ability to rapidly and easily estimate the morphology of a droplet/particle is critical, especially in the interpretation of complex aerosol processes such as spray drying and dissolution. To be reported here is a novel method that uses the forward scattered light (∼32° < θ < ∼58°) passed through a droplet to determine the droplet/particles morphology. The algorithm was developed through the qualitative analysis of over one million individual phase functions of various particle morphologies. The algorithm can differentiate between four different morphologies: homogeneous, core/shell, with inclusions, and non-spherical/inhomogeneous. The algorithm is applicable to droplets between ∼5 to ∼30 microns in radius. The rate of phase analysis is dependent on the rate in which the light scatter can be collected, in the data presented here a particle’s morphology is reported every 10 milliseconds. The accuracy of the phase identification with the algorithm proposed in this work is very high (>90%); its utility is strengthened by the high frequency of the collection of scattered light, which allows an individual droplet to be probed upwards of over 100 times per second. Although not absolute on every phase function analysis, when coupled with repetition and high throughput, the algorithm presented here can be a valuable tool to easily and readily determine particle morphology in dynamic aerosol systems.
Copyright © 2019 American Association for Aerosol Research
EDITOR:
1. Introduction
The importance of understanding the phase behaviour of aerosols for modelling climate (aerosol radiative forcing) (Kellogg Citation1992; Service Citation2008), health (particulate air pollution/healthcare) (Farkas et al. Citation2017; Haddrell et al. Citation2017; Hadiwinoto, Kwok, and Lakerveld Citation2018) and industrial applications (spray drying [Amstad et al. Citation2015; Hadiwinoto, Kwok, and Lakerveld Citation2018]) is well appreciated. Sources and environmental conditions (e.g., temperature and relative humidity [RH]) dictate the size, composition, and physical phase and structure of aerosol particles (Adachi, Chung, and Buseck Citation2010; Adachi, Freney, and Buseck Citation2011). In turn, the interplay between these characteristics influences the role of the aerosol in atmospheric processes (scattering and absorption of radiation [Adachi, Freney, and Buseck Citation2011; Lambe et al. Citation2013]) activity as ice nucleating particles (Ignatius et al. Citation2016; Lambe et al. Citation2011) and human health (deposition, dissolution dynamics, hygroscopic growth [Haddrell et al. Citation2014; Haddrell, Davies, and Reid Citation2015; Haddrell et al. Citation2017]).
The morphology of an individual aerosol particle depends on its chemical composition and on the properties of the gas phase surrounding it. For example, inorganic salt particles can be found either in a liquid or crystalline state depending on the gas phase RH and on their crystallisation/deliquescence RHs (Pandis, Wexler, and Seinfeld Citation1995), and organic particles containing viscous material can be in a liquid, semi-solid (viscosity above 102 Pa s) or solid state depending on the surrounding RH and temperature (Reid et al. Citation2018). Given their small size and high surface-to-volume ratio, the size and chemical composition of individual aerosol particles are dynamic and constantly evolving through interactions with the gas phase (Damschen and Martin Citation1983; Rovelli et al. Citation2017). For example, such changes may occur through the uptake and loss of water or other semi-volatile organic and inorganic species, and heterogeneous chemical reactions with oxidants in the gas phase (Damschen and Martin Citation1983). Indeed, the physical state of a particle itself will affect how it is processed (Wadia et al. Citation2000). For example, the presence of an organic monolayer or shell on the surface of a droplet can affect the mass flux of volatile components to and from the particle (Davies et al. Citation2013). Additionally, heterogenous reactivity between the gas phase and the aerosol condensed phase differs for liquid, semisolid and solid particles (Wadia et al. Citation2000). The diffusion rates of molecules within a viscous matrix, such as that of secondary organic aerosols, can span over eight orders of magnitude (Price et al. Citation2014) and therefore result in inhomogeneities in chemical composition within a particle (Marshall et al. Citation2018; Song et al. Citation2016). Furthermore, the presence of an organic-rich shell or of a monolayer of organic surfactants will affect the surface tension of aerosol droplets and their ability to act as cloud condensation nuclei (Bzdek et al. Citation2016). Thus, to fully understand the dynamic behaviour of aerosol particles in these many varied and complex situations, one must have a good understanding of their physical structure and the way their morphology changes with time.
The goal of this work is to provide high time resolution of 10 ms, long time scale measurements of evolving morphology for a single particle in response to a change in composition. To do this, the dynamic behaviour of individual trapped droplets in the gas phase is probed using elastic light scattering.
Single aerosol particle techniques have been used in the laboratory for refined investigations of the chemical-physical properties (i.e., viscosity, hygroscopicity, optical properties, volatility) and chemical reactivity of aerosol (Krieger, Marcolli, and Reid Citation2012; Marsh et al. Citation2017b). The ability to track the evolution of the morphology of a single particle could provide essential insights into complex processing and evolution of particles in all the fields of aerosol science. In a recent study, holographic imaging has been used to image the three-dimensional structure of a single levitated particle (David et al. Citation2018). The images collected from this technique are detailed with a spatial resolution of 770 nm, accurate and can be used to infer much about the physical properties of a particle, but a dedicated experimental setup for holography is required. Furthermore, if the droplet is spherical but has multiple phases, such as core-shell type structure or with inclusions, holography does not identify the presence of these internal structures. Raman spectroscopy on optically tweezed droplets has been used to detect the deviation from a spherical geometry upon coalescence of two aerosol particles (Power et al. Citation2013) and to identify spherical droplets with a core-shell morphology (Gorkowski, Donahue, and Sullivan Citation2017; Citation2018; Stewart et al. Citation2015). The frequency of these analysis are typically around 1 Hz and up to 0.5 Hz (Gorkowski, Donahue, and Sullivan Citation2017). Despite these examples, there is a clear need for new approaches that allow a more comprehensive classification of the morphology of single aerosol particles in a simple, cost effective, rapid and reliable way during rapid transformation processes, such as the evaporation of water, that can lead to changes in particle morphology.
There are many ways to trap an individual droplet in the gas phase (with controlled temperature and relative humidity conditions) for subsequent probing, such as optical, acoustic and electrodynamic (Krieger, Marcolli, and Reid Citation2012). The ability to trap an individual droplet in an electrodynamic field and probe both its relative mass and absolute radius has been possible for decades; one such trap is the comparative kinetic electrodynamic balance (CK-EDB) (Rovelli et al. Citation2016).
The CK-EDB utilizes droplet on demand dispensers to produce aerosol droplets whose initial diameter ranges from ∼60 mm to ∼30 mm; the starting solution is known, thus allowing control over starting size and composition. Once trapped, a laser illuminates the droplet/particle and the light scattering pattern in the near-forward direction (at a central viewing angle of 45°) is typically recorded. If the droplet is spherical and homogeneous, a characteristic elastic light scattering pattern, referred to as “phase function,” is produced and it can be described by Mie theory (Mie Citation1908) (. In the literature, collected phase functions (or the angular positions of the peaks in the phase function) (Davies Citation2019) are usually fitted with a library of Mie theory simulations and the best-fit provides information on the size and refractive index of a spherical homogeneous particle (Reid and Mitchem Citation2006).
Figure 1. Example phase functions for four different particle types. For both (a) and (b), fitted phase functions from Mie theory and experimental data are shown. The composition of the individual droplets is: (a) water, (b) dodecanol-water, (c) ethylene glycol with polystyrene nanospheres and (d) dry sodium chloride.
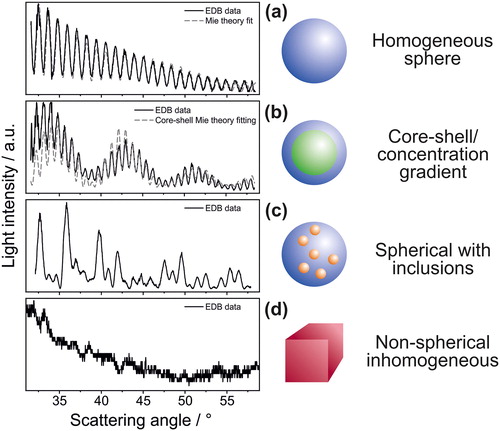
The morphology of a particle has also been qualitatively inferred from phase functions (Archer et al. Citation2017; Jakubczyk et al. Citation2004; Kramer et al. Citation1999; Krieger and Meier Citation2011; Riefler, Schuh, and Wriedt Citation2007; Tong et al. Citation2015). If a particle is non-spherical and/or inhomogeneous, the basic assumptions underlying Mie theory are not satisfied and the light scattering patterns from such aerosol particles are markedly different from the case of a homogeneous sphere (Mie Citation1908) (. The qualitative form of the phase function is characteristic of the morphology of the particle considered (). Specifically, spherical droplets characterised by a core-shell morphology show peaks in the scattering patterns that are similar to the homogeneous case, but a secondary and predictable structure is observed in the overall scattering pattern, represented by the evident periodic fluctuations in the intensity of these oscillations. In the case of spherical droplets containing inclusions, the intensity of the scattered light at a certain angle can be either enhanced or suppressed by the random positioning of the inclusions within the droplet volume. In this case, the resulting phase function presents equally-spaced peaks that is similar to the homogeneous sphere case but characterised by a less regular intensity pattern. Finally, the light scattering pattern arising from a non-spherical/inhomogeneous particle (e.g., crystalline salt particles from crystallisation processes) is less structured and less intense, depending on the degree of ‘sphericity’ maintained by the particle during and after the crystallisation process.
In this manuscript, starting from these qualitative observations of the different features that characterise the elastic light scattering associated to particles with known and variable morphology, we present a robust semi-quantitative protocol to determine the morphology of an individual aerosol particle based solely on the form of the phase function. The algorithm presented is based on experimental observations of over one million individual light scattering patterns and is capable of categorizing the morphology of aerosol particles into four groups: homogeneous spherical, core-shell spherical (or spherical with a concentration gradient), spherical with inclusions, or inhomogeneous/non-spherical.
2. Methods
2.1. Comparative kinetic electrodynamic balance (CK-EDB)
The ability to study the dynamic behaviour of an individual droplet with a CK-EDB has been reported extensively in the literature (Marsh et al. Citation2017a; Rovelli et al. Citation2016, Citation2017). A schematic of the experimental setup can be found in the supplementary information (SI; Figure S1).
The reservoir of a droplet-on-demand dispenser (MicroFab) is filled with a solution of chosen composition. The application of a square waveform to the piezoelectric crystal results in a compression wave that passes through the dispenser’s orifice and initiates the formation of a jet which forms droplets of uniform size with each pulse. A DC voltage is applied to an induction electrode, positioned 2-3 mm from the dispenser tip, which leads to an ion imbalance in the jet, resulting in a droplet with a net charge. The presence of this net charge interacting with the electrodynamic field of the CK-EDB leads to confinement of the droplet within the null field point. Once confined, approximately 100 ms after droplet formation, the droplet is illuminated by a 532 nm laser (Laser Quantum, Ventus continuous wave [CW]). A nitrogen gas flow of 200 mL/min at a temperature of 20 °C and a set RH (range from ∼0% to >90%) is passed directly over the droplet. As the droplet changes size, the electrodynamic field is manipulated to account for these changes and ensure that it remains confined within the centre of both the trap and laser beam.
A CCD camera (Thorlabs) collects the light scattered from the droplet in the near-forward direction at a central scattering angle of 45°. Images of the phase function, with an angular range from 32° to 58°, are collected every ∼10 ms providing high time resolution measurements of particle size and morphology. This range was selected as for two reasons: it is readily accessible to numerous other individual droplet analysis devices and the central viewing angle of 45° allows to access the region of the near-forward scattering that corresponds to the range of applicability of the geometric optics approximation (up to 60°) for particle sizing (Glantschnig and Chen Citation1981).
When a droplet is spherical and homogeneous, its radius and refractive index of the droplet can be estimated (using a prescribed relationship between droplet radius and refractive index [Preston and Reid Citation2015]) by fitting a collection of time dependent phase functions with a library of Mie theory simulations (as seen in ). This method is computationally demanding. Alternatively, the absolute radius of the droplet can be inferred from the average angular difference between the maxima within the phase function using the geometrical optics approximation (Glantschnig and Chen Citation1981). This approach allows for rapid analysis of each collected frame in real-time.
2.2. Collective phase function features for different particle morphologies
As mentioned, changes in the morphology of the particle lead to changes in the light scattering pattern (). provides a more extensive set of time-dependent examples of how the phase function of various particle types evolves during a dynamic change in droplet size (e.g., during evaporation).
Figure 2. ∼2,000 individual phase functions of single particles collected over ∼20 s for: (a) homogeneous sphere (H2O droplet into 94% RH), (b) core-shell sphere (dodecanol-water mixture into 50% RH at T = 0 °C), (c) droplet with inclusions (H2O-ethylene glycol mixture with 450 nm diameter polystyrene beads into dry nitrogen) and (d) inhomogeneous non-spherical particle (crystallised NaCl in dry air). While the phase functions shown in are the primary structures phase functions for droplets of a given morphology, these cumulative scans are referred to as the tertiary structure of the phase functions. In panels (a)-(c), the droplets are shrinking, hence the shift of the peaks in the phase functions over time. The colour scale indicates the intensity of the scattering in arbitrary units.
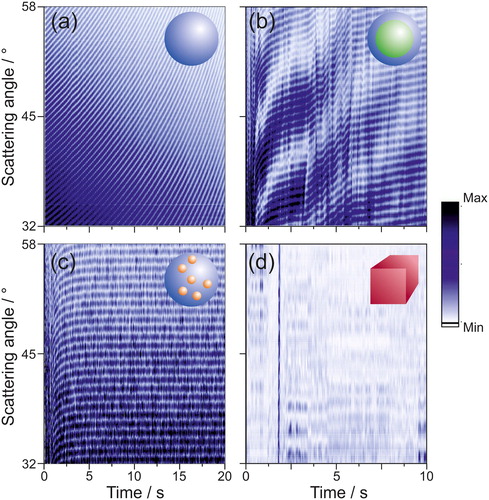
As a homogenous spherical droplet evaporates (, pure water droplet), the reduction in droplet size leads to a decrease in the overall scattered light intensity in the phase function. This is accompanied by both shifts in the angular positions and in the separations between the interference fringes of the phase function. When considered collectively, these 2,000 phase functions of an evaporating homogeneous droplet present a smooth evolution in structure with no irregularities.
A similar general trend in the evolution of the phase function is observed for an evaporating droplet with a core-shell structure (, an evaporating dodecanol-water droplet). This is to be expected given that the morphology of a core-shell droplet preserves a spherical geometry; it consists of two concentric spheres (water core with a dodecanol shell) with a single interface between them, each with a different refractive index. Like in the case of a homogeneous droplet, there are smooth shifts in both peak location and width in the phase functions. However, unlike the homogeneous droplet case, irregularities in the cumulative structure are observed. These periodic fluctuations in intensity result from the irregular structure observed in an individual phase function (. This cumulative structure is unique to droplets with a core-shell morphology.
Droplets that contain inclusions produce complicated and less predictable phase functions (, an evaporating water-ethylene glycol droplet containing 450 nm diameter polystyrene beads), as a result of the random motion of the inclusions within the droplet volume (Gu et al. Citation1993; Ngo and Pinnick Citation1994). However, when the time-evolution of phase functions is considered, a semblance of regularity in the tertiary structure is observed (); despite the noise caused by the presence of inclusions, regular peaks are still present in the light scattering pattern and a coherent evolution is seen with time. During the evaporation of water from the droplet (at times <5 s), the peak position shifts in a similar manner to the homogeneous sphere case. In this particular example, the droplet reaches a constant size after ∼5 s and the positions of the peaks in the phase function do not change. Thus, it is possible to both identify spherical droplets with inclusions from their phase function while simultaneously estimating the overall droplet radius, with the angular position of the peaks unaltered by the presence of inclusions. An example of how the presence of polystyrene beads (450 nm in diameter, initial concentration of 0.014 vol%) within an evaporating water droplet affects light scattering is shown in the SI (Figure S2), together with further discussion on the presence of spherical inclusion on the applicability of geometric optics.
Non-spherical/inhomogeneous particles, such as a crystalline sodium chloride particle, will irregularly scatter laser light (), resulting in a phase function of no regularity over time (), with significant variability from image to image. This characteristic lack of any significant structure in phase function indicates the morphology of the particle, but also makes it near impossible to extract its size (Piedra et al. Citation2019).
The observation of these general trends for hundreds of individual droplets, collectively containing over a million phase functions, were the starting point used to develop an algorithm to predict droplet morphology.
2.3. Assigning droplet/particle morphology from elastic light scattering patterns
There are two components of a phase function that can be exploited to differentiate between different particle morphologies. First, the regularity in the angular separation between the peaks in the phase function (identified as the vertical red lines in phase functions shown in ), which we express in terms of relative standard deviation, RSD, of the average angular separation. Secondly, the relative amplitudes of the peaks at the given angle, which is evaluated by fitting them with polynomial and quadratic curves (see, respectively, the blue and purple curves in the example phase function graphs in ) and by reporting the R2 for the two fits. The order of the polynomial chosen (EquationEquation (1)(1)
(1) ) is a function of the number of peaks present in the phase function (EquationEquation (2)
(2)
(2) ).
(1)
(1)
(2)
(2)
Figure 3. Flow chart of the algorithm used to differentiate between particle types. Starting from the top, if the given condition described in the diamond is true, the droplet structure is described by the term on the right; if the condition is false, the next parameter is considered (down). If none of the parameters are true, the droplet is described as a homogeneous sphere.
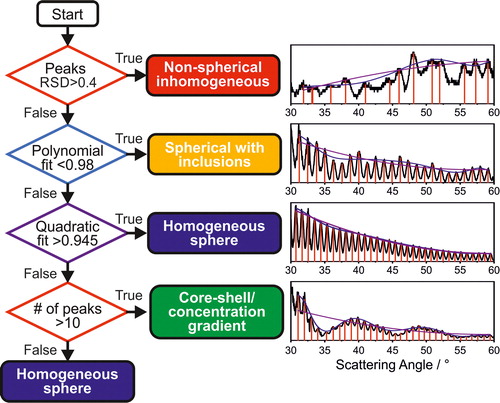
These three parameters (correlation coefficients of the polynomial and quadratic fits and RSD) are utilized in the morphology assignment procedure defined in for each single collected frame.
The sequence of the algorithm to assign particle phase is deliberately chosen as shown. The irregularities in the angular separation between the location of the peaks in the phase function (indicated by RSD > 0.4) is unique to the non-spherical/inhomogeneous morphology and supersedes all the other parameters. A poor polynomial fit through the amplitude and location of the peaks (R2 < 0.98) is unique to the droplets with inclusions, which differentiates it from the remaining morphologies. The R2 for the polynomial fit through the amplitude and location of the peaks is high (R2 > 0.98) for both the homogeneous and core-shell droplet types and they can only be differentiated from the quadratic fit (threshold set at R2 = 0.945). When the overall number of peaks within the monitored angular range is below 10 (typically for droplets below ∼6 microns in radius), there are insufficient features in the phase function to differentiate between a homogeneous and core-shell droplet. In this case, the algorithm automatically assigns the phase function to the homogeneous sphere category.
The thresholds (R2 values) used to differentiate between the various particle types are identified through a survey of over a million individual phase functions collected for all particle types (. Typical correlation plots for three particle types are shown in , where each dot signifies the quadratic and polynomial fits collected from an individual phase function.
Figure 4. (a) Relationship between particle morphology and the correlation coefficients of the quadratic and polynomial fits of the peaks amplitudes in the corresponding phase functions described in ; the colour indicates particle type: yellow (inclusions), blue (homogeneous) and green (core-shell). (b) Typical experimental data for three individual evaporating particles (water – blue, dodecanol-water – green and glycerol with nanospheres – yellow); the colour indicates the “real” morphology of each individual particle and rather than the morphology assigned with the proposed algorithm at any given point.
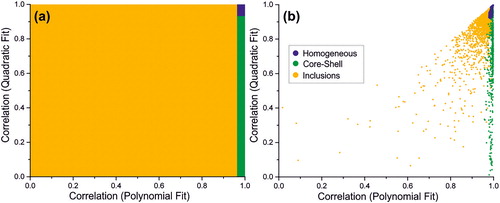
The slight overlap of datapoints belonging to droplets with different morphologies in is indicative of the uncertainty associated to the proposed algorithm. In correspondence to the boundaries indicated in , there are some cases for which the proposed approach could result in an incorrect assignment of the droplet morphology. The data presented in the Results section relative to well-defined model aerosol systems for the four considered droplets morphologies demonstrate that instances of misdiagnosis are far less common than the accurate assignments. Thus, collecting the phase functions at a frequency of 100 Hz helps to address this issue, as the majority of the assignments are accurately made (>90%), far outweighing the instances of misdiagnosis. The accuracy is further improved by grouping the data in time bins and reporting the mode (e.g., the most frequently attributed morphology) for each of the specified bin, with a bin size of typically 5 datapoints; note that binning the data reduces the time resolution (e.g., a bin size of 5 will reduce the frequency from 100Hz to 20Hz). The uncertainties associated to such instances of misdiagnosis are examined in the Results and Discussion sections.
3. Results
In this Section, data collected for single aerosol particles generated from solutions or suspensions of known chemical composition are presented. We use these well-characterised aerosol systems to demonstrate the capability of the algorithm discussed in Section 2.3 to discriminate between homogeneous spheres, core-shell/concentration gradient spheres, spheres with inclusions and non-spherical/inhomogeneous particles.
3.1. Homogeneous sphere
The regularity of a phase function of an evaporating homogeneous droplet (e.g., ) results in an accurate assignment of the droplet morphology (). Data in refer to three systems that are expected to be completely homogeneous throughout the droplet evaporation: a pure water droplet, a water/NaCl droplet into high RH and a water/glycerol droplet.
Figure 5. The assigned morphology of droplets during their evaporation from 3 different starting chemical compositions as a function of time. (a) Pure water (RH = 94%), (b) NaCl solution (80% RH) and (c) Glycerol solution (0% RH). (d), (e) and (f) show the correlation coefficients of the polynomial and quadratic fits of the peaks of the phase function; the colour scale indicates time from the droplet generation.
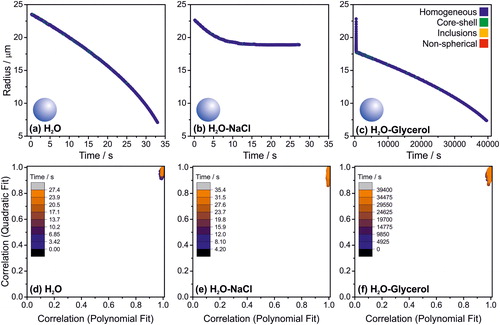
The phase function was collected at a frequency of ∼100 Hz permitting an assignment of the morphology of the droplet ∼100 times every second. In the experiments presented in , this is equivalent to the characterisation of over 3000 individual phase functions each. A reduction in the time resolution was used for the evaporation of glycerol following the initial rapid evaporation of water (0.1 Hz, ∼4000 individual phase functions), a consequence of the much slower evaporation and longer experimental timescale. For the three homogeneous droplet cases considered, the instances of misattribution correspond to ∼1% of the overall number of datapoints.
As shown in , the correlation coefficients of the polynomial and quadratic fits are critical for assigning the particle’s morphology (). Collectively, the data shown in demonstrate that the algorithm is readily capable of identifying homogenous droplets regardless of size, composition and dynamic behaviour (i.e., evaporation rate).
3.2. Core-shell/concentration gradient droplets
The morphology of a core-shell droplet ranges from a homogeneous droplet of unspecified radius with a surface monolayer to a droplet with a single inclusion of variable size. As shown in and , droplets with a radius between ∼5 and ∼30 microns and a core-shell morphology produce a distinct phase function in the near-forward scattering direction. In this section, the sensitivity of the phase function (in the near-forward scattering direction) to shell thickness is explored.
A major advantage of using the CK-EDB to produce model droplets is that the complete composition of the droplet at generation is known; this is because of the short timescale (∼100 ms) between the droplet generation and its confinement. Thus, the complete composition throughout the entire droplet history can be inferred. The evaporation of single droplets generated from a solution containing ethanol (47.5 vol%), water (23.9 vol%) and dodecanol (28.6 vol%) was studied using the CK-EDB. shows the evaporation profile of an individual dodecanol-ethanol-water droplet presenting three distinct stages during evaporation. In the first stage of the evaporation profile (<0.5 s) all the ethanol evaporates (Gregson et al. Citation2019). During and immediately following the evaporation of ethanol, the droplet appears to have inclusions for approximately one second before a core (water)-shell (dodecanol) morphology is formed (around ∼0.5 s). During and following ethanol evaporation, dodecanol forms distinct organic domains within the aqueous phase that migrate to the surface of the droplet, eventually forming a shell (inset, . It has been previously reported that the transition from a homogenous droplet to a core-shell morphology is mediated by surfactants first forming micelles and successively two distinct liquid phases (Nandy and Dutcher Citation2018). The ability to observe this rapid transition period in the aerosol phase solely through the analysis of the phase function is a good example of the capability of this experimental approach, where the evolving morphology of a single particle can be probed at a high time resolution (in this case at a frequency of 20 Hz).
Figure 6. (a) The evaporation profile of a droplet initially composed of water, ethanol and dodecanol at an RH of ∼80%. Included is a simulation (Kulmala, Vesala, and Wagner Citation1993) of the evaporation of a pure water droplet with the same initial size into an airflow with an RH of 80%. (b) The correlation coefficients of the polynomial and quadratic fits of the peaks of the phase function; the colour scale indicates time from the droplet generation. (c) 2,400 individual phase functions of a dodecanol/water/ethanol droplet as a function of time. During this time, the morphology of the droplet goes from having inclusions, to core-shell to homogeneous. (d) Percent volume of the droplet that is water (core) as water and ethanol evaporates. (e) Droplet size against its shell thickness to core radius ratio, as the droplet evaporates; 4 different droplets shown.
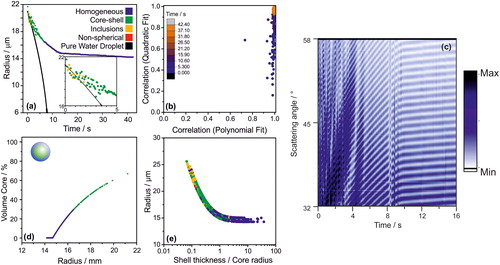
During the second portion of the evaporation profile (, after ∼0.5 s), water slowly evaporates from the droplet over the course of ∼12 s, at a slower rate than the case of a pure water droplet with similar initial size (shown in in black for comparison). This is common for any evaporating droplet with a significant mass fraction of solute (Rovelli et al. Citation2016). It has been previously reported that dodecanol readily forms a monolayer on the droplet surface at 283 K that kinetically limits the evaporation of water, but not at 293 K (Davies et al. Citation2013). A similar process is observed here with a significant change in the evaporation rate of water observed. Notably, a core-shell morphology is formed rather than a monolayer due to the substantial concentration of dodecanol in the droplet (28.6 vol%). The majority of the water is removed from the droplet within 15 s, after which dodecanol evaporates more slowly from the droplet.
After about 8 s, even though the water content is clearly still not at equilibrium with the gas phase, the core-shell morphology is no longer detectable (), suggesting that the droplet is either homogenous, or the shell is too thick to lead to detectable irregularities in the light scatter, or is possibly forming an engulfed structure (Reid et al. Citation2011). For example, in a 50:50 by volume mixture of octanol and water, while the water-rich phase is nearly pure (99.99% water), the octanol-rich layer is 20.7 mol% (3% by volume) water (Tse and Sandler Citation1994). The specific values for dodecanol is similar (3% by weight) (Stephenson and Stuart Citation1986). At the point where the droplet is detected as homogeneous, the droplet is composed of ∼30% water by volume (. Thus, even though a fraction of the water in the droplet is dissolved in the organic phase, these data suggest that the morphology of the droplet is likely still core-shell where the shell is too large for the core to significantly affect the light scattering pattern.
The structural change in the droplet is readily apparent when all the phase functions are observed simultaneously (. During the initial 12 s, the characteristic fluctuations in intensity of a core-shell droplet is apparent, similarly to what observed in . After 12 s, the cumulative phase functions become consistent and typical of a homogeneous droplet (. The utility of looking at dynamic changes in the phase functions to confirm the algorithm identification is clearly demonstrated here.
Finally, the third portion of the evaporation profile of this water-ethanol-dodecanol droplet (after ∼12 s, ) corresponds to the slow evaporation of dodecanol (together with the appropriate amount of solvation water to maintain an equilibrium composition) from a homogeneous droplet; after ∼12 s, most of the water initially present had evaporated. Based on AIOMFAC (Zuend et al. Citation2011) calculations, ∼1.2% of the droplets mass is water in a dodecanol/water mixture at an RH of 80%.
Droplets studied with the CK-EDB have a known starting composition and size. Thus, the sensitivity of the algorithm to assign the particle morphology as a function of the shell thickness/core radius versus particle size can be quantified (. For the estimation of the core radius and the shell thickness (x-axis in ), the assumption must be made that all the water in the droplet is in the core (Kwamena, Buajarern, and Reid Citation2010). While the complete chemical composition of the dodecanol/water droplets probed with the CK-EDB is known, its precise morphology is inferred to be completely phase separated. This assumption can be confirmed with the method by Kawamena et al. (Kwamena, Buajarern, and Reid Citation2010), which predicts a core-shell morphology for a water/dodecanol droplet, based on the water/air, dodecanol/air and dodecanol/water surface tensions (72.8 nN/m, 29.4 nN/m [Daubert and Danner Citation1989] and 7 nN/m [Villers and Platten Citation1988], respectively). However, the degree of water uptake by the organic phase cannot be easily quantified. The data in show that when the core radius is greater than half the shell thickness (shell thickness/core radius ratio <2), the phase function algorithm assigns the morphology as core-shell. As the shell thickness becomes comparable to the core radius (shell thickness/core radius ratio ∼1, which corresponds to a volume of the core less than 30% of the total droplet volume), the phase function is similar to that of a homogeneous droplet.
The data shown in cannot be used to identify the lower limit of shell detection (i.e., how thin the shell can become and still be identifiable), due to the formation of micelles during the initial part of the evaporation. Consequently, to estimate the lower limit of shell detection, a very dilute droplet containing a surfactant was probed ().
Figure 7. Evaporation of a droplet initially composed of ethanol, water and hexadecanol (0.35 mM). (a) Radius of droplet injected into an airflow with a relative humidity of 77%. (b) The correlation coefficients of the polynomial and quadratic fits of the peaks of the phase function; the colour scale indicates time from the droplet generation. (c) Evolution of phase functions for the first 4 s of droplet evaporation. (d) Intensity and angle of peaks for five sequential phase functions. 1.808 s is identified as homogeneous while the rest are identified as core-shell. (e) Droplet size against its shell thickness to core radius ratio, as the droplet evaporates; 4 droplets shown.
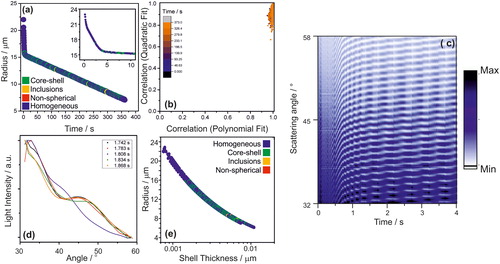
A droplet initially composed of water and ethanol (1:1 volume ratio) and hexadecanol (0.35 mM) was trapped in the CK-EDB and the scattering phase function recorded over time providing an estimate of the evolving droplet size (. There are three distinct sections in the evaporation profile ( initial rapid loss of ethanol (under 1 s, inset in ), followed by evaporation of water until a monolayer is formed (under 4 s, inset in ) and finally slow evaporation of water, whose flux is dramatically slowed by the hexadecanol monolayer at the surface of the droplet (Davies et al. Citation2013). If compared to the water-ethanol-dodecanol mixture, it is notable that micelles are not observed in this case, likely because of the much lower concentration of hexadecanol in the starting solution.
shows the characteristic cumulative evolving structure of the phase function associated with core-shell droplet (. Likewise, the distributions of the correlations of the quadratic and polynomial fits () are similar to those expected for a droplet with a core-shell morphology (). However, during the evaporation process the morphology of the droplet was less clearly defined by the algorithm (), since it periodically varies between core-shell and homogenous. This inconsistency in identification of the morphology from its phase functions can be attributed to how the oscillations of the phase function vary over time. These oscillations in the phase function are typical of droplets with a core-shell morphology (). As the droplet dries, the relative amplitude of each oscillation will vary independently (. As a result, occasionally the peaks will line up such that their locations and amplitudes will be fitted with a good R2 (>0.945) by a quadratic curve (see ). This will cause the specific individual phase function to be attributed to the homogeneous droplet morphology. This alternation between phase functions identified as either homogeneous or core-shell is shown in ; note that this only happens after the monolayer is clearly established, as shown in the inset of .
The sensitivity of the algorithm was explored and was found to be sufficiently sensitive to detect a monolayer (∼0.0025 µm, . This is evidenced by the shift in morphology identification, going from purely homogeneous (<0.001 µm to ∼0.0025 µm) to alternating between core/shell and homogeneous (>0.0025 µm). Once the monolayer is established, 33 ± 4% of the phase functions are identified as core-shell while the remainder identified as homogeneous; note that for homogeneous droplets >99% are correctly identified. This is attributed to a combination of the thinness of the monolayer and the phase function shifts, as shown in . Once the overall size of the droplet is too small, there are no longer enough peaks (less than 10) in the phase function to distinguish between homogenous and core-shell droplets (). This limitation that prevents the discrimination from homogeneous particles is unique to the core-shell morphology and it does not apply to the two cases of a sphere with inclusions and to non-spherical inhomogeneous particles discussed in the next sections.
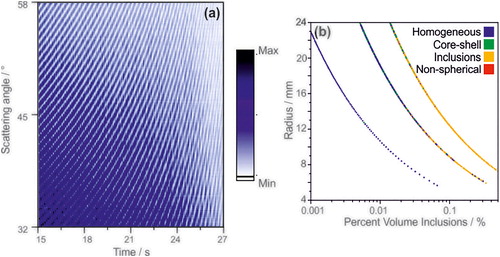
In order to test the proposed algorithm against benchmark data of more precisely defined core-shell systems, the angularly-resolved light scattering arising from core-shell droplets was simulated using a literature Mie scattering model for a coated sphere (Liu et al. Citation2007). Calculations of phase functions were performed for thousands of droplets with a known core-shell morphology where the composition of each phase is homogeneous and the ratios between the core radius and the shell thickness are known (). These simulated phase functions are used to confirm the sensitivity of the algorithm to identify a core-shell morphology. Phase functions were calculated at a wavelength of 532 nm for droplets with a water core (refractive index of 1.335) and an organic shell (refractive index of 1.45). The radius at frame 0 was set at 30 microns, and the core:shell volume ratio was set to 5:1, 20:1 and 100:1 (). As the frame number (i.e., time) is increased, the total radius is reduced by 10 nm (through loss of water from the core while the volume of the shell remains constant), resulting in a net decrease in the core:shell volume ratio. The characteristic cumulative structure associated with the core-shell morphology is observed throughout the droplet “evaporation” in the model ().
Figure 8. Evolution of simulated phase functions for core-shell droplets with volume ratios of water:organic of (a) 5:1, (b) 20:1, and (c) 100:1. Assigned morphology of the droplets in (a)–(c) as a function of total droplet radius and (d) core size or (e) shell thickness.
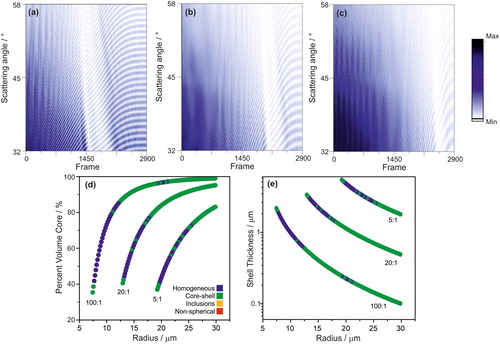
The precise morphologies of the modelled droplets are known and, therefore, the sensitivity of the algorithm to the relative size of the core of the droplet () and absolute shell thickness () can be quantified. Regardless of the starting organic:water volume ratio, when the core is less than 70–80% by volume of the total droplet’s volume the algorithm reports the droplet as homogeneous. This is far less sensitive than observed in the experimental data where the core had to be <30% of the total volume before assignment as homogeneous (. This discrepancy between the morphology assignments for the model and experimentally measured phase functions may be attributed to possible incorrect assumptions made about the refractive indexes of the two phases and possible eccentric positioning of the core in the trapped droplet. However, when the shell thickness is quite thin (<500 nm), the algorithm appears to be particularly sensitive to identifying a core-shell structure (.
3.3. Droplets with inclusions
The Mie solution to light scattering by a sphere assumes that the droplet is spherical and homogeneous (Mie Citation1908). The presence of inclusions (e.g., salt crystals, micelles or nanospheres) in a droplet undermines this assumption, leading to the large irregularities in the intensity of the peaks in the phase function (), whereas the angles of the peaks remain unaltered by the presence of the inclusions (see discussion in Section S2 in the SI). These irregularities in intensity are distinct and associated with the presence of inclusions only (), providing discrimination between spherical droplets with inclusions and a core-shell or homogenous morphology (). In order to test the ability of the algorithm to identify droplets with inclusions, the evaporation of water droplets with various concentrations of polystyrene nanospheres were probed with the CK-EDB (). The sensitivity of the algorithm to the size of inclusions has been tested for glycerol droplets containing equal number concentrations of polystyrene nanosphere with variable diameter (300 and 700 nm) (SI, ). No noticeable difference was observed for the two cases although data on more systems would be needed to assess the lower limit of the size of detectable inclusions.
Figure 9. The evaporation profile of water droplets containing 450 nm diameter polystyrene nanospheres (initial concentrations of nanospheres in solution (a) 0.0051 vol%, (b) 0.014 vol%, and (c) 0.076 vol%) trapped within a CK-EDB. (d)-(f) The correlation coefficients of the polynomial and quadratic fits of the peaks of the phase function; the colour scale indicates time from droplet generation.
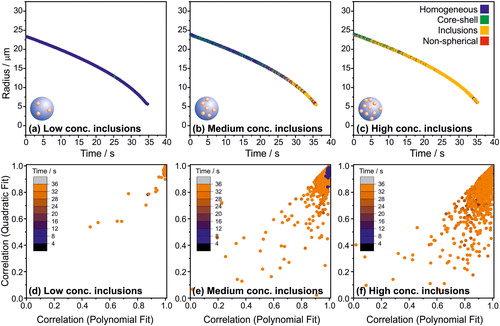
The characteristic cumulative structure associated with droplets with inclusions () is present for the 0.076 vol% initial concentration of inclusions throughout most of the evaporation profile (.
Figure 10. (a) Evolution of phase functions for an evaporating droplet containing 0.076 vol% of 450 nm polystyrene nanospheres. Note that these data are from the same droplet shown in ; the time scale is focussed on the region where inclusions are measurable via the algorithm. (b) The assigned morphology of three droplets as a function of its size and composition.
The sensitivity to the detection of inclusions is dependent on their concentration and not on their absolute number (in , the absolute number of inclusions is constant within a single droplet, whereas their concentration increases as the droplet gets smaller as water evaporates and the overall droplet radius decreases). This is particularly evident in , where it is clear that the algorithm starts to consistently detect the presence of the nanospheres after ∼25 s into the water evaporation. Since the absolute number of nanospheres per droplet trapped in the CK-EDB is known based on the initial solution concentration, the lower limit of detection can be calculated (. If the total volume fraction of the droplet is more than ∼0.04% (for 450 nm spheres), the algorithm correctly identifies the particle as a sphere with inclusions.
3.4. Crystalline/non-spherical particles
As the shape of the droplet becomes less spherical (for example with crystallisation), the characteristic fringes in the light scattering pattern from a homogeneous sphere disappear because of the loss of spherical symmetry. If a certain degree of sphericity is maintained after the crystallization of an aqueous droplet, some peaks may still be observed in correspondence to some relative orientation of the non-spherical droplet and the laser light path (see for example the phase functions for the crystalline/non-spherical particles in and ). However, the spacing between these irregular peaks is not consistent from time frame to time frame (with a correspondingly high RSD, . This is clearly demonstrated by , which shows data for NaCl and ammonium sulphate solution droplets evaporating into a dry nitrogen flow and eventually crystallizing. For completely non-spherical particles, such as cubic particles (crystalline NaCl), the phase function shows no equally-spaced fringes () and for this reason the size retrieved from the geometric optics approximation () appears noisy. This makes identifying crystalline/non-spherical particles relatively straightforward as the phase function is highly irregular and inconsistent from frame to frame ().
Figure 11. (a, c, e). Droplet containing a solution of ammonium sulphate trapped at an RH of 38% for 7 s, then the RH was changed to dry nitrogen. (b, d, f) Droplet containing a solution of NaCl trapped in dry nitrogen. (a, b) Radius change as function of time. Note that once the droplet is crystalized, accurate sizing of the particle from light scattering becomes impossible. (c, d) The relative standard deviation between the peaks in the phase functions over time. (e, f) Evolution of phase functions for the evaporating droplet.
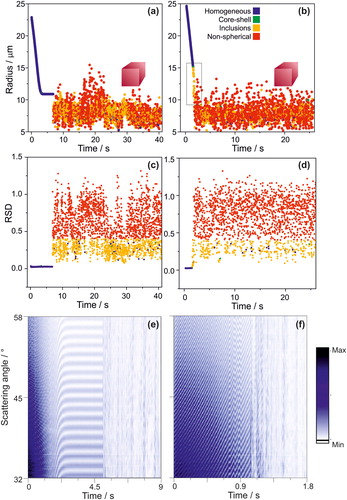
Unique to crystalline particles is the irregularity in the distance between the peaks in the phase function, providing clear justification for using the relative standard deviation of the distance between the peaks in the phase function (RSD, calculated as the ratio between the standard deviation and the average peaks separation) for their identification (). Occasionally, however, the relative distance between the peaks will be similar (through random chance). As a result, as per the algorithm described in , the assigned morphology of an individual phase function may be misidentified. This problem can be addressed by the number of phase functions analysed per second (up to 100), 92–98% of the identifications are accurate. When taken collectively, along with the cumulative images (), the morphology of the particle is clear.
The RSD value of 0.4 was selected as a cut-off point through qualitative analysis of the over one million individual spectra. Phase functions from droplets with inclusions may have some accompanying noise as a result of scattering from the inclusions. Thus, an RSD of 0.4 was chosen as it achieved the balance of correctly identifying the maximum number of droplets whose radius is between 5 and 25 µm with inclusions while simultaneously correctly identifying crystalline droplet at an over 92% accuracy. Again, coupling the predicted morphology from the algorithm () with the cumulative phase function images (), a clear assignment of the morphology of the particle becomes apparent.
A beneficial aspect of using the proposed phase function analysis to identify particle morphology is provided in , allowing identification of the evolving morphology of a NaCl droplet during the crystallization process (, indicated by the highlighted rectangle between 1 and 2 s). The droplet progresses from homogeneous to a droplet with inclusions (visually, the droplet would look like a snow globe), eventually fully crystallizing. This represents a clear example of how the rapid phase analysis presented in this work can be used to probe the fast dynamics of complex processes, such as efflorescence and deliquescence.
4. Discussion
Through the analysis of over a million individual phase functions of numerous experimentally collected and modelled aerosol particles with known chemical composition and morphology, the sensitivity of using phase functions to assign the morphology of a single particle has been assessed ().
Table 1. The morphology of an individual droplet/particle based solely on phase function analysis
In the previous sections, some of the advantages and drawbacks associated with the algorithm have already been mentioned and are summarised here below.
The algorithm is currently limited to droplets with a radius between ∼3 to ∼30 µm in radius. This size range is most ideally suited to process data collected from many single particle instruments. In particular, measurements of aerosol processes with industrial and health applications benefit most significantly from this approach, such as those used in spray drying and drug delivery to the lung. Although informing process models for atmospheric aerosols, the size range is clearly less relevant for actual ambient samples with <1 µm particle size. Furthermore, the phase transitions observed in the droplets sizes in this work may be used to inform observations made for Aerosols across all size ranges. One key feature of the proposed approach is that examining dynamic changes in the light scattering from a droplet (rather than individual isolated frames) minimises the misassignment instances (>90% accurate identification). In addition, the high time resolution of the light scattering measurement (up to 100 Hz) allows an assessment of the dynamic changes in morphology of a particle with high time resolution.
Some considerations related to the analysis of the phase functions for core-shell droplets are necessary. First, the current algorithm cannot discriminate between core-shell particles (two distinct phases with a clear interface) and droplets characterised by a radial concentration gradient (and therefore by a radial refractive index distribution). An example of this is given in Figure S5, where a comparison of simulated phase functions (using MiePlot, http://www.philiplaven.com/mieplot.htm) for droplets of the same overall size but different refractive index radial distributions is shown. In addition, it was found that the ability of the algorithm to detect a core-shell morphology is not very dependent on the difference between the refractive indices of the two phases (see Figure S6 in the Supporting Information), whereas it is more influenced by the radial position of the interface between the core and the shell, as discussed in Section 3.2.
A further caveat is that using the geometric optics approach to size individual droplets is valid for homogeneous droplets (Glantschnig and Chen Citation1981). If the droplet is homogeneous and its refractive index is known, geometric optics provides a good estimated of its size (within ± 100 nm [Rovelli et al. Citation2016]), whereas it fails for crystalline/non-spherical particles. When the droplet has a core-shell morphology, a small shift in the location of the peaks is observed if compared to a homogeneous droplet of the same overall size, meaning that the reported radius may be in error by as much as a micrometre (SI, Figure S4). For droplets with inclusions, while the relative intensity of the peaks may vary because of the presence of scattering inclusions, their location does not, meaning the reported size is accurate (see discussion in the SI, section S2). Thus, correctly assigning the phase of the droplet is key to accurately characterise the uncertainty associated to radius values retrieved with the geometric optics approximation.
Being able to rapidly get information about the morphology of a droplet based solely on its phase function has many applications when studying the dynamic processes occurring on individual particles in studies that can provide exquisite insight into the microphysics occurring in many industrial and environmental applications. For example, the pharmacokinetics of inhaled pharmaceuticals is governed in large part by the morphology of the particle/droplet at the point when it reaches the cell surface (Bhagwat et al. Citation2017). The rate at which an inhaled dry particle from a dry particle inhaler will transfer into the blood stream will be dependent on the degree to which it gets dissolved during inhalation. As a result, the opportunity to interrogate the rapid dissolution dynamics occurring in the aerosol phase directly may be used to improve drug efficacy and potency.
Furthermore, the kinetics of heterogeneous/homogeneous processing of particulate air pollution and specifically of secondary organic aerosol (SOA) is highly dependent on the morphology and viscosity of the particle (Reid et al. Citation2018). The ability to probe the morphology dynamics of such complex organic aerosol systems directly in the aerosol phase is fundamental to understand the impact of SOA on climate, visibility and human health (Reid et al. Citation2018). Studying the dynamics of SOA (or their surrogates) in the laboratory under controlled conditions has provided some detailed information on their formation, equilibration timescales and heterogeneous reactivity (Marsh et al. Citation2017b). Single particles experiments on SOA (or their surrogates) could take great advantage from the simple semi-quantitative characterisation of a particle’s morphology proposed in this work. For example, this algorithm could allow to readily probe inhomogeneities in chemical composition or changes in morphology due to slow diffusion rates of products in viscous droplets undergoing heterogeneous reactions in the lab (products may form a separate domain at the surface if they slowly diffuse to the bulk of a droplet) and kinetic limitations associated to the evaporation of semivolatile components from viscous matrices. Moreover, the approach proposed in this work could allow further insight on some of the properties and behaviours of SOA particles, including their promotion of ice nucleation (Kramer et al. Citation1999) and the occurrence of liquid-liquid phase separation that has been observed to be possible in the form of both phase inclusions and core-shell morphology (Liu et al. Citation2018; Renbaum-Wolff et al. Citation2016).
5. Summary
The ability to readily report the morphology of an individual particle at a frequency of >100 Hz from the droplets/particles phase function has been reported. Through analysing over one million individual phase functions, a robust and rapid algorithm was written to differentiate between four distinct particle types: homogeneous, core/shell, with inclusions and crystalline/non-spherical.
Supplemental Material
Download MS Word (1.7 MB)Data availability
Data are available at the University of Bristol data repository, data.bris, at https://doi.org/10.5523/bris.10.5523/bris.1a6a4k03d08il25t9lwji598qu
Additional information
Funding
Related Research Data
References
- Adachi, K., S. H. Chung, and P. R. Buseck. 2010. Shapes of soot aerosol particles and implications for their effects on climate. J Geophys Res-Atmos 115:D15206.
- Adachi, K., E. J. Freney, and P. R. Buseck. 2011. Shapes of internally mixed hygroscopic aerosol particles after deliquescence, and their effect on light scattering. Geophys. Res. Lett. 38:L13804.
- Amstad, E., M. Gopinadhan, C. Holtze, C. O. Osuji, M. P. Brenner, F. Spaepen, and D. A. Weitz. 2015. Production of amorphous nanoparticles by supersonic spray-drying with a microfluidic nebulator. Science 349 (6251):956–960. doi: 10.1126/science.aac9582.
- Archer, J., M. Kolwas, D. Jakubczyk, G. Derkachov, M. Woźniak, and K. Kolwas. 2017. Evolution of radius and light scattering properties of single drying microdroplets of colloidal suspension. J Quant. Spectrosc. Ra. 202 :168–175. doi: 10.1016/j.jqsrt.2017.08.004.
- Bhagwat, S., U. Schilling, M. J. Chen, X. Y. Wei, R. Delvadia, M. Absar, B. Saluja, and G. Hochhaus. 2017. Predicting pulmonary pharmacokinetics from in vitro properties of dry powder inhalers. Pharm. Res. 34 (12):2541–2556. doi: 10.1007/s11095-017-2235-y.
- Bzdek, B. R., R. M. Power, S. H. Simpson, J. P. Reid, and C. P. Royall. 2016. Precise, contactless measurements of the surface tension of picolitre aerosol droplets. Chem. Sci. 7 (1):274–285. doi: 10.1039/C5SC03184B.
- Damschen, D. E., and L. R. Martin. 1983. Aqueous aerosol oxidation of Nitrous-Acid by O-2,O-3 and H2o2. Atmos. Environ. 17 (10):2005–2011. doi: 10.1016/0004-6981(83)90357-8.
- Daubert, T. E., and R. P. Danner. 1989. Physical and thermodynamic properties of pure chemicals data compilation. Taylor and Francis, Washington, D.C.
- David, G., K. Esat, I. Thanopulos, and R. Signorell. 2018. Digital holography of optically-trapped aerosol particles. Commun. Chem. 1 (1):46. doi: 10.1038/s42004-018-0047-6.
- Davies, J. F. 2019. Mass, charge and radius of droplets in a linear quadrupole electrodynamic balance. Aerosol. Sci. Tech. 53 (3):309–320.
- Davies, J. F., R. E. H. Miles, A. E. Haddrell, and J. P. Reid. 2013. Influence of organic films on the evaporation and condensation of water in aerosol. Proc. Natl. Acad. Sci. U.S.A 110 (22):8807–8812. doi: 10.1073/pnas.1305277110.
- Farkas, A., D. Lewis, T. Church, A. Tweedie, F. Mason, A. E. Haddrell, J. P. Reid, A. Horvath, and I. Balashazy. 2017. Experimental and computational study of the effect of breath-actuated mechanism built in the NEXThaler (R) dry powder inhaler. Int. J. Pharmaceut. 533 (1):225–235. doi: 10.1016/j.ijpharm.2017.09.057.
- Glantschnig, W. J., and S. H. Chen. 1981. Light-Scattering from water droplets in the Geometrical-Optics approximation. Appl. Optics 20 (14):2499–2509. doi: 10.1364/AO.20.002499.
- Gorkowski, K., N. M. Donahue, and R. C. Sullivan. 2017. Emulsified and liquid liquid Phase-Separated states of alpha-Pinene secondary organic aerosol determined using aerosol optical tweezers. Environ. Sci. Technol. 51 (21):12154–12163. doi: 10.1021/acs.est.7b03250.
- Gorkowski, K., N. M. Donahue, and R. C. Sullivan. 2018. Emerging investigator series: determination of biphasic core-shell droplet properties using aerosol optical tweezers. Environ. Sci–Proc. Imp. 20 :1512–1523. doi: 10.1039/C8EM00166A.
- Gregson, F., M. Ordoubadi, R. E. H. Miles, A. E. Haddrell, D. Barona, D. Lewis, and J. P. Reid. 2019. Studies of competing evaporation rates of multiple volatile components from a single Binary-Component aerosol droplet. Phys. Chem. Chem. Phys. 21 (19):9709–9719.
- Gu, J., T. E. Ruekgauer, J. G. Xie, and R. L. Armstrong. 1993. Effect of particulate seeding on microdroplet angular scattering. Opt. Lett. 18 (16):1293–1295. doi: 10.1364/ol.18.001293.
- Haddrell, A. E., J. F. Davies, R. E. H. Miles, J. P. Reid, L. A. Dailey, and D. Murnane. 2014. Dynamics of aerosol size during inhalation: Hygroscopic growth of commercial nebulizer formulations. Int. J. Pharmaceut. 463 (1):50–61. doi: 10.1016/j.ijpharm.2013.12.048.
- Haddrell, A. E., J. F. Davies, and J. P. Reid. 2015. Dynamics of particle size on inhalation of environmental aerosol and impact on deposition fraction. Environ Sci Technol 49 (24):14512–14521. doi: 10.1021/acs.est.5b01930.
- Haddrell, A. E., D. Lewis, T. Church, R. Vehring, D. Murnane, and J. P. Reid. 2017. Pulmonary aerosol delivery and the importance of growth dynamics. Ther Deliv 8 (12):1051–1062. doi: 10.4155/tde-2017-0093.
- Hadiwinoto, G. D., P. C. L. Kwok, and R. Lakerveld. 2018. A review on recent technologies for the manufacture of pulmonary drugs. Ther Deliv 9 (1):47–70. doi: 10.4155/tde-2017-0083.
- Ignatius, K., T. B. Kristensen, E. Järvinen, L. Nichman, C. Fuchs, H. Gordon, P. Herenz, C. R. et al. 2016. Heterogeneous ice nucleation of viscous secondary organic aerosol produced from ozonolysis of alpha-pinene. Atmos. Chem. Phys. 16 (10):6495–6509. doi: 10.5194/acp-16-6495-2016.
- Jakubczyk, D., G. Derkachov, M. Zientara, M. Kolwas, and K. Kolwas. 2004. Local-field resonance in light scattering by a single water droplet with spherical dielectric inclusions. J. Opt. Soc. Am. A 21 (12):2320–2323. doi: 10.1364/JOSAA.21.002320.
- Kellogg, W. W. 1992. Aerosols and global warming. Science. 256 (5057):598–598. doi: 10.1126/science.256.5057.598.
- Kramer, B., O. Hubner, H. Vortisch, L. Woste, T. Leisner, M. Schwell, E. Ruhl, and H. Baumgartel. 1999. Homogeneous nucleation rates of supercooled water measured in single levitated microdroplets. J. Chem. Phys. 111 :6521–6527. doi: 10.1063/1.479946.
- Krieger, U. K., C. Marcolli, and J. P. Reid. 2012. Exploring the complexity of aerosol particle properties and processes using single particle techniques. Chem. Soc. Rev. 41 (19):6631–6662. doi: 10.1039/c2cs35082c.
- Krieger, U. K., and P. Meier. 2011. Observations and calculations of two-dimensional angular optical scattering (TAOS) patterns of a single levitated cluster of two and four microspheres. J. Quant. Spectrosc. Ra. 112 (11):1761–1765. doi: 10.1016/j.jqsrt.2011.01.034.
- Kulmala, M., T. Vesala, and P. E. Wagner. 1993. An analytical expression for the rate of binary condensational particle growth. P. Roy. Soc. Lond. A Mat. 441 (1913):589–605. doi: 10.1098/rspa.1993.0081.
- Kwamena, N. O. A., J. Buajarern, and J. P. Reid. 2010. Equilibrium morphology of mixed organic/inorganic/aqueous aerosol droplets: Investigating the effect of relative humidity and surfactants. J. Phys. Chem. A 114 (18):5787–5795. doi: 10.1021/jp1003648.
- Lambe, A. T., C. D. Cappa, P. Massoli, T. B. Onasch, S. D. Forestieri, A. T. Martin, M. J. Cummings, D. R. Croasdale, W. H. Brune, D. R. Worsnop, and P. Davidovits. 2013. Relationship between oxidation level and optical properties of secondary organic aerosol. Environ. Sci. Technol. 47 (12):6349–6357. doi: 10.1021/es401043j.
- Lambe, A. T., T. B. Onasch, P. Massoli, D. R. Croasdale, J. P. Wright, A. T. Ahern, L. R. Williams, D. R. Worsnop, W. H. Brune, and P. Davidovits. 2011. Laboratory studies of the chemical composition and cloud condensation nuclei (CCN) activity of secondary organic aerosol (SOA) and oxidized primary organic aerosol (OPOA). Atmos. Chem. Phys. 11 (17):8913–8928. doi: 10.5194/acp-11-8913-2011.
- Liu, L., H. Wang, B. Yu, Y. Xu, and J. Shen. 2007. Improved algorithm of light scattering by a coated sphere. China Part 5 (3):230–236. doi: 10.1016/j.cpart.2007.03.003.
- Liu, P. F., M. J. Song, T. N. Zhao, S. S. Gunthe, S. H. Ham, Y. P. He, Y. M. Qin, et al. 2018. Resolving the mechanisms of hygroscopic growth and cloud condensation nuclei activity for organic particulate matter. Nat. Commun. 9 (1):4076. doi: 10.1038/s41467-018-06622-2.
- Marsh, A., R. E. H. Miles, G. Rovelli, A. G. Cowling, L. Nandy, C. S. Dutcher, and J. P. Reid. 2017. Influence of organic compound functionality on aerosol hygroscopicity: dicarboxylic acids, alkyl-substituents, sugars and amino acids. Atmos. Chem. Phys. 17 (9):5583–5599. doi: 10.5194/acp-17-5583-2017.
- Marsh, A., G. Rovelli, Y. C. Song, K. L. Pereira, R. E. Willoughby, B. R. Bzdek, J. F. Hamilton, A. J. Orr-Ewing, D. O. Topping, and J. P. Reid. 2017. Accurate representations of the physicochemical properties of atmospheric aerosols: when are laboratory measurements of value?. Faraday Discuss. 200 :639–661. doi: 10.1039/C7FD00008A.
- Marshall, F. H., T. Berkemeier, M. Shiraiwa, L. Nandy, P. B. Ohm, C. S. Dutcher, and J. P. Reid. 2018. Influence of particle viscosity on mass transfer and heterogeneous ozonolysis kinetics in aqueous-sucrose-maleic acid aerosol. Phys. Chem. Chem. Phys. 20 (22):15560–15573. doi: 10.1039/C8CP01666F.
- Mie, G. 1908. Articles on the optical characteristics of turbid tubes, especially colloidal metal solutions. Ann. Phys–Berlin 25 :377–445.
- Nandy, L., and C. S. Dutcher. 2018. Phase behavior of ammonium sulfate with organic acid solutions in aqueous aerosol mimics using microfluidic traps. J. Phys. Chem. B 122 (13):3480–3490. doi: 10.1021/acs.jpcb.7b10655.
- Ngo, D., and R. G. Pinnick. 1994. Suppression of scattering resonances in inhomogeneous microdroplets. J. Opt. Soc. Am. A 11 (4):1352–1359. doi: 10.1364/JOSAA.11.001352.
- Pandis, S. N., A. S. Wexler, and J. H. Seinfeld. 1995. Dynamics of tropospheric aerosols. J. Phys. Chem 99 (24):9646–9659. doi: 10.1021/j100024a003.
- Piedra, P., A. Kalume, E. Zubko, D. Mackowski, Y. L. Pan, and G. Videen. 2019. Particle-shape classification using light scattering: an exercise in deep learning. J. Quant. Spectrosc. Ra. 231 :140–156. doi: 10.1016/j.jqsrt.2019.04.013.
- Power, R. M., S. H. Simpson, J. P. Reid, and A. J. Hudson. 2013. The transition from liquid to solid-like behaviour in ultrahigh viscosity aerosol particles. Chem. Sci. 4 (6):2597–2604. doi: 10.1039/c3sc50682g.
- Preston, T. C., and J. P. Reid. 2015. Angular scattering of light by a homogeneous spherical particle in a zeroth-order bessel beam and its relationship to plane wave scattering. J. Opt. Soc. Am. A 32 (6):1053–1062. doi: 10.1364/JOSAA.32.001053.
- Price, H. C., B. J. Murray, J. Mattsson, D. O’Sullivan, T. W. Wilson, K. J. Baustian, and L. G. Benning. 2014. Quantifying water diffusion in high-viscosity and glassy aqueous solutions using a raman isotope tracer method. Atmos. Chem. Phys. 14 (8):3817–3830. doi: 10.5194/acp-14-3817-2014.
- Reid, J. P., A. K. Bertram, D. O. Topping, A. Laskin, S. T. Martin, M. D. Petters, F. D. Pope, and G. Rovelli. 2018. The viscosity of atmospherically relevant organic particles. Nat. Commun. 9 (1):956. doi: 10.1038/s41467-018-03027-z.
- Reid, J. P., B. J. Dennis-Smither, N. O. A. Kwamena, R. E. H. Miles, K. L. Hanford, and C. J. Homer. 2011. The morphology of aerosol particles consisting of hydrophobic and hydrophilic phases: hydrocarbons, alcohols and fatty acids as the hydrophobic component. Phys. Chem. Chem. Phys. 13 (34):15559–15572. doi: 10.1039/c1cp21510h.
- Reid, J. P., and L. Mitchem. 2006. Laser probing of single-aerosol droplet dynamics. Annu. Rev. Phys. Chem. 57 :245–271. doi: 10.1146/annurev.physchem.57.032905.104621.
- Renbaum-Wolff, L., M. J. Song, C. Marcolli, Y. Zhang, P. F. F. Liu, J. W. Grayson, F. M. Geiger, S. T. Martin, and A. K. Bertram. 2016. Observations and implications of liquid-liquid phase separation at high relative humidities in secondary organic material produced by alpha-pinene ozonolysis without inorganic salts. Atmos. Chem. Phys. 16 (12):7969–7979. doi: 10.5194/acp-16-7969-2016.
- Riefler, N., R. Schuh, and T. Wriedt. 2007. Investigation of a measurement technique to estimate concentration and size of inclusions in droplets. Meas. Sci. Technol. 18 (7):2209–2218. doi: 10.1088/0957-0233/18/7/054.
- Rovelli, G., R. E. H. Miles, J. P. Reid, and S. L. Clegg. 2016. Accurate measurements of aerosol hygroscopic growth over a wide range in relative humidity. J. Phys. Chem. A 120 (25):4376–4388. doi: 10.1021/acs.jpca.6b04194.
- Rovelli, G., R. E. H. Miles, J. P. Reid, and S. L. Clegg. 2017. Hygroscopic properties of aminium sulfate aerosols. Atmos. Chem. Phys. 17 (6):4369–4385. doi: 10.5194/acp-17-4369-2017.
- Service, R. F. 2008. Climate change - Study fingers soot as a major player in global warming. Science. 319 (5871):1745–1745. doi: 10.1126/science.319.5871.1745.
- Song, Y. C., A. E. Haddrell, B. R. Bzdek, J. P. Reid, T. Bannan, D. O. Topping, C. Percival, and C. Cai. 2016. Measurements and predictions of binary component aerosol particle viscosity. J. Phys. Chem. A 120 (41):8123–8137. doi: 10.1021/acs.jpca.6b07835.
- Stephenson, R., and J. Stuart. 1986. Mutual binary Solubilities - Water alcohols and water esters. J. Chem. Eng. Data 31 (1):56–70. doi: 10.1021/je00043a019.
- Stewart, D. J., C. Cai, J. Nayler, T. C. Preston, J. P. Reid, U. K. Krieger, C. Marcolli, and Y. H. Zhang. 2015. Liquid-Liquid phase separation in mixed organic/inorganic single aqueous aerosol droplets. J. Phys. Chem. A 119 (18):4177–4190. doi: 10.1021/acs.jpca.5b01658.
- Tong, H. J., B. Ouyang, N. Nikolovski, D. M. Lienhard, F. D. Pope, and M. Kalberer. 2015. A new electrodynamic balance (EDB) design for low-temperature studies: application to immersion freezing of pollen extract bioaerosols. Atmos. Meas. Tech. 8 (3):1183–1195. doi: 10.5194/amt-8-1183-2015.
- Tse, G., and S. I. Sandler. 1994. Determination of infinite dilution Activity-Coefficients and 1-Octanol water Partition-Coefficients of volatile organic pollutants. J. Chem. Eng. Data 39 (2):354–357. doi: 10.1021/je00014a036.
- Villers, D., and J. K. Platten. 1988. Temperature-Dependence of the Interfacial-Tension between water and Long-Chain alcohols. J. Phys. Chem. 92 (14):4023–4024. doi: 10.1021/j100325a005.
- Wadia, Y., D. J. Tobias, R. Stafford, and B. J. Finlayson-Pitts. 2000. Real-time monitoring of the kinetics and gas-phase products of the reaction of ozone with an unsaturated phospholipid at the air-water interface. Langmuir 16 (24):9321–9330. doi: 10.1021/la0006622.
- Zuend, A., C. Marcolli, A. M. Booth, D. M. Lienhard, V. Soonsin, U. K. Krieger, D. O. Topping, G. McFiggans, T. Peter, and J. H. Seinfeld. 2011. New and extended parameterization of the thermodynamic model AIOMFAC: calculation of activity coefficients for organic-inorganic mixtures containing carboxyl, hydroxyl, carbonyl, ether, ester, alkenyl, alkyl, and aromatic functional groups. Atmos Chem Phys 11 (17):9155–9206. doi: 10.5194/acp-11-9155-2011.