
 ?Mathematical formulae have been encoded as MathML and are displayed in this HTML version using MathJax in order to improve their display. Uncheck the box to turn MathJax off. This feature requires Javascript. Click on a formula to zoom.
Abstract
Airborne mineral aerosols emitted in high-latitude regions can impact radiative forcing, biogeochemical cycling of metals, and local air quality. The impact of dust emissions in these regions may change rapidly, as warming temperatures can increase mineral dust production and source regions. As there exists little research on mineral dust emissions in high-latitude regions, we have performed the first study of the physico-chemical properties of mineral dust emitted from a sub-Arctic proglacial dust source, using a method tailored to the remote conditions of the Canadian North. Soil and aerosol samples (PM10 and deposited mineral dust) were collected in May 2018 near the Ä’äy Chù (Slims River), a site exhibiting strong dust emissions. WHO air quality thresholds were exceeded at several receptor sites near the dust source, indicating a negative impact on local air quality. Notably, temporally averaged particle size distributions of PM10 were very fine as compared to those measured at more well-characterized, low-latitude dust sources. In addition, mineralogy and elemental composition of ambient PM10 were characterized; PM10 elemental composition was enriched in trace elements as compared to dust deposition, bulk soil samples, and the fine soil fractions (d < 53 µm). Finally, through a comparison of the elemental composition of PM10, dust deposition, and both fine and bulk soil fractions, as well as of meteorological factors measured during our campaign, we propose that the primary mechanisms for dust emissions from the Ä’äy Chù Valley are the rupture of clay coatings on particles and/or the release of resident fine particulate matter.
Copyright © 2019 American Association for Aerosol Research
Introduction
Mineral dust plays an important role in many atmospheric and environmental processes (Formenti et al. Citation2003), as it can interact with atmospheric radiation both directly, by scattering and absorbing radiation, and indirectly, by acting as cloud condensation nuclei or ice nuclei (Huang et al. Citation2006; Lohmann and Diehl Citation2006; Sokolik and Toon Citation1996). Furthermore, mineral dust influences the biogeochemical cycling of metals by transporting nutrients to marine and terrestrial environments. It can also take part in heterogeneous chemical reactions that can alter the composition of the atmosphere, and it can negatively impact air quality and public health (Avila, Alarcon, and Queralt Citation1998; Phalen et al. Citation1991; Prospero Citation1999a; Usher et al. Citation2002).
The size distribution, morphology, and chemical composition of mineral dust ultimately determine the impact it will have on the atmosphere and environment (Formenti et al. Citation2011). Particle size is inversely proportional to atmospheric lifetime, as larger particles are more prone to deposition due to their larger mass, with particles equal to or less than 10 µm in diameter (PM10) better able to undergo long-range transport in the atmosphere (Prospero Citation1999b). In addition, PM10 can have deleterious effects on air quality and public health, as inhalation of particles in this size fraction can negatively affect lungs and cardiac health (Kappos et al. Citation2004). The shape of mineral dust particles is highly variable and rarely spherical, and this non-sphericity can influence its optical properties (Kalashnikova and Sokolik Citation2004; Mishchenko, Hovenier, and Travis Citation1999). Chemical composition is another important factor to consider, as the optical properties of the dust are related to its mineralogy, while the elemental composition of dust can indicate how it will impact local biogeochemical cycling of minerals (Atkinson et al. Citation2013; Dubovik et al. Citation2002; Haywood and Boucher Citation2000; Richon et al. Citation2018).
Mineral dust emissions from high-latitude regions, defined as north of 50°N and south of 40°S, has recently been identified as an important yet overlooked area of research (Bullard et al. Citation2016). This is because the emission of dust at high latitudes has a unique effect locally as compared to in lower latitude regions. First of all, the radiative effects of the additional particulate matter are more pronounced in the pristine air and shallow atmospheric boundary layer of these regions (Barrie Citation1986). In addition, the proportion of mineral deposition within high latitudes has been shown to be 90% from the dust emitted from high latitude regions, and thus likely plays a much larger role in provision of minerals to local ecosystems as compared to dust transported from mid-latitude sources (Groot Zwaaftink et al. Citation2016). Deposition of mineral dust onto snow and ice can decrease the albedo of snow and ice surfaces, increasing the energy-absorbing capacity of these surfaces; this can, in turn, lead to increased rates of glacier ablation and earlier melting of snow during the spring season (Miller et al. Citation2016; Qian et al. Citation2015).
Moreover, there are significant differences in the dust production in high-latitude regions as compared to lower latitudes. Glacier activity results in the production of fine glacial flour sediment, which can be transported and deposited via meltwaters; when dried, these fine particles are susceptible to wind erosion (Bullard et al. Citation2016; Crusius et al. Citation2011). Katabatic winds differ from wind systems that lead to the production of wind-blown dust in dry, arid regions in their frequency – this is because they are decoupled from the synoptic meteorology, as they are the result of radiatively driven gradients originating from the cold, dense air masses above high-elevation glaciers and mountains (and, thus, are more diurnally relevant). The strong katabatic winds originating from glaciers and surrounding mountains can then drive high winds that emit mineral dust particulate matter from the fine glacial flour sediments. In addition, the rapid warming of Arctic and sub-Arctic regions can induce topographical changes resulting from glacier ablation. These changes may potentially lead to the creation of new dust sources, such as through the exposure of erodible sediment as a result of glacier retreat; they may also alter the emissions of existing sources, such as through changes to the local hydrology which can impact soil moisture, and subsequently soil erodibility (Bullard et al. Citation2016).
However, despite its significance, there are very few scientific studies that characterize the composition and microphysical properties of mineral dust based on ground samples collected from aerosols emitted from high-latitude regions. Sampling dust directly from any dust source is difficult, as source locations are often remote and the high concentrations of ambient dust coupled with the harsh environment can lead to instrument damage (Formenti et al. Citation2011). Remote sensing can be used to observe dust emission events (Crusius et al. Citation2011), but the effectiveness of this technique is limited when studying Arctic and sub-Arctic regions due to the fact that dust events often occur during periods of limited visibility, such as cloudy days or during the night, and these events are thus not easily observed via satellite imagery.
We have chosen to sample dust from the Ä’äy Chù (Slims River) Valley in the Kluane Lake region of Yukon, Canada. The erodible soils of the Ä’äy Chù River Delta comprise primarily glacial flour, and dust storms are regularly observed during the spring and summer (Nickling Citation1978). Cold air drainage occurs from the substantial glacier mass of the Kaskawulsh and the surrounding St. Elias mountain range, while smaller surrounding steep valleys also play a role in providing drainage to prolong and intensify katabatic winds. These strong winds, coupled with the presence of highly erodible sediment, result in frequent and intense dust emissions from this site. In addition, the Ä’äy Chù Valley has been directly impacted by climate change, with the rapid retreat of the Kaskawulsh glacier recently routing waters away from the river valley (Shugar et al. Citation2017), leaving the riverbed exposed over the summer season and thus potentially increasing its dust-producing erodible surface area. This location is significant as it may also serve as a point of reference for other proglacial dust sources at high latitudes.
Ours is the first study to characterize the chemical and microphysical properties of dust emissions from a source in the Canadian North. We provide results on the chemical composition and particle size distribution of the PM10 mineral dust collected, and have analyzed the chemical composition of dust deposited throughout the lower proglacial valley and of soil samples collected from the exposed sediment of the river to understand variations in composition from emission to deposition, including during transport. We have also provided a discussion of the potential dust emission mechanisms that may dominate the emission of dust from the Ä’äy Chù Valley.
Experimental design
Field site
The Ä’äy Chù river delta is 25 km from the 7 km-wide Kaskawulsh Glacier, in a 1 km-deep and 8 km-wide valley; the average slope of the valley is 1:200. Examples of photos depicting dust emissions from the exposed river sediment can be found in Figure S1. Data collection was performed at this location from 4 May to 2 June, 2018, as photographic images taken by automatic cameras in 2016 and 2017 indicated that the late spring/early summer is a period during which substantial dust production occurs. This is due to local geographical factors, as it is during this period that the snow has melted and the ground has thawed, but it is not yet so warm that glacier and snow-melt has flowed into the valley and moistened or covered the soils, decreasing their erodibility.
The sites at which atmospheric measurements were taken are shown in , while the locations of soil samples can be found in . Strong winds originating from the glacier and the surrounding mountain ranges often blow dust emissions down the river valley towards Kluane Lake (. Thus, the overall objective of the sampling scheme was to collect samples in the river delta and monitor how the chemical composition changed as the dust plume traveled towards and over Kluane Lake, although occasionally the plume traveled up the valley rather than down.
Figure 1. (a) Map of air sampling locations; site details can be found in . Sites include Down Valley (DV), Upper Valley (UV), Ä’äy Chù East (AAE), the Visitor’s Center (VC), and the Kluane Lake Research Station (KLRS). (b) Map of soil sampling locations. Samples A to N were taken from they Ä’äy Chù Valley and Delta, while sample R1 was well removed from the valley and R2 is a roadside sample retrieved near the Alaska Highway. For reference, the location of the four air sampling locations have been included: the Down Valley site (DV), Ä’äy Chù East (AAE), the Visitor’s Center (VC), and the Island. (c) Satellite image obtained from LANDSAT of dust plume rising from the delta of the Ä’äy Chù (Slims River).
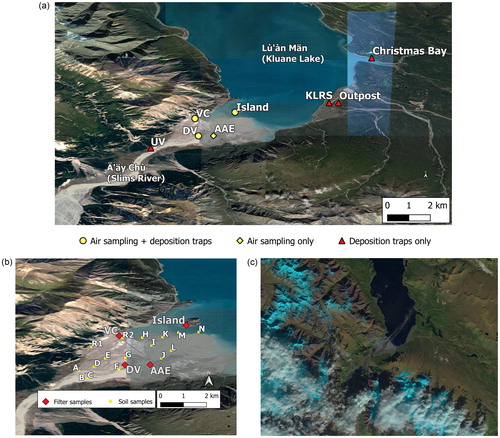
Details regarding the instrumentation, elevation, and GPS coordinates of the various sites sampled are given in . A main instrumentational site, the Down Valley site was installed in the Ä’äy Chù Valley within the dust source region, as frequent dust storms were produced from the surrounding soils. Its primary function was aerosol sampling and to serve as an extensively equipped meteorology station.
Table 1. Site characteristics and details on dust and meteorological monitoring equipment used for the field study. Sites where 24 h PM10 ambient mass concentrations (PM10 concentrations), temperature (T), pressure (P), relative humidity (RH), wind speed (WS) or wind direction (WD) were measured are indicated.
A mobile air sampling station was moved between three sites: the Ä’äy Chù East site (4 to 14 May), the Visitor’s Center (15 to 28 May), and the Island site (29 to 31 May). The mobile station sampling locations are depicted in . Broadly, the goal of sampling at these transient sites was to understand the spatial variation in the concentration and chemical composition of PM10 mineral dust within and near the valley, and to gain a sense of local air quality. One of the sites at which mobile ambient PM10 measurements were collected was the Kluane National Park and Reserve Thachäl Dhäl Visitor’s Center, which serves as a main tourist attraction and is managed by local employees during the spring and summer. Similarly, the Island site is a scenic overlook adjacent to Kluane Lake; it is now a destination for tourists and local hikers, as the diversion of the Ä’äy Chù has rendered the island accessible by foot. The Island Site receives large amounts of mineral dust from plumes traveling down the Ä’äy Chù Valley.
Additionally, four sites solely monitoring dust deposition were placed as indicated in . This included three sites on the side of Kluane Lake opposite the dust source: the Kluane Lake Research Station, the Outpost Research Station, and the Shakat Tun Wilderness Camp in Christmas Bay. An Upper Valley site was also installed in the river valley, located 2 km closer to the Kaskawulsh glacier than the Down Valley site. The locations of these sites were selected to evaluate the spatial variation in the chemical composition of dust deposited in the region.
Meteorological measurements
The primary location of the meteorological measurements was the Down Valley site. A wide array of meteorological equipment was deployed at this site, the details of which can be found in the online supplementary information (SI) (Table S1). All meteorological data was sampled and recorded by a datalogger (CSI Inc., Model CR3000) at several intervals depending on the instrument, and with summary statistics at 1 s, 1 min, and 10 min intervals.
The Upper Valley site served primarily as a meteorological station to monitor wind speed and direction upwind of the Down Valley site and to examine the behavior of incoming katabatic winds before they arrived at the source region. A propeller anemometer (RM Young, Model 05103) was installed at this site to measure wind speed and direction. Temperature, relative humidity, and barometric pressure (Vaisala, Models HMP35C and PTB 100 A) were also monitored at this site; all data was recorded by a datalogger (CSI Inc., Model CR800).
The Island site was equipped with an identical set of meteorological monitoring equipment recording air temperature, relative humidity, and barometric pressure as the Upper Valley site. It was also equipped with a camera (Canon T2i with 24 mm f/2.8 lens) in a custom-made weatherproof enclosure overlooking the valley, which took photos at 10 min intervals, controlled by the datalogger, during the period from May – October 2018. All meteorological data were processed to ensure their quality, excluding any time periods during which maintenance was performed on the towers from the final dataset to avoid reporting interferences induced by the presence of researchers at the sites. After data collection, all meteorological data were resampled to a timescale of 5 min intervals.
Sample collection and in situ instrumentation
An optical particle counter (OPC; Fast-Response Multichannel Monitor, FAI Instruments) was used to measure the number concentration of particles between 0.28 and 10 µm in diameter. This instrument includes 22 optical channels and provided particle size distribution measurements at 2 – 4 Hz. The OPC was operated at a sample flow rate of 1 LPM. As the instrument was located directly in the dust source, all air samples were diluted by a factor of six before analysis to avoid overwhelming the internal optics setup of the instrument. The OPC was installed at the Down Valley station and placed so that its inlet was located at a height of 3.5 m above the ground in a weatherproof enclosure. Continuous 24 h sampling began on 17 May at 00:00 and ended 30 May 00:00. Information on quality control and data analyses performed to validate the OPC and gravimetric analyses can be found in the SI, and in and , which present data validation calculations that utilize the method of Gillies and Berkofsky (Gillies and Berkofsky Citation2004) to interpolate the gravimetric results to the height of the OPC.
Figure 2. Comparison of ambient PM10 mass concentrations measured by the OPC (x-axis) with concentration values based on gravimetric data that have been interpolated to the OPC height (y-axis). The interpolation of the PM10 concentrations from the gravimetric data obtained by filter samplers at 2 m and 6 m heights was performed following a procedure based on the work of Gillies and Berkofsky (Citation2004). See the SI for more details.
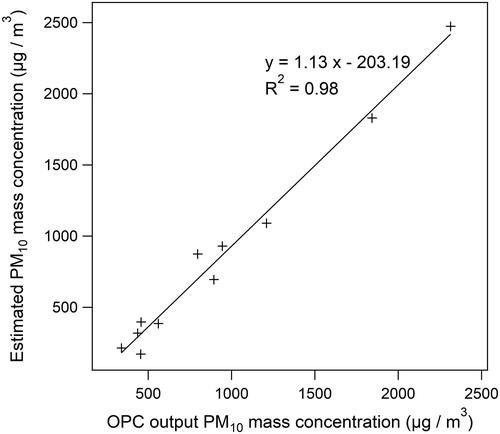
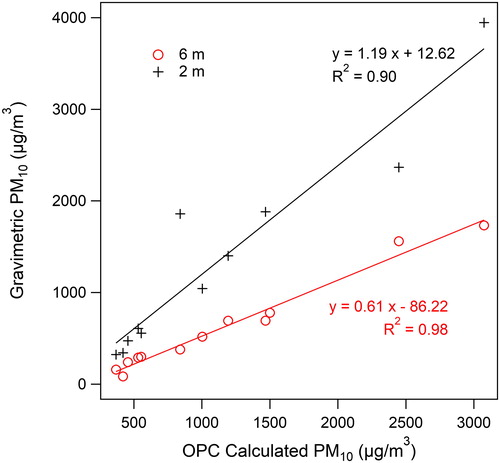
Figure 3. Correlation between 6 m and 2 m gravimetric data and 24 h averaged PM10 calculated from the OPC data. Linear regression equations and R2 values are provided in the image.
Aerosol filter sample collection was performed using four mini-vol samplers (ARA Instruments, Near-Federal Reference Method Samplers). Three of these samplers were equipped with quartz filters (Whatman, QM-A, 47 mm, 2.5 µm pore size), of which two were placed at the Down Valley site – one at 2.6 m and the other at 5.9 m, to allow for calculation of vertical aerosol flux (see next section). For brevity, in this text these samplers will be referred to as the 2 m and 6 m samplers, respectively. The third sampler, known as the “mobile station,” was placed on a 2 m-tall stainless-steel tripod (Davis 7716, Mounting Tripod for Weather Stations) and deployed to the mobile station sites: Ä’äy Chù East, Visitor’s Center, and the Island. The sampler was located at each station for several days before being moved to the next. All three of these mini-vol samplers were operated using a PM10 impactor and 24 h sampling periods at a flow rate of 16.7 L min−1 (1 m3/hr). Samples collected on quartz filters were used for ICP-MS analysis of total concentrations of select minor and trace elements.
The fourth mini-vol sampler was equipped with a Nuclepore filter (Whatman® Nuclepore™ Track-Etched Membranes, 47 mm diameter, 0.4 µm pore size) and stationed at the Down Valley site, at a height of 6.1 m. The filters from this sampler were used for SEM/EDS analysis. The sampler was operated using 24 h sampling periods; the inlet of the PM10 impactor was modified to allow the instrument to be operated at a lower flow rate of 10 L min−1, to accommodate the greater resistance to air flow through the Nuclepore filter.
Gravimetric analysis was performed on all filter samples in order to determine the dry mass of the particulate matter collected, from which a 24 h average PM10 mass concentration was calculated. All samples were weighed both before and after sampling. Before being weighed, quartz filters were dried at 250 °C for 2 h and then placed in a clean silica-filled desiccator for 1 h, both before and after sample collection. While heating to 250 °C would cause loss of volatile organic soil components, we conclude this loss is minimal with respect to the PM10 mass given the excellent correlation between the in situ OPC measurements and the filter-based gravimetric analysis ( and ). Nuclepore filters were dried in the desiccator for 24 h prior to being weighted. Filters were stored in EMD Millipore PetriSlide™ containers at a temperature of –20 °C before analysis.
Due to the remote locations of the various sampling sites, filter exchanges were performed in the field while taking precautions to decrease contamination before or after sampling. In general, samplers were serviced in the morning between 5:00 and 10:30 PST, when dust storms were less frequent and less intense. The used filter was carefully transferred to a protective case and subsequently replaced by an unused filter in as short a time as possible. Field blanks were regularly obtained by transferring a clean, unused filter into the air sampler followed by immediate removal, in order to gauge the level of contamination introduced during this procedure. Upon return from the field, ICP-MS and gravimetric analysis demonstrated negligible contamination for the field blank filters, as discussed in the SI.
Several dry-foam passive deposition traps (Hanby Company), were placed at sites in and near the delta of the Ä’äy Chù including at the Down Valley, Island, Upper Valley, and Visitor’s Center sites. Deposition traps were also placed on the lakeshore opposite the delta at the Kluane Lake Research Station, Outpost, and Christmas Bay sites. These samples were used to evaluate the spatial distribution of deposited dust, including the spatial variation in the chemical composition.
Lastly, 14 soil samples were collected from the exposed sediments of the Ä’äy Chù by removing the top 1 cm of a 20 cm x 20 cm patch of soil. Only the surface of the soil was sampled, as this is the portion most likely to contribute to dust production.
Vertical aerosol flux calculations
The vertical aerosol mass flux of PM10 particles was calculated using the gradient method of Gillette et al. (Citation1972). The parameterization is provided by EquationEquation (1)(1)
(1) , where ρ is air density, u1 and u2 are windspeeds at heights z1 and z2, and n1 and n2 are mineral dust concentrations at heights z1 and z2, respectively. Calculation of C, the drag coefficient, is provided by EquationEquation (2)
(2)
(2) .
(1)
(1)
(2)
(2)
Using Equations Equation(1)(1)
(1) and Equation(2)
(2)
(2) , the vertical flux was calculated using the windspeed and gravimetric data at 5.9 m and 2.6 m at the Down Valley site. This simple flux model allowed us to evaluate, semi-quantitatively, dust emissions that occurred at the Down Valley site location.
Techniques for chemical composition analysis
SEM/EDS
Analysis via scanning electron microscopy coupled with energy-dispersive x-ray spectroscopy (SEM/EDS) was used to determine the mineralogy, size, and aspect ratio of particles collected on a Nuclepore filter. The sample were analyzed using a JEOL JSM 7600 F instrument under high vacuum, at a voltage of 10 kV and a working distance of 15 mm. An LEI detector was employed for all EDS measurements. A total of 115 particles were analyzed in this manner.
Particles collected from 27 May 10:15 to 28 May 8:15 (PST) at the Down Valley site were analyzed using SEM/EDS. Before analysis, a 1 cm x 1 cm piece of filter was carefully cut and attached to the sample mount using double-sided carbon tape. The sample was coated with approximately 40 nm of gold in order to render it conductive.
The nominal geometric diameter of each particle analyzed was measured along the length of the longest axis of the particle. The aspect ratio of particles was also determined by dividing the geometric diameter by the length along the axis perpendicular to the particle’s longest axis. Particle mineralogical classification was obtained by comparing EDS spectra to known mineral reference spectra (Falkovich et al. Citation2001). As determination of particle mineralogy was the sole goal of this method, it was assumed that the semi-quantitative elemental composition output of the EDS analysis was sufficient for our purposes, and no steps were taken to ensure the elemental composition results were quantitative. Pure minerals were defined as those containing only Si (quartz), only Ca (calcite), only Ca and S at a 1:1 ratio (gypsum), only Ca and Mg (dolomite), or only Al, Si, and one of either Ca, Na, or K (feldspar). Amphiboles and clay minerals were identified through comparison with reference spectra (Ashrafi and Hajalilou Citation2017; Falkovich et al. Citation2001; Paoletti et al. Citation2008).
ICP-MS
A modified version of EPA method 3051a was used to analyze trace and minor element concentrations in both soils, PM10, and deposited aerosol samples using inductively coupled plasma-mass spectrometry (ICP-MS) (EPA Citation2007). The method was scaled down in order to work with the small sample sizes (20-40 mg) that were available due to the use of mini-vol samplers. In addition, a mixture of ultrapure HNO3 (67-70%, BDH ARISTAR ULTRA, supplied by VWR International) and HCl (TraceMetal Grade, Fischer Chemical) were used for the digestion of samples, due to the infeasibility of using HF at our facilities.
Filter samples were digested by cutting filters into small pieces and placing them in microwave digestion tubes. The mass obtained from gravimetric analysis was used as the sample mass for the analyses of the filter samples; this number was typically 20-40 mg, depending on how much PM10 had been collected during the 24-h sampling period. For the soils, digestions were performed by measuring 25 mg of each sample analyzed into the Teflon tubes. Deposition trap samples were analyzed in the same manner as soil samples. A more detailed description of the digestion process employed can be found in the SI.
Samples were pre-digested for 4 hrs in a fume hood to avoid violent reactions upon heating. Tubes were then placed in a Mars-Xpress CEM Digestion Microwave and subjected to an initial temperature ramp to 140 °C that lasted 5.5 min with a subsequent holding period of 4.5 min. After a 5-min cooling period, samples were removed from the apparatus; transferred to clean, pre-weighed 50-mL polypropylene tubes; diluted by a factor of 7 for soil samples and 8 for PM10 samples; and filtered using a syringe filter (Fisherbrand 25 mm nylon syringe filters, 0.45 µm pore size, sterile). Three standard reference soils – NIST 2710a, NIST 2711a, and NIST 8704 – as well as acid blanks were digested alongside soil and aerosol samples in order to confirm the quantitative recovery of metals contained in the samples and to verify that no contamination was introduced during the digestion process.
Samples were then analyzed via ICP-MS (Perkin Elmer, NexION 300x) using calibration standard IV-71a and quality control standard QCS-27 (Inorganic Ventures). Standard solutions of 0.5 – 200 μg/L prepared from IV-71a were used for calibration, and a 50 μg/L quality control solution prepared from QCS-27 was also used. Data for a given metal were accepted as quantitative if NIST SRM recovery was 80 – 110%, the calibration curve R2 was greater than 0.999, and the solution-phase quality control analysis was within 10% of the known concentration of QCS-27.
Results and discussion
Particle sizing and ambient mass concentrations
Time series data
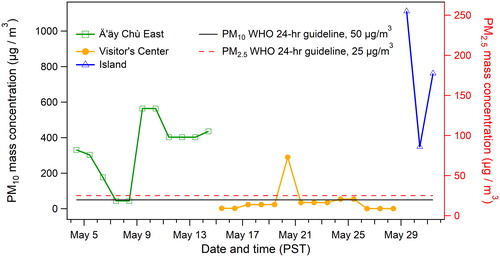
The particle size distribution (dM/dlogDp) from the Down Valley site and the 24 h averaged PM10 concentrations from the Down Valley, Ä’äy Chù East, Visitor’s Center, and Island sites are depicted in . This size distribution was calculated assuming spherical particles and an average particle density of 2.65 g/cm3 (Lee, Chen, and Adams Citation2009). Given that the Down Valley site was located directly in the exposed delta of the Ä’äy Chù and that the PM10 concentrations were substantially higher at this site compared to the other sites, the particle sizing and gravimetric analysis of samples from the Down Valley site were taken to be indicative of dust emissions from the Ä’äy Chù Valley. The 24 h data from the filter samples shows a significant event occurred within the filter sampling period of 19 May at 11:00 to 20 May at 9:00 (PST), with the OPC data indicating the event took place on 19 May between 6:00 and 21:00 (PST). Based on our time series data, this period exhibited the highest ambient concentrations of PM10 observed at the Down Valley site. The period between 20 May and 25 May is marked by multiple periods of elevated mineral dust concentration per day, followed by a less-dusty period between 25 May and 27 May. Both the gravimetric and OPC data show increased dust emissions on 29 May. Gravimetric analysis indicates that dust events occurred 14 and 15 May, though no OPC data is available for these dates and thus fast time-resolution measurements of these events are unavailable. The particle size distribution showed little variation with time, as is evident in .
Figure 4. Time series of (a) 24 h averaged PM10 mass concentrations at all sites, determined using gravimetric analysis of filter samples. The size-resolved particle number concentrations output by the OPC were also used to calculate the 24 h averaged PM10 mass concentrations at 4 m. (b) Five-minute resolution OPC data.
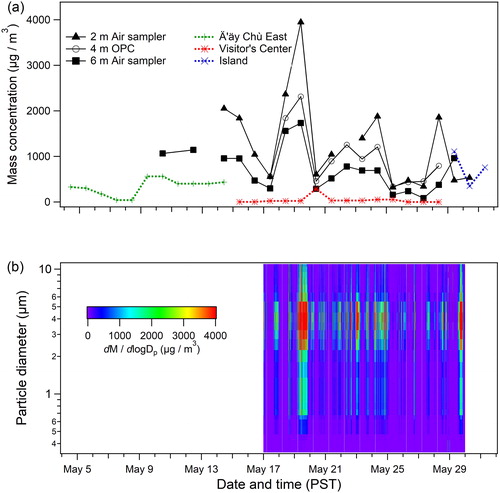
Figure 5. Normalized particle mass size distribution (dM/dlogDp) from the OPC data averaged over four time periods. The maximum is observed at a particle diameter of 3.25 µm.
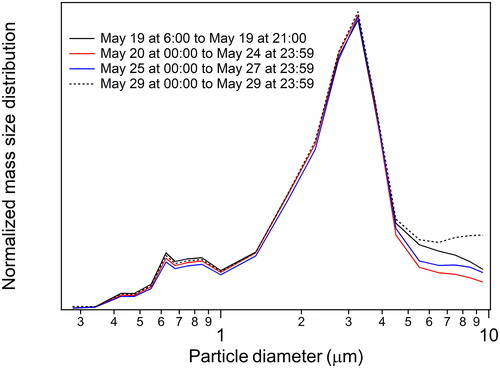
In addition, shows the particles in the PM10 size range to be quite fine, with a maximum in the mass size distribution of 3.25 µm. This is a key result, as the PM10 size distribution recorded in this study is very fine as compared to those previously found by studies of more well-characterized dust sources, such as Northern Africa, the Sahara, China, and Australia; results compiled by Huang et al. (Citation2019) found the maximum of the volume size distribution for PM10 collected from these low-latitude dust sources to be closer to 10 µm. Huang et al. presented their results as the geometric diameter, while our OPC measurements report the optical diameter; however, we have compared the size distribution measured by our OPC with the particle size distribution measured by an aerodynamic particle sizer (APS) that also sampled ambient PM10 in the Ä’äy Chù Valley (Figure S2). The APS also measures the particle number size distribution similar to the OPC, but the instrument is based on aerodynamic rather than optical sizing, which means the apparent observed diameter is influenced by particle shape and density but not index of refraction. The similarity of the OPC and APS size distributions, as well as the previously described quality control analysis that confirms the OPC measurements ( and ), suggest that there is a negligible difference between the OPC measured optical diameter provided in and the actual geometric diameter of particles. Further discussion of the processes that may have resulted in the relatively fine PM10 size distribution measured can be found in the dust production mechanisms section of this discussion.
Diurnal trends in ambient PM10
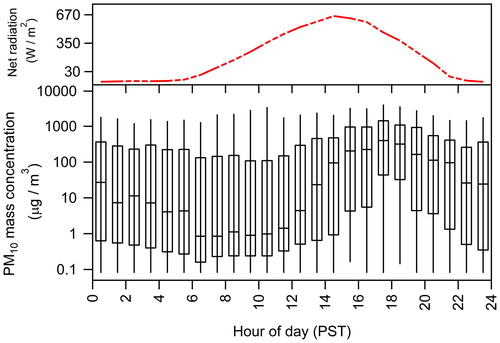
The diurnal variation of the ambient PM10 mass concentration, as calculated from the OPC data, is depicted in . While ambient dust concentrations are highly variable from day to day, ambient PM10 concentrations are generally highest in the afternoon and evening, between 13:00 and midnight (PST), with the early morning hours of 5:00 to 10:00 (PST) corresponding to the lowest PM10 concentrations. In addition, we use the diurnal net radiometer data () as a general indicator of daytime versus nighttime over the course of our sampling campaign, though it is true that ambient dust may alter the net surface radiation budget. The magnitude of net radiation measured by the net radiometer is generally close to zero at hours of the day when significant PM10 concentrations were observed, demonstrating that dust activity was not restricted to daylight hours. This finding demonstrates that passive remote sensing of mineral dust emissions in the Arctic that is limited to daytime hours may miss dust production that occurs at night.
Figure 6. (below) Diurnal trends in ambient PM10 concentrations at the Down Valley site, as determined from the OPC data. Box-and-whisker plots show the minimum, 25% quartile, median, 75% quartile, and maximum of the data obtained continuously between 17 May and 29 May, 2018. (above) Mean net radiation at the Down Valley site between 4 May and 2 June, indicating the approximate range of daylight hours during this period.
Estimation of PM2.5 concentrations
While no PM2.5 filter samples were collected during the campaign, the PM2.5 concentration was calculated using the OPC data. Both the PM10 and PM2.5 mass concentrations were calculated from the OPC data, using a particle density of 2.65 g/cm3 and assuming spherical particles. A strong correlation was observed between the mass concentrations of PM10 and PM2.5 calculated from the OPC data (R2 = 0.88, 5 min resolution). However, when a single data point (28 May at 9:50 PM) was removed, the R2 coefficient increased to 0.95.
(3)
(3)
Given the exceptional correlation between PM10 and PM2.5, we applied EquationEquation (3)(3)
(3) – the linear regression equation relating the ambient OPC mass concentration of PM10 and PM2.5 at the Down Valley site – to the 24 h PM10 concentration data obtained from the mobile station sites (Ä’äy Chù East, Visitor’s Center, and Island), in order to estimate PM2.5 concentrations at these sites. The mobile station site PM2.5 concentrations estimated using this method are likely a lower-bound of the PM2.5, as the settling mechanisms of mineral dust result in larger particles being deposited at a faster rate. Thus, PM2.5 could potentially make up a slightly larger percentage of the PM10 size fraction at the mobile station sites than it does at the Down Valley site located directly in the dust source.
Comparison of PM10 and PM2.5 concentrations with air quality standards
The measured 24 h average PM10 and estimated PM2.5 concentrations at the mobile station sites (Ä’äy Chù East, Visitor’s Center, and Island) were compared to air quality thresholds provided by the World Health Organization (WHO). The result of this comparison is shown in . The 24 h air quality standard for ambient PM10 concentrations provided by the WHO is 50 µg/m3, which is a target value for limiting risks to public health; the corresponding limit for PM2.5 concentrations is 25 µg/m3 (WHO Citation2006). Based on these air quality guidelines, it is evident that both the PM10 and PM2.5 limits of the WHO were surpassed at all three sites during our sampling campaign. Moreover, the estimated PM2.5 surpassed the WHO PM2.5 limits on all days when the WHO PM10 limits were surpassed. With the caveats of the short duration of the measurement campaign and that standard reference methods were not used, the results indicate that the emitted mineral dust negatively impacts air quality in locations near the Ä’äy Chù that are frequently visited by tourists.
Figure 7. Comparison of 24 h ambient PM10 (left axis) and PM2.5 (right axis) mass concentrations observed at mobile station sites with the air quality guidelines of the World Health Organization (WHO). The WHO 24 h guidelines are 50 µg/m3 and 25 µg/m3 for PM10 and PM2.5, respectively (WHO, Citation2006).
Mineralogy and morphology of ambient PM10
The mineralogical composition of individual dust particles collected on a filter from 27 May at 10:15 to 28 May at 8:15 (PST) at a height of 6 m at the Down Valley site was determined based on the approach of Falkovich et al (Citation2001). This data is provided in . Si, Al, Ca, Mg, K, Na, Fe, Cr, and S were detected in the course of our analysis. It was found that the analyzed particles consisted of both pure minerals – quartz, feldspar, amphiboles, calcite, gypsum, and dolomite – and aluminosilicate aggregates. These aluminosilicate aggregates were primarily clay minerals; through analysis of element ratios, certain clay minerals were identified as being aggregated with pure minerals. For example, all clay minerals containing 1:1 ratios of Ca and S were classified as aggregates of clay with gypsum. Examples of EDS spectra of particles and their corresponding mineralogical classification can be found Figure S3 (SI).
Table 2. Mineralogical classification inferred from SEM/EDS analysis of PM10 particles collected at the DV site (h = 6 m). In total, 115 particles were analyzed. Aluminosilicate particles dominate the mineralogy, with quartz, feldspar (plagioclase and orthoclase), amphiboles, and clay minerals making up a majority of the minerals present. Note the “clay minerals” category includes aggregates of clay minerals with pure minerals, such as with gypsum or calcite.
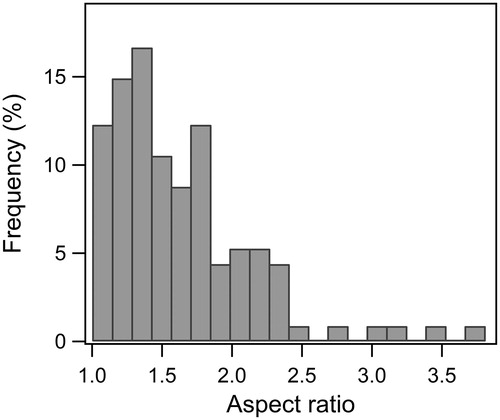
Of all the particles sampled, 63.5% contained Al, 22.6% contained Fe, and 13.0% contained Na. Particles containing Fe were primarily in the form of clay minerals or clay minerals aggregated with gypsum, with only 3.5% of all particles categorized as Fe-containing amphiboles. Ca was present in 42.6% of all particles, with 16.5% of all particles classified as the Ca-containing pure minerals calcite, gypsum, or dolomite. It is important to note that the mineralogical data obtained through this analysis is semi-quantitative due to the small sample size, as 115 particles were analyzed. Moreover, the mineralogical classification using SEM/EDS can be difficult when a mixture of two-or-more minerals are present within a given particle, and it can be especially difficult to distinguish between pure clay minerals and amphiboles using this technique. Nevertheless, the SEM/EDS results provide information regarding the major element content of the PM10 collected, and the data indicate a large presence of aluminosilicate and calcium-containing minerals. Finally, the particle aspect ratios were also measured giving a mean value of 1.60 ± 0.53, where the error provided is the standard deviation. The aspect ratio analysis indicated that the majority of particles (88%) were non-spherical, with certain particles possessing aspect ratios exceeding 3.0 ().
Figure 8. Particle aspect ratios as determined by SEM/EDS analysis.
Minor and trace element content
Method evaluation results
Our results indicate that the modified version of EPA 3051a we employed for our sample digestions quantitatively extracts the following nine metals from both PM10 and soil samples: Mn, Fe, Co, Ni, Cu, As, Cd, Cs, and Pb. The results of our validation tests are discussed in the SI, while the elemental recoveries and limits of detection of our analyses can be found in Tables S2 and S3.
Elemental composition of PM10, dust deposition, and soil samples
ICP-MS results are provided in Table S4 for all analyzed ambient PM10, dust deposition, and soil samples. Due to the quantity of samples analyzed, we have also condensed the data into a summary of compositions by sample type in . It is noteworthy that due to the low sample mass, elemental analysis of dust deposition collected from the Visitor’s Center was not possible.
Table 3. Average elemental composition per sample type – bulk soils, fine soil fraction (d < 53 µm), dust deposition, and ambient PM10 – as determined via ICP-MS. Standard error and relative standard error are also provided. ¥Data from Down Valley site (May only) excluded from average. **Data from sampler at 6 m height used only.
The analyzed elemental composition of PM10 is quite consistent between the Down Valley and mobile station sites and varies very little from day-to-day. This can be seen in the low relative standard errors (RSE) of the averaged PM10 composition in , which do not exceed 5% for any metal except Cd. Thus, the ambient PM10 samples analyzed showed little spatial or temporal variation in their chemical composition, with Cd being the most variable element and Fe and Mn content showing the least spatial and temporal variation. Fine soil samples demonstrated increased variability in As (RSE of 28.9%) and Pb (RSE of 28.6%) as compared to the other analyzed metals. The As content was generally higher in the most up-valley soil samples (B and C, both fine and bulk soil samples), as well as those closest to Kluane Lake (J, K, M, N, both fine and bulk soil samples where applicable). This subset of soil sample sites where As was found to be higher were also higher in Pb content analyzed.
More spatial variation was observed in the composition of the dust deposition samples than the PM10 air samples. Trends in dust deposition composition are observable in Table S4, as samples are listed in order of their proximity to the Kaskawulsh glacier with the Upper Valley site being the closest and Christmas Bay being the furthest site. At sites more removed from the river delta, such as Kluane Lake Research Station, Outpost Research Station, and Christmas Bay, it is not certain whether all the dust deposition collected originated from the exposed sediment of the Ä’äy Chù, as it is possible that a portion of the dust collected originated from other sources as well (such as road dust or natural dust sources nearby). The sample collected from Christmas Bay is of note in its deviation from the other samples. It comprised the lowest content of As and Mn, as well as the highest content of Ni, Cd, and Pb, as compared to the other analyzed dust deposition samples. The elevated Pb content of the Outpost and Christmas Bay samples could likely be due to the increased proximity of these sites to areas of human habitation. The composition data for the deposition samples indicates that the impact of the dust plumes in terms of the deposition of metals extends at least a distance of approximately 5 km across the southern portion of Kluane Lake.
In order to compare the elemental compositions of our samples, we have compared the enrichment factor of the Down Valley site ambient PM10 elemental composition with the other sample types. This factor was calculated for each element analyzed by determining the ratio between the mass fraction in the Down Valley site PM10 at a height of 6 m and the mass fraction of the element in each of the other sample types (mobile sites, deposition, fine soils, and bulk soils). The results of our comparison can be found in .
Figure 9. Bar graph of Down Valley site (DV) PM10 enrichment of trace elements as compared to mobile station PM10, dust deposition, fine soils (d < 53 µm), and bulk soils. Error bars represent the propagated standard error of the two compared sample types.
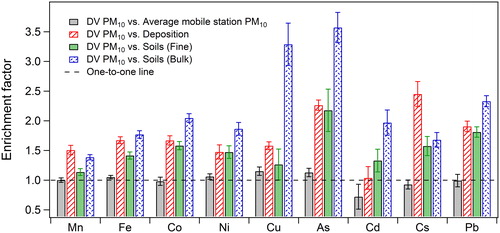
There are distinct trends in the elemental composition when comparing between sample types. Firstly, the enrichment factor of the Down Valley site ambient PM10 composition relative to that of the mobile station sites hovers near 1, indicating a similar composition between the PM10 samples collected at our air sampling sites throughout the river delta and at the Island site. Cd is an exception to this rule, likely because it has the lowest concentrations out of the metals we have quantified, and thus might be more influenced by contamination and measurement interferences. also demonstrates an overall elemental enrichment in the ambient PM10 samples as compared to the bulk soils. This trend is still apparent, but less pronounced, when comparing the Down Valley site PM10 with the fine fraction of the soils and dust deposition. In this case, there are certain exceptions to the overall trend of PM10 enrichment, such as for Cd (for which the concentration is statistically equivalent between Down Valley PM10 and deposition samples) and Cu (for which the concentration is statistically equivalent in the fine fraction of soils and PM10). Moreover, the elemental composition of the deposition samples is relatively similar to that of the fine fraction of the soils; the difference is much less pronounced than the difference between PM10 and fine soil samples.
An ANOVA test was performed to more quantitatively compare the observed trends described above. The results of the ANOVA can be found in . Overall, the ANOVA analysis indicated a significant difference between the elemental composition of PM10 samples as compared to dust deposition, bulk soils, and the fine fraction of soils.
Table 4. Results of ANOVA analysis performed for each element analyzed, comparing PM10, dust deposition, bulk soils, and the fine fraction (d < 53 µm) of soils. ANOVA calculations were performed for a 95% confidence interval.
Ambient concentrations of minor and trace elements in PM10
We have calculated the total concentration of each analyzed trace element in the aerosol samples in ng/m3 or μg/m3 and provided this data in . As the composition of the collected PM10 air samples did not show significant day-to-day or site-to-site variation, we find that the ambient concentrations of each metal follow the trends of the gravimetric analysis, with lower ambient minor and trace element concentrations at 6 m as compared to 2 m at the Down Valley site, and higher concentrations at the Island and Ä’äy Chù East sites than at the Visitor’s Center. However, there are some instances when the concentrations observed at the Visitor’s Center equaled or even slightly surpassed those of the other two mobile station sites, such as in the case of Co, Cd, Cs, and Pb. This may be due to the proximity of the Visitor’s Center site to human activity, slight differences in the composition of the dust at this site, or the differences in aerosol concentration since the days on which the measurements were taken at the Visitor’s Center and the other mobile station sites were not the same.
Table 5. 24 h averaged ambient concentrations of the measured trace elements in the ambient PM10 at the Down Valley and mobile station sites. Date indicates sampling start date.
Evaluation of dust production mechanisms
Contribution of saltation-sandblasting
Parameterizations of dust emissions make the, often correct, assumption that vertical aerosol flux is proportional to horizontal flux (Marticorena and Bergametti Citation1995). This is because saltation/sandblasting processes – in which larger, dense, wind-blown particles impact upon the surface, thus releasing fine sediments that would otherwise be too small to be entrained due to their low resistance in an airflow – are thought to be the dominant mechanism responsible for dust emission (Ginoux et al. Citation2001; Shao Citation2008). However, the details of this mechanism can vary depending on the composition and size distribution of particles in the erodible soils, and thus parameterizations of dust emission developed based on low-latitude dust sources may not be applicable to high-latitude dust sources whose erodible soils may differ greatly in size and composition. Moreover, it is also possible for dust entrainment to occur through processes other than sandblasting, such as through direct aerodynamic entrainment (Loosmore and Hunt Citation2000; Shao Citation2001).
We began by confirming whether the location of the Down Valley site was indeed a site of dust emission. By applying the method of Gillette et al. (Citation1972), we calculated the daily net vertical aerosol flux as described in the experimental section. The results of this analysis can be found in . We observed dust emissions on almost every day of our sampling campaign for which the vertical aerosol flux could be calculated, with the exception being 29 May. As a result, we concluded that we could safely assume that the location of our sampling instruments in the Ä’äy Chù Valley was indeed a site of dust emissions.
Table 6. Tabulated average daily vertical aerosol flux calculated from gravimetric data at the Down Valley site, using the method of Gillette et al. (Citation1972). Positive values indicate net emissions, while negative values indicate net dust deposition during the filter sampling period. The overall average value of vertical flux measured during our sampling campaign, including standard error, was found to be 134.0 ± 52.9 (µg/m2/s).
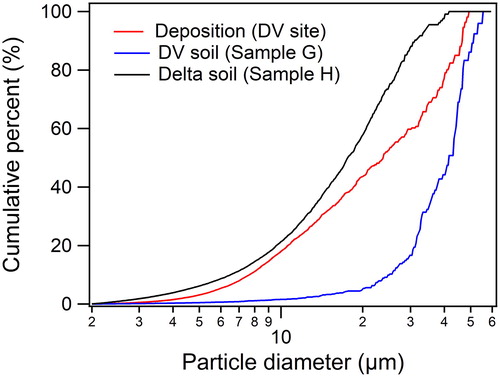
Because the saltation/sandblasting mechanism is known to be a dominant dust emission mechanism at previously characterized low-latitude dust sources, we attempted to confirm its importance as a mechanism for dust emissions in the erodible sediment of the Ä’äy Chù Valley. By sieving our soils, we found that the percentage by mass of the bulk soil comprising particles smaller than 53 µm in diameter was 12.4% for a soil sample near the Down Valley site (Sample G), and 14.5% and 19.6% for two soil samples collected in the delta, closer to Kluane Lake (Samples I and L, respectively). In addition, the results of our size distribution analysis, described in the SI, demonstrated that particles with diameters of less than 20 µm make up a substantial portion of the fine fraction of the soil samples analyzed (). This demonstrates that the fine fraction of the soils is significant relative to the overall bulk mass of the erodible soils in the dust source, and that fine silt-sized materials are present that could be released or fragmented in the event that saltation were to occur.
Figure 10. Normalized cumulative mass size distribution measured by a Coulter counter. Samples measured include dust deposition at the Down Valley (DV) site, as well as the fine fraction of two soil samples. Coulter counter analysis was performed using a 100 µm aperture on soil samples sieved to 53 µm. More details on the analysis can be found in the SI.
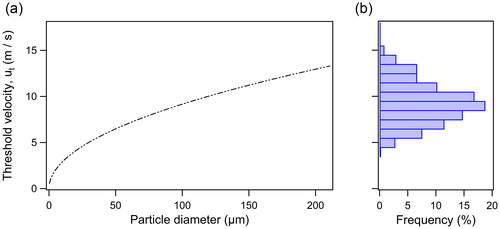
Furthermore, it is highly likely that saltation does occur at this location, as both the measured wind speeds and the calculated shear velocities at the Down Valley site are quite high relative to those previously documented to cause saltation to occur. The average shear velocity measured over the course of our campaign was 0.61 m/s ± 0.12 m/s, which is well above most thresholds for the emission of dust via the saltation/sandblasting mechanism (Bagnold Citation1941; Parajuli et al. Citation2016). We have also analyzed the size-resolved threshold velocity for entrainment. provides the comparison between the wind velocities measured at the Down Valley site during the entirety of our dust measurement campaign and the size-resolved threshold velocity for entrainment used by Ginoux et al. (Citation2001). The threshold velocities for particles 50 to 100 µm in diameter (particles that dominate in saltation processes) were surpassed throughout the majority of the campaign (56% of the time for particles 100 µm in diameter); both of these results indicate saltation occurred at this location. Finally, the data indicating high shear velocities and significant soil mass within the silt size range is consistent with the result of Nickling (Citation1978), who measured the horizontal flux of particles in the Ä’äy Chù Valley.
Figure 11. (a) The size-resolved threshold wind velocity necessary for dust entrainment, calculated using the parameterization of Ginoux et al. (Citation2001). This parameterization takes into account the physical mechanisms that lead to dust entrainment, including saltation induced by larger particles colliding with smaller particles to produce dust. (b) A histogram plot denoting the range of wind speeds calculated at a height of 10 m during 4 May to 2 June at the Down Valley site.
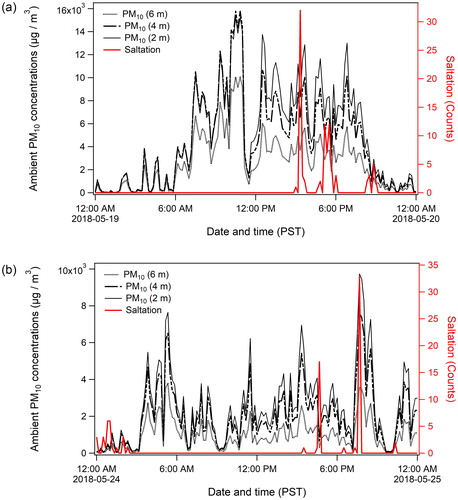
While the occurrence of the sandblasting mechanism is supported by our measurements of shear velocity and wind speed, as well as by the previous study by Nickling (Citation1978), it is noteworthy that the measurements of horizontal flux activity estimated by an installed SENSIT sensor at the Down Valley site did not detect significant saltation during the sampling period (). Furthermore, the SENSIT detected zero particles during periods of intense dust emissions. It is possible the observed trends were the result of the lack of instrumentation sensitivity to the horizontal flux of particles at the Down Valley site. SENSIT instruments possess a limit of detection in terms of the kinetic energy of impact that will be counted as a horizontal mass flux of particles (Baas Citation2004). The lack of saltation recorded during our study may be a result of saltating particles or dissociating aggregates whose impact was below the kinetic energy limit able to be registered by our SENSIT instrument – for example, insufficient momentum possibly stemming from the larger percentage of particles in the mass fraction below 53 µm. This hypothesis is supported by the work of Stout and Zobeck (Citation1996), who demonstrated that almost impossible wind speeds would be required (36 m/s) to record particles 100 µm in diameter. Despite improvements in the SENSIT instrumentation since that work, this reasoning still likely explains the underestimation. Thus, dust emission may have occurred due to sandblasting processes, but due to the limit of detection of our instrument and the fine nature of the soil particle size distribution, the horizontal mass transport may not have been recorded. Regardless of the reason for the lack of particle counts from the SENSIT, we conclude that the majority of the evidence supports the presence of the saltation/sandblasting mechanism and its contribution to the emission of dust from the Ä’äy Chù Valley.
Figure 12. Down Valley site ambient PM10 concentrations and saltation during dust events on (a) 19 May and (b) 24 May.
Detailed analysis of the saltation/sandblasting mechanism based on particle sizing and elemental composition
We have considered the elemental composition of PM10 and soil samples to investigate the detailed saltation/sandblasting dust emission mechanism, as the composition information can serve as a signature of the source material for the PM10. We have chosen to focus on PM10 analysis because the results of our dust deposition sampling are much more difficult to interpret, as these samples were collected via passive sampling over several months.
There are four ways through which sandblasting can result in dust emissions, as outlined by Huang et al. (Citation2019). First, the release of fine materials through the spalling or chipping of sand grains (defined as particles larger than 50 µm in diameter) is unlikely to be a dominant mechanism of dust emission, as the elemental composition of the PM10 particles collected was distinct from that of the bulk fractions of the soils. Second, the disintegration of clay- and silt-sized particle aggregates upon impact with the surface, or after being impacted by larger sand-sized particles, may release fine particulate matter. If this were a predominant mechanism of dust emissions in the Ä’äy Chù Valley, the PM10 elemental composition would reflect that of the fine fraction of the soils. However, this was not the case either. Furthermore, the PM10 size distribution measured by the OPC at the Down Valley site is much finer than the particle size distribution predicted by the brittle fragmentation theory developed by Kok, which details the expected particle size distribution of PM10 emitted via this emission mechanism (Kok Citation2011). For these reasons, we conclude that the disintegration of fine particle aggregates is not likely to be a dominant dust emissions mechanism resulting from saltation-sandblasting.
The third process through which saltation/sandblasting can produce dust is through the rupturing of clay coatings attached to the surface of soil grains. This process corresponds well with both the elemental and mineralogical analyses we have performed in this study, as the SEM/EDS analysis indicated that almost half of the PM10 particles were composed of clay minerals or clay mineral aggregates. Furthermore, the PM10 size distribution measured by the OPC at the Down Valley site is similar to that recorded by the Bullard, McTainsh, and Pudmenzky (Citation2004) study of the release of particulate matter due to the rupture of clay coatings. The Bullard, McTainsh, and Pudmenzky (Citation2004) study found a mode in the volume size distribution between 2.80 µm and 3.29 µm for the diameter of PM10 emitted via this mechanism, which fits much more closely with our measured normalized mass size distribution mode at 3.25 µm in diameter in comparison with the size distribution predicted by the Kok (Citation2011) brittle fragmentation theory.
In addition, this would explain the enhancement of trace elements in the PM10 samples as compared to the soil samples, both fine and bulk. It is noteworthy that if the enrichment factors were relatively consistent across all elements analyzed, the elevated minor and trace element content in the PM10 samples could also be explained by the presence of large silicate particles, such as quartz, which contribute significant mass to the soil samples relative to their trace element content and can effectively dilute the trace element mass fraction in soils. However, the fact that a wide range of enrichment factors were observed further indicates a difference in chemical composition beyond the presence of large silicate particles in the soil samples; the simultaneous observation of the elemental enrichment results and similarity of our observed particle size distribution to the results of Bullard, McTainsh, and Pudmenzky (Citation2004) further supports this conclusion. Moreover, we observed coatings on soil particles using SEM, and we confirmed using EDS analysis that the coating possessed a unique chemical composition as compared with the particle itself (Figure S4), in which the coating clearly contains Mg and Fe, unlike the particle itself. Lastly, the release of resident fine particulate matter trapped within sand particles is another mechanism through which sandblasting can result in the emission of dust; while we are unable to confirm or deny the occurrence of this dust emission mechanism, we note that these particles would need to have a very different chemical composition as compared to the fine and bulk soils, in order to explain the lack of similarity between the PM10 elemental composition and that of both the fine and bulk soils.
Conclusions
We have successfully characterized dust emissions from the Ä’äy Chù Valley in Yukon, Canada. During our sampling campaign, which took place 4 May to 2 June, 2018, we observed a significant dust event on 19 May as well as several smaller dust events during each day of the campaign. Our initial analysis indicates that the PM10 originating from the dust source comprises primarily non-spherical aluminosilicate clay mineral aggregates, as well as pure minerals such as quartz, feldspar, amphiboles, gypsum, calcite, and dolomite. Analysis of the elemental composition of soils (both bulk and fine), dust deposition, and ambient PM10 indicate enrichment of trace metal concentration with decreased particle size cutoff, with clear enrichment of PM10 as compared to bulk soil samples, and slight enrichment of PM10 as compared to dust deposition and the fine fraction (d < 53 µm) of soils. Moreover, the 24 h average concentrations of PM10 (near-federal resistance method) and PM2.5 (estimated) at all our sampling sites exceeded the air quality guidelines of the WHO. However, more sample collection is needed for a longer period in order to more fully assess the impact on air quality and potential local health risks posed by the mineral dust emitted from the Ä’äy Chù Valley. In addition, we have discussed the physical processes that may dominate in the production of dust from the Ä’äy Chù Valley, and we have highlighted the rupturing of clay mineral coatings and the release of resident fine particulate matter as the two most likely emission mechanisms that take place at this dust source. This conclusion was based on previous knowledge of the mechanism of dust emission via the extensively studied saltation/sandblasting mechanism, as well as our chemical and mineralogical analyses. Our results have demonstrated the value of monitoring dust emissions from the Ä’äy Chù Valley in the Kluane Lake region of Yukon, Canada, and highlight the importance of continued study to elucidate the chemistry and physical mechanisms of dust emissions at this site that functions as an analog for other high-latitude proglacial dust sources.
Supplemental Material
Download MS Word (1.6 MB)Acknowledgments
We respectfully acknowledge that the sample collection in this work was performed on the traditional territories of the Kluane First Nations and the Champagne and Aishihik First Nations. Furthermore, we are grateful to Kluane First Nations, Champagne and Aishihik First Nations, the Dän Keyi Renewable Resource Council, and Parks Canada, without whose permission and consultation this work would not have been possible. We also thank James Allen and Shakat Tun Wilderness Camp for allowing us to collect samples of dust deposition on their land. Many thanks to Sian and Lance Goodwin of Outpost Research Station for going above and beyond the call of duty in providing aid in the field, to Miriam Hurkuck for setting up an additional on-site camera station in June 2017, as well as to Michael Bach, Sarah Butez, Stella Sotorra, Charles Phillips, Sharpal Singh, and Kelly Hurley for volunteering their time to help with the project. Thank you to Jonathan Abbatt of the University of Toronto for kindly allowing us to use his aerodynamic particle sizer. And of course, thanks are due to Donna Sueper of Aerodyne Research, whose code we used to determine diurnal trends in our OPC and net radiometer data. Finally, we appreciate the contributions of Olivier Girard and the Center for the Microscopic Characterization of Materials, of Polytechnique Montréal, for their aid in the SEM/EDS analyses.
Additional information
Funding
Related Research Data
References
- Ashrafi, N., and B. Hajalilou. 2017. Geochemistry of the Paleocene sediments from SW Ahar: Implications for provenance, tectonics and source rock weathering. Iran. J. Earth Sci. 9:48–65.
- Atkinson, J. D., B. J. Murray, M. T. Woodhouse, T. F. Whale, K. J. Baustian, K. S. Carslaw, S. Dobbie, D. O’sullivan, and T. L. Malkin. 2013. The importance of feldspar for ice nucleation by mineral dust in mixed-phase clouds. Nature 498 (7454):355. doi:10.1038/nature12278.
- Avila, A., M. Alarcon, and I. Queralt. 1998. The chemical composition of dust transported in red rains—Its contribution to the biogeochemical cycle of a holm oak Forest in Catalonia (Spain). Atmos. Environ. 32 (2):179–91. doi:10.1016/S1352-2310(97)00286-0.
- Baas, A. C. 2004. Evaluation of saltation flux impact responders (Safires) for measuring instantaneous aeolian sand transport intensity. Geomorphology 59 (1-4):99–118. doi:10.1016/j.geomorph.2003.09.009.
- Bagnold, R. A. 1941. The physics of blown sand and desert dunes. Dordrecht: Springer.
- Barrie, L. A. 1986. Arctic air pollution: An overview of current knowledge. Atmos. Environ. 20 (4):643–63. doi:10.1016/0004-6981(86)90180-0.
- Bullard, J. E., M. Baddock, T. Bradwell, J. Crusius, E. Darlington, D. Gaiero, S. Gassó, G. Gisladottir, R. Hodgkins, R. McCulloch, C. McKenna-Neuman, T. Mockford, H. Stewart, and T. Thorsteinsson. 2016. High-latitude dust in the earth system. Rev. Geophys. 54 (2):447–85. doi:10.1002/2016RG000518.
- Bullard, J. E., G. H. McTainsh, and C. Pudmenzky. 2004. Aeolian abrasion and modes of fine particle production from natural red dune sands: An experimental study. Sedimentology 51 (5):1103–25. doi:10.1111/j.1365-3091.2004.00662.x.
- Crusius, J., A. W. Schroth, S. Gasso, C. M. Moy, R. C. Levy, and M. Gatica. 2011. Glacial flour dust storms in the Gulf of Alaska: Hydrologic and meteorological controls and their importance as a source of bioavailable iron. Geophys. Res. Lett. 38 (6):L06602. doi:10.1029/2010GL046573.
- Dubovik, O., B. Holben, T. F. Eck, A. Smirnov, Y. J. Kaufman, M. D. King, D. Tanré, and I. Slutsker. 2002. Variability of absorption and optical properties of key aerosol types observed in worldwide locations. J. Atmos. Sci. 59 (3):590–608. doi:10.1175/1520-0469(2002)059<0590:VOAAOP > 2.0.CO;2.
- EPA. 2007. Method 3051A (SW-846): Microwave assisted acid digestion of sediments, sludges, and oils. Washington, DC: U.S. EPA.
- Falkovich, A. H., E. Ganor, Z. Levin, P. Formenti, and Y. Rudich. 2001. Chemical and mineralogical analysis of individual mineral dust particles. J. Geophys. Res. Atmos. 106 (D16):18029–36. doi:10.1029/2000JD900430.
- Formenti, P., W. Elbert, W. Maenhaut, J. Haywood, and M. Andreae. 2003. Chemical composition of mineral dust aerosol during the Saharan dust experiment (SHADE) airborne campaign in the Cape Verde region, September 2000. J. Geophys. Res. Atmos. 108 (D18):8576. doi:10.1029/2002JD002648.
- Formenti, P., L. Schütz, Y. Balkanski, K. Desboeufs, M. Ebert, K. Kandler, A. Petzold, D. Scheuvens, S. Weinbruch, and D. Zhang. 2011. Recent progress in understanding physical and chemical properties of African and Asian mineral dust. Atmos. Chem. Phys. 11 (16):8231–56. doi:10.5194/acp-11-8231-2011.
- Gillette, D. A., I. H. Blifford, Jr, and C. R. Fenster. 1972. Measurements of aerosol size distributions and vertical fluxes of aerosols on land subject to wind erosion. J. Appl. Meteorol. 11 (6):977–87. doi:10.1175/1520-0450(1972)011<0977:MOASDA > 2.0.CO;2.
- Gillies, J., and L. Berkofsky. 2004. Eolian suspension above the saltation layer, the concentration profile. J. Sediment. Res. 74 (2):176–83. doi:10.1306/091303740176.
- Ginoux, P., M. Chin, I. Tegen, J. M. Prospero, B. Holben, O. Dubovik, and S.-J. Lin. 2001. Sources and distributions of dust aerosols simulated with the GOCART model. J. Geophys. Res. Atmos. 106 (D17):20255–73. doi:10.1029/2000JD000053.
- Groot Zwaaftink, C. D., H. Grythe, H. Skov, and A. Stohl. 2016. Substantial contribution of northern high-latitude sources to mineral dust in the arctic. J. Geophys. Res. Atmos. 121:13,678–613,697. doi:10.1002/2016JD025482.
- Haywood, J., and O. Boucher. 2000. Estimates of the direct and indirect radiative forcing due to tropospheric aerosols: A review. Rev. Geophys. 38 (4):513–43. doi:10.1029/1999RG000078.
- Huang, J., P. Minnis, B. Lin, T. Wang, Y. Yi, Y. Hu, S. Sun-Mack, and K. Ayers. 2006. Possible influences of Asian dust aerosols on cloud properties and radiative forcing observed from MODIS and CERES. Geophys. Res. Lett. 33 (6):L06824. doi:10.1029/2005GL024724.
- Huang, Y., J. F. Kok, R. L. Martin, N. Swet, I. Katra, T. E. Gill, R. L. Reynolds, and L. S. Freire. 2019. Fine dust emissions from active sands at coastal Oceano Dunes, California. Atmos. Chem. Phys. 19 (5):2947–64. doi:10.5194/acp-19-2947-2019.
- Kalashnikova, O., and I. Sokolik. 2004. Modeling the radiative properties of nonspherical soil-derived mineral aerosols. J. Quant. Spectrosc. Radiat. Transf. 87 (2):137–66. doi:10.1016/j.jqsrt.2003.12.026.
- Kappos, A. D., P. Bruckmann, T. Eikmann, N. Englert, U. Heinrich, P. Höppe, E. Koch, G. H. M. Krause, W. G. Kreyling, K. Rauchfuss, et al. 2004. Health effects of particles in ambient air. Int. J. Hygiene Environ. Health 207 (4):399–407. doi:10.1078/1438-4639-00306.
- Kok, J. F. 2011. A scaling theory for the size distribution of emitted dust aerosols suggests climate models underestimate the size of the global dust cycle. Proc. Natl. Acad. Sci. USA 108 (3):1016–21. doi:10.1073/pnas.1014798108.
- Lee, Y. H., K. Chen, and P. J. Adams. 2009. Development of a global model of mineral dust aerosol microphysics. Atmos. Chem. Phys. 9 (7):2441–58. doi:10.5194/acp-9-2441-2009.
- Lohmann, U., and K. Diehl. 2006. Sensitivity studies of the importance of dust ice nuclei for the indirect aerosol effect on stratiform mixed-phase clouds. J. Atmos. Sci. 63 (3):968–82. doi:10.1175/JAS3662.1.
- Loosmore, G. A., and J. R. Hunt. 2000. Dust resuspension without saltation. J. Geophys. Res. Atmos. 105 (D16):20663–71. doi:10.1029/2000JD900271.
- Marticorena, B., and G. Bergametti. 1995. Modeling the atmospheric dust cycle: 1. Design of a soil‐derived dust emission scheme. J. Geophys. Res. Atmos. 100 (D8):16415–30. doi:10.1029/95JD00690.
- Miller, S. D., F. Wang, A. B. Burgess, S. McKenzie Skiles, M. Rogers, and T. H. Painter. 2016. Satellite-based estimation of temporally resolved dust radiative forcing in snow cover. J. Hydrometeorol. 17 (7):1999–2011. doi:10.1175/JHM-D-15-0150.1.
- Mishchenko, M. I., J. W. Hovenier, and L. D. Travis. 1999. Light scattering by nonspherical particles: Theory, measurements, and applications. Academic press.
- Nickling, W. 1978. Eolian sediment transport during dust storms: Slims river valley, Yukon territory. Can. J. Earth Sci. 15 (7):1069–84. doi:10.1139/e78-114.
- Paoletti, L., B. M. Bruni, L. Arrizza, S. Mazziotti-Tagliani, and A. Pacella. 2008. A micro-analytical SEM-EDS method applied to the quantitative chemical compositions of fibrous amphiboles. Period. Mineral. 77:63–73.
- Parajuli, S. P., T. M. Zobeck, G. Kocurek, Z.-L. Yang, and G. L. Stenchikov. 2016. New insights into the wind-dust relationship in sandblasting and direct aerodynamic entrainment from wind tunnel experiments. J. Geophys. Res. Atmos. 121:1776–92. doi:10.1002/2015JD024424.
- Phalen, R., Cuddihy, R. G. Fisher, G. L. Moss, O. R. Schlesinger, R. B. Swift, D. L. Yeh. C., and H. 1991. Main features of the proposed NCRP respiratory tract model. Radiat. Protect. Dosim. 38 (1-3):179. doi:10.1093/rpd/38.1-3.179.
- Prospero, J. 1999. Long-term measurements of the transport of African mineral dust to the southeastern United States: Implications for regional air quality. J. Geophys. Res. Atmos. 104 (D13):15917–27. doi:10.1029/1999JD900072.
- Prospero, J. M. 1999. Long-range transport of mineral dust in the global atmosphere: Impact of african dust on the environment of the southeastern United States. Proc. Natl. Acad. Sci. USA 96 (7):3396–403. doi:10.1073/pnas.96.7.3396.
- Qian, Y., T. J. Yasunari, S. J. Doherty, M. G. Flanner, W. K. M. Lau, J. Ming, H. Wang, M. Wang, S. G. Warren, and R. Zhang. 2015. Light-absorbing particles in snow and ice: Measurement and modeling of climatic and hydrological impact. Adv. Atmos. Sci. 32 (1):64–91. doi:10.1007/s00376-014-0010-0.
- Richon, C., J. C. Dutay, F. Dulac, R. Wang, and Y. Balkanski. 2018. Modeling the biogeochemical impact of atmospheric phosphate deposition from desert dust and combustion sources to the mediterranean sea. Biogeosciences 15 (8):2499–524. doi:10.5194/bg-15-2499-2018.
- Shao, Y. 2001. A model for mineral dust emission. J. Geophys. Res. Atmos. 106 (D17):20239–54. doi:10.1029/2001JD900171.
- Shao, Y. 2008. Physics and modelling of wind erosion. Springer.
- Shugar, D. H., J. J. Clague, J. L. Best, C. Schoof, M. J. Willis, L. Copland, and G. H. Roe. 2017. River piracy and drainage basin reorganization led by climate-driven glacier retreat. Nat. Geosci. 10 (5):370. doi:10.1038/ngeo2932.
- Sokolik, I. N., and O. B. Toon. 1996. Direct radiative forcing by anthropogenic airborne mineral aerosols. Nature 381 (6584):681. doi:10.1038/381681a0.
- Stout, J. E., and T. M. Zobeck. 1996. Establishing the threshold condition for soil movement in wind-eroding fields. Paper presented at the Proceedings of International Conference on Air Pollution from Agricultural Operations, Kansas City, MO, February 7–9, pp. 65–72, Kansas City, Missouri. February 7–9, 1996.
- Usher, C. R., H. Al-Hosney, S. Carlos-Cuellar, and V. H. Grassian. 2002. A laboratory study of the heterogeneous uptake and oxidation of sulfur dioxide on mineral dust particles. J. Geophys. Res. Atmos. 107 (D23):ACH 16. doi:10.1029/2002JD002051.
- WHO. 2006. WHO air quality guidelines for particulate matter, ozone, nitrogen dioxide and sulfur dioxide-global update 2005 - Summary of risk assessment. Geneva: WHO.