
 ?Mathematical formulae have been encoded as MathML and are displayed in this HTML version using MathJax in order to improve their display. Uncheck the box to turn MathJax off. This feature requires Javascript. Click on a formula to zoom.
Abstract
Understanding heterogeneous ice nucleation induced by ice nucleating particles (INPs) is hindered by analytical challenges in accurately determining the freezing temperature spectrum, abundance, and physicochemical properties of INPs. Here we evaluate the performance of a microfluidic device that employs a “store and create” approach to measure the ice nucleation properties of approximately 600 uniformly sized nanoliter water droplets. These droplets are immersed in surfactant-free environmentally sustainable squalene oil and do not contact the polymer walls of the microfluidic device. The device interfaced with a cold plate temperature controller has a greatly reduced background freezing temperature spectrum for filtered water droplets compared to conventional microliter droplet-on-substrate freezing methods. Droplets containing particles of interest are readily generated on-chip from a suspension of particles in water. Background freezing for 6 nL water droplets exhibits a median freezing temperature of −33.7 ± 0.4 °C, close to the theoretical freezing temperature of −34.5 °C. The immersion freezing temperature spectra obtained from Snomax bacterial and illite mineral particles compares well with literature data, and the freezing contribution from either type of particle can be separated from a mixed suspension. Our approach generates a highly uniform droplet size distribution, causes no clogging of the microfluidic device, and is capable of reproducible droplet refreezes. The high-resolution freezing spectra obtained from large droplet number arrays enables the use of the derivative INP temperature spectrum analysis to quantitatively distinguish between different classes of INPs. The lower and consistent filtered water background freezing temperature enables measurements of almost the entire immersion freezing temperature regime from −33 to 0 °C, and quantification of weaker but often abundant INPs such as those found in biomass-burning smoke aerosol.
Copyright © 2019 American Association for Aerosol Research
EDITOR:
Mixed-phase clouds that contain both liquid water droplets and ice crystals that form on cloud particle precursors are an important regulator of the Earth’s climate, however, we cannot sufficiently predict their evolution and lifecycle (Mülmenstädt et al. Citation2015; Murray et al. Citation2012; Rosenfeld et al. Citation2008). The physicochemical properties of each particle can inhibit or enhance its ability to either uptake water or nucleate an ice crystal under certain thermodynamic conditions (Hoose and Möhler Citation2012; Murray et al. Citation2012). Ice nucleation can dramatically alter the lifecycle and evolution of a cloud’s microphysical and radiative properties, and mixed-phase or glaciated clouds are the major source of precipitation over land (Mülmenstädt et al. Citation2015). There is a large uncertainty associated with the magnitude and sign of the radiative forcing attributed to aerosol-cloud feedbacks since we do not fully understand how atmospheric particles alter cloud microphysics and evolution, and do not have good empirical constraints on the abundance, distribution, and ice nucleation properties of atmospheric ice nucleating particles (INPs) (Mülmenstädt et al. Citation2015; Vali Citation2014; Myhre et al. Citation2013; Murray et al. Citation2012; Rosenfeld et al. Citation2008).
Ice nucleation also plays a critical role in the manufacturing of food and pharmaceuticals, where freezing is a key processing step, and in cryobiology to avoid cell and tissue damage from ice crystallization. For cryopreservation of biological cells, seed particles are added to the cryoprotectant to increase the freezing temperature. The warmer freezing temperature helps prevent intracellular ice formation and increases the post-thaw viability of the cells (Weng et al. Citation2016; Morris and Acton Citation2013; Trad, Toner, and Biggers Citation1999; Harris et al. Citation1991). Similarly in foods, using bacterial cells or extracellular ice nucleators (released by the bacteria) to promote ice nucleation has been suggested as a way to prevent undesirable texture changes in food, reduce freezing times and energy storage costs (Li and Lee Citation1998).
Even though ice nucleation plays a major role in many fields, the ice nucleation process is still not well understood. Water droplets can freeze via two main pathways: homogeneously, and through heterogeneous nucleation catalyzed by INPs or other surface interactions (Koop and Murray Citation2016; Vali et al. Citation2015; Vali Citation1971, Citation1996, Citation2014; Koop et al. Citation2000). There is a large knowledge gap pertaining to the heterogeneous freezing of atmospheric droplets containing rare INPs. Immersion freezing occurs when a particle immersed in a droplet initiates freezing (Vali et al. Citation2015; Vali Citation2014). It has been found to be the most important heterogeneous freezing pathway for tropospheric mixed-phase clouds due to the high concentration of supercooled liquid water (Murray et al. Citation2012; Rosenfeld et al. Citation2008; Schnell and Vali Citation1976). The physicochemical properties that determine the freezing temperature of an INP-containing droplet are complex and under active investigation (Vali Citation2014; Wright and Petters Citation2013; Murray et al. Citation2012; DeMott et al. Citation2011). Fundamental understanding of ice nucleating particles is limited by our ability to accurately characterize the physicochemical properties of different types of individual submicron particles, their ice nucleation properties, and by challenges in measuring their atmospheric abundance.
Many techniques have been developed to measure INPs and better understand their effects on cloud glaciation and precipitation (Cziczo et al. Citation2017; Tobo Citation2016; Whale et al. Citation2015; Rogers et al. Citation2001; Vali Citation1971; Bigg Citation1953). Currently available methods have important limitations for measuring rare atmospheric INPs because they are either too large in scale (e.g., cloud expansion chambers), cannot reliably probe atmospheric particles (e.g., an electrodynamic balance), or require expensive instrumentation that can suffer from high background signal (e.g., continuous flow diffusion chambers; DeMott et al. Citation2015; Hiranuma et al. Citation2015; Tong et al. Citation2015; Wex et al. Citation2015; Niemand et al. Citation2012; Petters et al. Citation2009; Stetzer et al. Citation2008; Rogers et al. Citation2001). Cold plate droplet freezing techniques overcome many of these issues and have become popular over the last decade since they are compact, portable, can accommodate large numbers of droplets, and can preserve droplets of interest for future physical and chemical analysis. In this technique droplets of 0.1–10 µL volume typically rest on a hydrophobic substrate while a cold plate cools the substrate at a controlled rate until all droplets are frozen (Polen et al. Citation2018; Cziczo et al. Citation2017). Although this technique has many advantages, the droplets are in physical contact with a rigid hydrophobic surface which may act as an ice nucleating surface and induce freezing at an artificially warmer temperature (Tobo Citation2016; Whale et al. Citation2015). Generation of a population of uniformly sized droplets of nanoliter volume closer to that of cloud droplets is also challenging. Due to the artificially high filtered water background freezing temperatures commonly observed (median freezing temperature, T50, of −20 to −25 °C) microliter droplet-on-substrate methods are unable to probe the colder end of the mixed-phase cloud regime down to ∼ –35 °C (Polen et al. Citation2018; Budke and Koop Citation2015; Wex et al. Citation2015; Whale et al. Citation2015; Wright and Petters Citation2013). Additionally, these techniques may generate non-uniform droplet size distributions (Whale et al. Citation2015; Hader, Wright, and Petters Citation2014; Wright and Petters Citation2013), can experience interference from the Wegener-Bergeron-Findeison process (where frozen droplets grow at the expense of the liquid droplets around them; Tobo Citation2016), rely on surfactants to prevent the droplets from coalescing (Reicher, Segev, and Rudich Citation2018; Tarn et al. Citation2018), and some require expensive piezo-electric print assemblies (Peckhaus et al. Citation2016).
To avoid many of the analytical method limitations described above, microfluidic droplet generation techniques have been utilized to study ice nucleation (Metcalf, Narayan, and Dutcher Citation2018; Weng, Swei, and Toner Citation2018; Riechers et al. Citation2013; Sgro and Chiu Citation2010; Edd et al. Citation2009; Sgro, Allen, and Chiu Citation2007), and a few groups have applied microfluidics to study immersion freezing induced by particles (Reicher, Segev, and Rudich Citation2018; Tarn et al. Citation2018; Peckhaus et al. Citation2016; Weng et al. Citation2016; Stan et al. Citation2009). Microfluidic approaches have many inherent advantages due to their microscale features. They consume less reagent than their macroscale counterparts, have faster diffusion time scales, and are capable of rapidly generating large numbers of monodisperse droplets (Moyle, Walker, and Anna Citation2012; Anna, Bontoux, and Stone Citation2003). Sgro, Allen, and Chiu (Citation2007) pioneered a microfluidic approach to examine ice nucleation using a single-stage thermoelectric cooler (TEC) to freeze aqueous droplets, and Stan et al. (Citation2009) improved upon this design using dynamic on-chip temperature control. They achieved real-time observations of homogeneous freezing of pure water and heterogeneous freezing of suspensions of AgI(s) in droplets as they moved through a single microchannel. Their approach enabled freezing temperature measurements of 75 0.2 nL droplets per second, but the particle concentrations and cooling rates used were several orders of magnitude larger than atmospheric conditions. Fast cooling rates can shift the observed droplet freezing temperature many degrees colder than would be observed at atmospherically relevant cloud updraft velocities with cooling rates in the range of 0.1–1 °C/min (Mason et al. Citation2015; Vali Citation2014; Wright and Petters Citation2013). The issue with faster cooling rates is that the freezing event is observed to occur at a temperature colder than when freezing actually occurred. Additionally, the on-chip temperature gradient control using micro-TEC (Peltier) devices developed by Stan et al. (Citation2009) is challenging to implement.
Riechers et al. (Citation2013) used a microfluidic T-junction to study homogeneous freezing of microliter droplets immersed in oil with added surfactant to prevent coalescence. The produced droplets were then collected off-chip to determine the ice nucleation properties of filtered water using a static conventional cold stage cooling assay. Similarly, Tarn et al. (Citation2018) utilized a flow focusing droplet generation technique to produce droplets and collected the droplets off-chip to characterize the freezing ability of atmospherically relevant particles. Building upon the previous work described above, Reicher, Segev, and Rudich (Citation2018) utilized a flow focusing technique to generate and capture 550 40 µm droplets in a micro-array to study the static freezing behavior of many independent droplets. This work built upon the system developed by Schmitz et al. (Citation2009), where droplets are forced through a tight constriction before being trapped in the microarray. Since the droplets are forced through the constriction, the channels have the potential to clog and surfactant is required to prevent coalescence of the droplets prior to trapping.
Although surfactant oil mixtures have been used without interference in all of the preceding techniques, ideally, surfactants should be avoided since they can potentially deteriorate during a cooling cycle (Tarn et al. Citation2018), are costly, and are often composed of polyfluorinated compounds that are extremely persistent environmental contaminants. This deterioration is especially important for systems in which droplets are in contact with each other as the droplets can coalesce. The coalescence of droplets prevents droplet refreeze experiments that provide valuable information regarding the repeatability of heterogeneous ice nucleation and the roles of deterministic versus stochastic (time dependent) factors in the heterogeneous ice nucleation process (Peckhaus et al. Citation2016; Vali Citation2014; Wright and Petters Citation2013).
Inspired by prior microfluidic approaches to measure the immersion freezing properties of INPs, we have developed a novel microfluidic approach to generate isolated INP containing droplets that is placed on top of a cold plate system to determine the freezing properties of INPs. In this method, we utilize a “store and create” droplet generation technique to produce monodisperse droplets suspended in oil. These droplets are not in contact with a rigid surface and are completely isolated from one another in individual microwells, and thus do not require the use of surfactant to prevent coalescence. We evaluated the ability of our microfluidic droplet freezing system to obtain high-resolution freezing spectra for systems ranging from the homogeneous freezing of filtered water to the heterogeneous ice nucleation of biological ice nucleants at the upper end of the heterogeneous freezing temperature range approaching 0 °C. The reproducibility of droplet refreeze experiments was also assessed. The ability to resolve the role of concentration of different types of ice nucleants was demonstrated using the differential ice nucleus temperature spectrum (k(T)) approach. This was first introduced by Vali in 1971 but has seen little application until very recently as it requires a large population of uniformly sized droplets with a low background freezing temperature; our new analytical approach meets all these criteria (Polen et al. Citation2018; Vali Citation1971, Citation2019).
Methods
Microfluidic device fabrication
Microfluidic devices were produced using standard soft lithography methods described in the online supplementary information (SI) (Whitesides and Stroock Citation2001; Duffy et al. Citation1998). The channels of the device and the base substrate used to close the channels were formed out of polydimethylsiloxane (PDMS, Dow Sylgard 184) at a 10:1 ratio of polymer to crosslinking agent. The thickness of the base was 1.14 0.04 mm, and that of the top was 2.35
0.11 mm. The base and top were bonded together by plasma bonding to ensure uniform wetting behavior (Duffy et al. Citation1998). During the bonding process the PDMS surface become hydrophilic (Bhattacharya et al. Citation2005). To regenerate the initial hydrophobic surface properties the assembled PDMS device was placed in a 180 °C oven for 1 h. Furthermore, we soaked the devices in squalene oil (VWR, ≥98%) for 3 days to ensure the devices are completely hydrophobic and exhibit a uniform coating of squalene within the channels.
Droplet generation
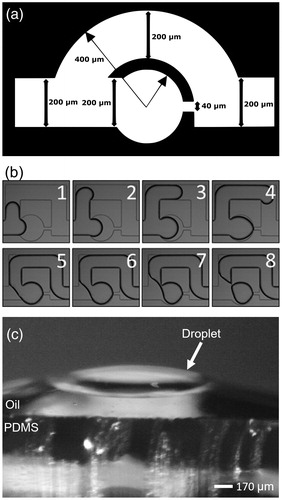
We utilized a previously developed “store and create” type droplet generation technique shown in (Boukellal et al. Citation2009). Droplets created using this technique are generated on-chip in static microwells without the use of surfactant (Nandy et al. Citation2019; Bleier, Anna, and Walker Citation2018; Nandy and Dutcher Citation2018; Nelson Citation2016; Bithi and Vanapalli Citation2010; Boukellal et al. Citation2009). Each circular microwell was 300 µm in diameter and had a 40 µm wide exit orifice, as shown in . Prior to use, the microfluidic device was flushed with new squalene oil to remove any un-crosslinked PDMS and debris that may have become trapped in the channels during fabrication. Next, the device was filled with an aqueous particle suspension (e.g., 0.01 wt% illite mineral particles) or with filtered water at 15 µL/min using a syringe pump (Braintree Scientific, Inc., BS-300). The aqueous suspension flow displaces the oil in the bypass channels and microwells. The 40 µm wide orifice allows the oil to leave the microwell while acting as a capillary valve for the water due to the need for extra applied pressure to overcome the water-oil interfacial tension, thus retaining the water droplet. Once approximately half the microwells were filled with water or the aqueous suspension, squalene oil was injected into the device at 75 µL/min. The oil displaces most of the water in the channels causing aqueous droplets to pinch off and become trapped in the individual microwells, as shown in . The droplets produced are pancake-shaped since the depth of the channel is less than the diameter of the microwells. Due to the hydrophobic nature of the PDMS surface, the oil preferentially coats the walls ensuring the droplets are never in contact with the PDMS and are completely engulfed by oil (Bretherton Citation1961), as shown in . In contrast to other microfluidic techniques used to study ice nucleation, the store and create method ensures that the microdroplets are always isolated from each other once created. This negates the need for surfactant or fluorinated oils to prevent droplet coalescence.
Figure 1. (a) Schematic diagram of a single microwell used to produce water droplets in the “store and create” microfluidic device. The main channel of the device is 200 µm in width and is connected to a 300 µm diameter microwell. At the opposite end of the microwell is a 40 µm orifice that acts as a capillary valve. The uniform depth of the channel is ≈90 µm. (b) A time sequence of images demonstrating the “store and create” process in a single microwell. The top row shows the filling of the microfluidic device with water. The bottom row shows the displacement of water by a flow of squalene oil. The final image at the lower right shows the microwell containing a single isolated water droplet. (c) A side view of a water droplet above a squalene-coated treated PDMS surface to verify the PDMS surface hydrophobicity. The oil preferentially coats the PDMS surface and separates the water droplet and PDMS interfaces, so they are not in contact. A thinner micron sized lubrication oil layer prevents droplet–PDMS interactions in the microfluidic device.
Particle suspensions
The water used in the filtered water control experiments and in the particle suspensions was produced by filtering HPLC grade water (Sigma Aldrich, HPLC Plus 34877) through a 0.02-micron anotop filter (Whatman, 6809-4102) (Polen et al. Citation2018). Bulk suspensions of Snomax® bacterial particles (York International) and illite NX mineral particles (Arginotec, NX nanopowder) were created in 10 mL quantities and stored in plastic vials prior to injection into the microfluidic device. Snomax® was stored at –10 °C as dry pellets and only removed from the standard lab freezer when suspensions were formulated. In each case, a stock suspension of approximately 0.01 wt% particles was created. Lower concentration suspensions were diluted from the stock suspensions with the filtered water. Biomass-burning aerosol (BBA) was created and collected by burning cutgrass or sawgrass collected from North Carolina in an open pan, injecting the smoke into a 12 m3 Teflon smog chamber using a Dekati eductor diluter, and collecting the chamber aerosol onto a nuclepore polycarbonate filter (Whatman, 111103) in an in-line filter sampler (Ahern et al. Citation2018). Further details for BBA collection are provided in the SI.
Droplet freezing assay
The immersion-mode freezing experiments were performed using a variation of the Carnegie Mellon University cold stage (CMU-CS) system described recently by Polen et al. (Citation2018) (Beydoun, Polen, and Sullivan Citation2017; Polen, Lawlis, and Sullivan Citation2016). The system was designed to be compatible with a microfluidic chip droplet array. The cold plate is a three-stage thermoelectric air chiller (TECA, AHP-1200CAS) that acts as the heat sink for an external single-stage TEC (TE Technology Inc., VT-127.1.4-1.5-72). The single stage thermoelectric element sits on top of the air-chiller and directly beneath the droplet array. The single-stage TEC was installed to create uniform temperature control of the droplet array that resides in the microfluidic chip above it. It was enclosed in an aluminum block that also contained a thermistor (TE Technology Inc., MP-3176) for monitoring the temperature of the cold plate during a cooling cycle, with an uncertainty of ±0.02 °C.
To perform a cooling assay, the droplet-filled microfluidic device was placed on the aluminum block of the cold plate, sealed with an acrylic lid (), and the temperature initially held at 10 °C. Then the temperature was ramped to 0 °C at a rate of 1 °C/min and then held at 0 °C for 10 minutes to perform a thermal soak. Next, the temperature was ramped down to −40 °C at a rate of 1 °C/min, or until all the droplets had frozen. Further details and temperature calibration procedures are provided in the SI. Each measured temperature ramp was repeatable to within the ±0.2 °C uncertainty of the K-type thermocouple.
Figure 2. (a) The design of the cold plate assembly with the microfluidic chip enclosed in an acrylic chamber. (b) Top view of the darkfield mask used to fabricate the microfluidic device master mold, showing the array of 720 individual microwells. The device has 24 parallel channels along each row and 30 equally spaced microwells per row. (c) Top view of the droplet-filled device placed on a gold-coated silicon wafer during a cooling assay. The gold-coated silicon wafer acts as a mirror and a double image can be seen for the liquid droplets (clear/dark) and frozen droplets (white).
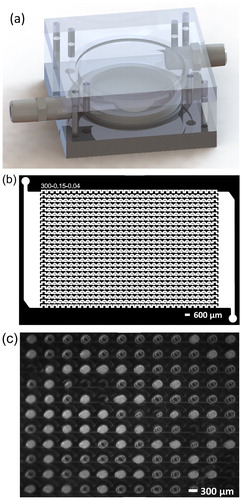
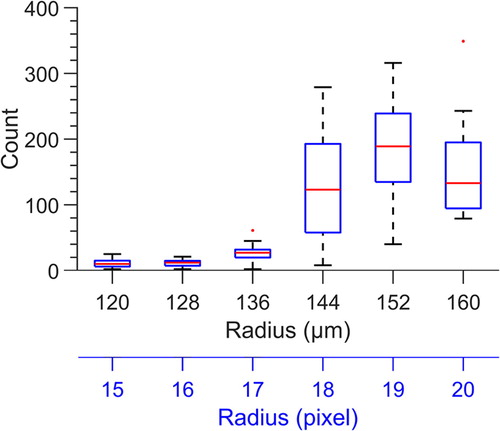
Figure 3. Size distribution of water droplets generated in the “store and create” 6 nL microfluidic device. Droplet radius is retrieved in pixels from the microscope images and then converted to microns, where 1 pixel = 8 microns. Due to the dimensions of the microwell, it is not possible for a droplet to have a radius greater than 160 m.
With the microfluidic device placed within the cold plate chamber, we captured images of the droplets using a CMOS camera (Mightex, SME-B050-U) attached to a reflectance microscope (Amscope). The droplets were illuminated by a LED light ring with a gold-coated silicon wafer (Ted Pella, 16012-G) as the image backdrop. The gold-coated wafer enables us to see the channels and droplets via reflectance microscopy, as well as to differentiate the liquid (clear/dark) and frozen (white) droplets, as shown in . In our camera assembly we recorded images with a resolution of 1600 × 1200 pixels with 5.0× magnification at ≈ 0.07 °C intervals (every 5–6 s). The procedures for detection of droplet freezing by image analysis using the derivative of the grayscale value are described in the SI.
Freezing spectrum analysis
The droplet frozen fraction temperature spectra obtained from the newly developed microfluidic technique are compared to other techniques that use different sized droplets and particle weight percentages, by normalizing the frozen fraction curves to the droplet volume and then to the average total particle mass or surface area in each droplet. For the illite suspensions, the frozen fractions extracted by the freezing analysis program were converted to the ice active surface site density per surface area metric, ns, using EquationEquation (1)(1)
(1) :
(1)
(1)
where
is the droplet frozen fraction at a given temperature T, SA is the total particle surface area per droplet, V is the droplet volume, c is the average mass of particles (in g m−3) in the droplet, and ϕ is the Brunauer-Emmett-Teller N2(g) adsorption-based surface area-to-mass ratio (Beydoun, Polen, and Sullivan Citation2016; Hoose and Möhler Citation2012; Murray et al. Citation2012; Vali Citation1971). To convert the weight percentage of illite per droplet to total particle surface area we used BET measurements previously reported in Hiranuma et al. (Citation2015) of 124.4 m2 g−1 and the volume per droplet as described in EquationEquation (2)
(2)
(2) below. The Illite NX sample used in this study was from the same samples used by Hiranuma et al. (Citation2015) as part of an interlaboratory comparison study during for the INUIT project. The surface area calculations for Hiranuma et al. and our results shown in are converted using the same measured N2 absorption BET surface area, 124.4 m2 g−1.
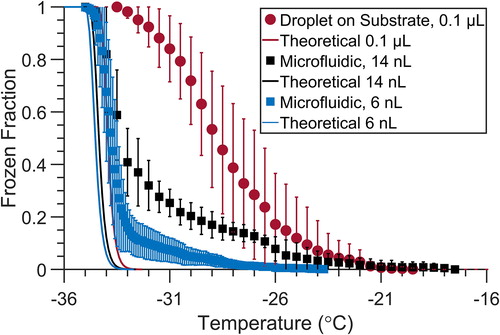
Figure 4. Droplet freezing temperature spectra for 6 nL (n = 10) and 14 nL (n = 6) droplets of filtered water stored in the microfluidic device (squares), compared with 0.1 µL (n = 13) droplets placed on top of a hydrophobic glass cover slip (circles). Droplets were immersed in squalene oil in all cases. Spectra are the average of n replicate arrays, and error bars are the standard deviation. Theoretical spectra for homogeneous freezing for 0.1 µL, 14 nL and 6 nL droplets are shown as solid lines in red, black, and blue, respectively, using the parameterization of Koop and Murray (Citation2016).
The volume of the pancake-shaped droplets can be found using:
(2)
(2)
where h is the height of channel and d is the diameter of the droplet trapped in the microwell (Vuong Citation2014; Vuong and Anna Citation2012). The droplet dimensions are determined from the pixel analysis of the image as described in the SI, and assuming the droplet height corresponds to the height of the microwell. The channel heights of three devices were cross-sectioned and then imaged by a CCD camera (Pulnix TM-7CN). These images were compared to a S78 micrometer scale (Electron Microscopy Sciences) in ImageJ resulting in a channel height of approximately 94.7 ± 3.2 µm. For this study we have used two different device geometries, one with 720 microwells of 300
m diameter resulting in a droplet volume of 6 nL, and one with 40 microwells of 450
m diameter resulting in a droplet volume of 14 nL. Both droplet volumes were rounded to the nearest larger whole number to account for limitations in our pixel measurements. The 450
m diameter droplets were used to explore the droplet volume dependence of the homogeneous freezing temperature using filtered water. All other experiments were conducted using the 300
m diameter (6 nL) device, unless otherwise noted.
Since bacterial particles do not have a uniform surface area, the Snomax freezing spectra were instead normalized by the ice active surface density per unit mass, nm, using EquationEquation (3)(3)
(3) :
(3)
(3)
where m is the average total mass of particles per droplet. The total mass per particle was estimated by assuming each droplet has the same weight percentage of particles per water volume as the stock suspension. To quantitatively differentiate freezing spectra close to our filtered water background freezing and the actual particle suspension, we utilized the differential ice nucleus concentration framework described by Vali (Citation1971, Citation2019):
(4)
(4)
where k is the differential nucleus concentration (cm−3 °C−1), ΔT is a temperature interval (but not just the temperature interval between successive image frames), V is the droplet volume, ΔN is the number of droplets that froze within the temperature interval (ΔT), and N is the number of remaining unfrozen droplets (Polen et al. Citation2018; Vali Citation2018, Citation2019).
Results and discussion
Filling the droplet microwells
The volume of each droplet created and the fill efficiency of the microfluidic device was evaluated using the images of the filled chip. The entire device occupies an area larger than the field of view of the camera at a resolution sufficient for droplet volume measurement, so 648 of the 720 total 6 nL droplet microwells were visualized. Of those 648 microwells, an average of 536 ± 46 contained droplets in n = 23 trials. Using the droplet selection criteria described in the SI, an average of 487 ±50 droplets (≈75% of the microwells) were found in the allowable size range. These viable droplets had an average diameter and volume of 300 ± 18
m, and 5.8 ± 0.7 nL, respectively ().
Freezing spectra obtained from static microfluidic droplet arrays
Homogeneous freezing of filtered water droplets
Droplets containing filtered water were used to evaluate the accuracy of the freezing spectrum obtained from the static microfluidic droplet array. Three different droplet volumes were considered: 6 nL, 14 nL, and 0.1 L droplets. The 0.1
L volume droplets were produced using a micropipette, placed on a hydrophobic glass cover slip under squalene oil, and subjected to the temperature ramp described above. The droplet freezing temperature spectrum is much broader for the 0.1
L droplets frozen using the conventional cold plate approach. The breadth of the freezing curve extends over a range of 10 °C from approximately –35 to –25 °C, as shown in . This is typical for 0.1 or 1.0 µL droplets placed on a wide variety of substrates (Polen et al. Citation2018). The smallest droplets of 6 nL in the microfluidic device displayed a much narrower freezing spectrum with greater than 85% of the droplets freezing tightly between −33 and −35 °C. As expected from classical nucleation theory, the median freezing temperature of the droplets is lower for smaller droplet volumes. We calculated the theoretical frozen fraction curves for our 6 nL, 14 nL, and 0.1 µL droplets using the homogeneous freezing parameterization derived by Koop and Murray (Citation2016). The measured median freezing temperature for the 6 nL droplets is approximately −33.7 ± 0.4 °C, which approaches the theoretical T50 of approximately −34.5 °C (Koop and Murray Citation2016). We refrain from calling our purified water spectrum “homogeneous” since this term should be applied only for very pure water droplets with no substrate or other interferences. As we recently documented in Polen et al. (Citation2018), this is very hard or impossible to achieve in droplet freezing methods when purified water is used. However, our microfluidic approach does bring us close to the homogeneous freezing temperature limit.
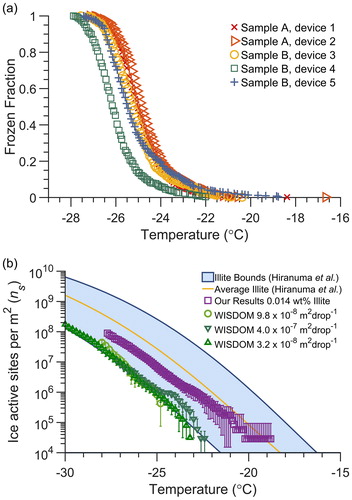
Figure 5. (a) Frozen fraction spectra of droplets produced from a 0.014 wt% illite NX mineral particle suspension for five separate trials in static microfluidic droplet arrays (513, 518, 516, 456, and 508 droplets, respectively) produced from two separate illite stock suspensions. (b) Ice nucleation active site density (ns) spectrum of illite NX normalized by total particle surface area contained in the droplets, determined from freezing assays using 6 nL droplets in the microfluidic device (open squares). The error bars are the standard deviation from the average of the five different arrays shown in (a). The average ns spectrum (yellow line) and observed bounds (blue shading) reported by Hiranuma et al. (Citation2015), and for comparison the data from the WISDOM microfluidic technique provided by Reicher et al. (Citation2018) are shown in green.
Even though the same water source was used in both the droplet-on-substrate and the microfluidic approaches, there is a large difference in the observed median freezing temperatures and the widths of the droplet freezing spectra for these two methods. There are at least two possible reasons for this difference. We recently reported an extensive series of droplet freezing experiments using filtered water on different substrates, and from different sources of water (Polen et al. Citation2018). We concluded that early freezing above the homogeneous freezing temperature is caused by unconstrained water contaminants that act as INPs, and by droplet interactions with any solid substrate surfaces that they are in contact with, which can cause heterogeneous ice nucleation. The droplets in the microfluidic device are not in contact with any rigid surface and are only interacting with the oil–water interface, whereas in the droplet-on-substrate technique the droplets are in direct contact with the hydrophobic silanized glass coverslip. As the droplets are surrounded by a thin layer of oil in the microfluidic device, inhibiting contact with the PDMS surface, the anomalously early freezing observed is likely not caused by the PDMS surfaces. In our initial studies reported by Polen et al. (Citation2018) we observed that 0.1 µL droplets on a PDMS surface had a median freezing temperature of −27.5 °C. Ice nucleation induced by the droplet pinning to the PDMS surface is not likely an issue since a much smaller fraction of droplets than the 10% of the 6 nL droplets are observed to freeze early. Additionally, in Polen et al. (Citation2018), when the droplets are normalized by their volumes the microfluidic device shows a small overlap in the apparent INP concentration with the 0.1 µL droplets. This would imply the early freezing in the 6 nL droplets is due to shared impurities (e.g., oil and/or water contaminates) instead of PDMS surface interactions.
The second possibility for why the microfluidic technique has a lower freezing temperature is related to the much smaller droplet volume compared to the conventional approach. As the droplet volume decreases, the probability that an individual droplet contains a rare contaminant INP also decreases (Polen et al. Citation2018; Vali Citation1971). The early freezing of the first 10% of droplets in the 6 nL microfluidic device, at temperatures warmer than −33 °C, may be the result of unknown trace contaminant INPs in the water that induce heterogeneous freezing. The slightly higher median freezing temperature and wider temperature range of −33.3 ± 0.85 °C observed for the 14 nL versus 6 nL droplets can also be explained by water impurities where the concentration of particles per droplet likely scales with the droplet volume. Combined, these two effects can also explain the very different widths of the freezing spectra. The droplet-on-substrate approach can cause each individual droplet to experience different local interactions with the underlying solid substrate. The trace particle contaminants may also be non-homogenously distributed throughout the droplet array, causing a large disparity in the presence and ice-activity of contaminant INPs present in each droplet. The much smaller volume and lack of substrate interactions for the microfluidic droplets would produce a more consistent environment for each droplet, resulting in the much tighter freezing spectrum that is observed.
The microfluidic device yields a significantly lower background freezing temperature spectrum. The T50 of −33.7 ± 0.4 °C for the 6 nL droplets in the microfluidic device is 5 °C colder than that of the 0.1 µL droplets in the conventional droplet-on-substrate assay (−28.7 ± 0.5 °C), and the spectral temperature range is much narrower. The background freezing temperature spectrum of any droplet freezing technique limits the temperature range over which reliable measurements of immersion freezing can be made. Most conventional droplet freezing methods are limited to median freezing temperatures well above −30 °C, due to interference from the background freezing of water droplets (Polen et al. Citation2018). The lower background freezing temperature is an important advantage of our microfluidic approach, enabling the study of important types of INPs that are expected to have lower critical immersion freezing temperatures between –25 and −35 °C.
Heterogeneous freezing of mineral dust particles
To evaluate the accuracy of the 6 nL microfluidic device in measuring the freezing spectrum of particles over a moderately warm temperature range of −18 to −28 °C, we froze a suspension of 0.014 wt% illite NX (a clay mineral particle sample) and compared the result to values reported by Hiranuma et al. (Citation2015) obtained from 17 different droplet immersion freezing methods analyzing the same illite sample. Overall, the microfluidic approach retrieves repeatable freezing spectra with little variance between runs (, five separate microfluidic trials with 457 to 519 droplets each). In addition, the freezing spectrum is within the bounds of the freezing spectra previously reported by Hiranuma et al. (Citation2015) (. The lower bound of the range previously reported is set by measurements using different particle concentrations in the WISDOM microfluidic device that generates 40 and 100 µm droplets. The ns spectrum obtained from the microfluidic approach is also similar to that obtained using our conventional droplet-on-substrate cold plate system (Beydoun, Polen, and Sullivan Citation2016, Citation2017), which also compared well with the aggregate results of Hiranuma et al. (Citation2015).
Snomax bacterial particles
To evaluate the performance of the static microfluidic droplet array in a warmer supercooled temperature range > −10 °C we froze suspensions of Snomax, a commercially available freeze-dried bacteria with very high ice activity. Snomax is produced from Pseudomonas syringae bacteria that have naturally evolved potent ice-nucleating proteins that can induce freezing as warm as −2 °C. Up to three different types of ice-nucleating protein aggregates have been identified. Type I, Type II, and Type III aggregates induce freezing roughly between −2 to −4 °C, −5 to −6 °C, and below −7 °C, respectively (Polen, Lawlis, and Sullivan Citation2016; Wex et al. Citation2015; Turner, Arellano, and Kozloff Citation1990). The influence of the Type I, Type II, and Type III ice nucleants can be observed in the droplet freezing temperature spectra (), and the nm spectra obtained from 6 nL microfluidic droplets (. The observed spectrum expressed in terms of ice active site density normalized by particle mass (nm) agrees with the upper portion of the temperature range previously reported by Wex et al. (Citation2015) using several different droplet freezing methods. The rise between −4 and −7 °C corresponds to the Type I/II aggregates, and the rise between −7 and −12 °C to the Type III aggregates. As the particle concentration is diluted the observed freezing temperature shifts to lower temperature due to the reduced probability of a droplet to contain the rarer, larger, and thus more ice-active Type I protein aggregates (Beydoun, Polen, and Sullivan Citation2017). Note that the ice nucleation activity of the strongest Type I ice nucleants in Snomax are unstable and we have found them to degrade over time (Polen, Lawlis, and Sullivan Citation2016). This may explain why the Snomax-containing droplets shown here initiated freezing at both a slightly warmer temperature than that reported by Wex et al. (Citation2015), and warmer than the suspensions in the droplet-on-substrate technique that we reported in Polen, Lawlis, and Sullivan (Citation2016), and the microfluidic-produced droplets reported by Tarn et al. (Citation2018). Inconsistencies have also been previously identified in the nm spectra observed as particle concentration is varied, even though nm is normalized by total particle mass to account for changes in total particle mass per droplet (Beydoun, Polen, and Sullivan Citation2016). Small changes in nm with concentration can be seen in , though the magnitude of these changes is suppressed by the logarithmic y-axis, and is largely within the measurement uncertainty of typical droplet freezing methods. This is interpreted further in the SI.
Figure 6. (a) Frozen fraction temperature spectra from singular droplet arrays containing varying quantities of Snomax bacterial particles. Orange and red symbols represent suspensions of Snomax in filtered water. Green symbols represent a highly dilute suspension of Snomax, and the filtered water background spectrum is in blue. (b) Ice nucleation active site density () of Snomax bacterial particles normalized by particle mass concentration in the droplets, obtained from 6 nL droplets in the static microfluidic droplet array. The data from the microfluidic device are shown with square symbols for three different wt% of Snomax and are overlaid with results previously reported by Wex et al. (Citation2015) for Snomax using several different immersion freezing methods. For comparison, results previously reported by Polen, Lawlis, and Sullivan (Citation2016) using our conventional cold plate for a similar total particle mass per droplet are plotted with cross symbols (+), and results from microfluidic-produced droplets reported by Tarn et al. (Citation2018) were plotted as purple asterisk (*). (c) The frozen fraction curves for Snomax and the 6 nL filtered water background were converted to the differential nucleus concentration (k(T)) spectrum, using EquationEquation (4)
(4)
(4) and ΔT = 0.5 °C.
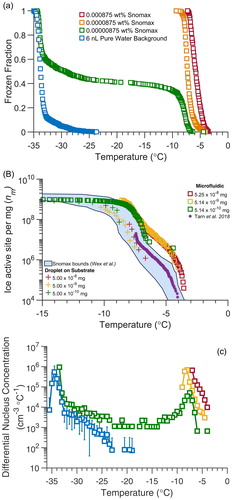
The large uniform droplet arrays produced by the new microfluidic technique allow us to utilize the differential nucleus concentration spectrum (k(T)), from Vali (Citation1971, Citation2019). The differential nucleus concentration compares the slopes of the frozen fraction plots and enables us to quantitatively separate the contribution of background freezing from the ice nucleants present in the most dilute Snomax array. k(T) is a differential ice nucleus concentration that describes the INP concentration in that temperature interval, as opposed to the commonly used K(T) cumulative INP concentration spectrum that was also originally developed by Vali and is typically converted to ns or to nm (e.g., ; Vali Citation1971, Citation2019). This k(T) analysis is more useful when using large uniform-sized droplet number arrays with low background freezing (T50 < –30 °C), such as now provided by microfluidic approaches but not previously available using conventional techniques. As such k(T) has not seen much application since it was introduced in 1971, until it was recently applied by Vali to an initial dataset obtained using this microfluidic device (Vali Citation2019). All three of the Snomax freezing spectra at different concentrations demonstrate ice activity between −4 and −9 °C, while the spectrum for the lowest concentration of Snomax also contains a much broader spectrum extending to −34 °C. The overlap in the filtered water and Snomax differential nucleus concentration spectra for temperatures colder than −28 °C supports the hypothesis that the lowest concentration of Snomax contained two different populations of droplets. The population that contained Snomax ice nucleants froze between −2 and −12 °C, while the other population did not contain any bacterial ice nucleants and froze at temperatures similar to our filtered water droplets.
Mixtures of Snomax bacterial and illite mineral particles
To explore the ability of the microfluidic approach to distinguish between different types of ice nucleants based on their differing immersion freezing temperatures, we performed experiments using droplets containing mixtures of Snomax bacterial and illite NX mineral particles. The mass per droplet for illite NX and Snomax are similar to those used in our prior work by Beydoun, Polen, and Sullivan (Citation2017). For the present work we utilized two different weight percentages of illite NX: 1.66 wt% to match the mass per droplet in Beydoun et al. and ∼0.015 wt% similar to the illite concentrations we previously used in our droplet-on-substrate approach (Beydoun, Polen, and Sullivan Citation2016). The higher weight percentage of illite matching that of Beydoun, Polen, and Sullivan (Citation2017) made our droplets visually opaque and indifferentiable when in a liquid and frozen state and is presented in Figure S3 in the SI. The more atmospherically relevant concentration of 0.015 wt% is shown in . The microfluidic approach resulted in higher resolution spectra for the mixed illite NX and Snomax droplets than our conventional CMU-CS microliter droplet-on-substrate technique obtains. The higher spectral resolution is due to the much larger number of droplets created in the microfluidic device (≈550 6 nL droplets) compared with the 50–100 0.1 µL droplets in the droplet-on-substrate method.
Figure 7. Frozen fraction temperature spectra from singular droplet arrays for 6 nL microfluidic droplets containing different concentrations of Snomax bacterial particles and illite NX mineral particles. Orange and red symbols represent suspensions of Snomax also shown in . Blue and purple symbols represent a mixture of illite NX combined with dilute suspensions of Snomax. Green symbols represent a highly dilute suspension of Snomax in filtered water also shown in . Red (×) symbols represent a single illite NX run extracted from . Orange shading represents the freezing temperature regime of Snomax ice nucleants, blue the regime of illite NX, and green the regime where background freezing of filtered water is prominent for 6 nL microfluidic droplets.
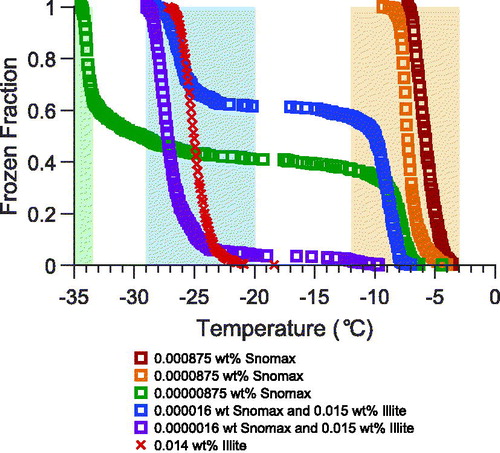
For the droplets containing illite NX, we can confidently assume that each droplet contains an INP from illite NX when compared to the data shown in . However, the illite NX containing spectra in demonstrate that the droplets containing Snomax still dominate the freezing behavior, as droplets began freezing at temperatures warmer than −13 °C. The portion of droplets that froze between −21 and −29 °C correspond to the critical freezing temperature of illite NX particles, as seen in . The microfluidic approach can also clearly differentiate the Snomax and illite NX freezing behavior from the background freezing signal that manifests below −33 °C. Compared with prior measurements of droplets containing particle mixtures, the microfluidic approach produces a larger quantity of data, using smaller droplet sizes closer to that of realistic cloud droplets, and with a lower background freezing temperature spectrum.
Biomass-burning aerosol
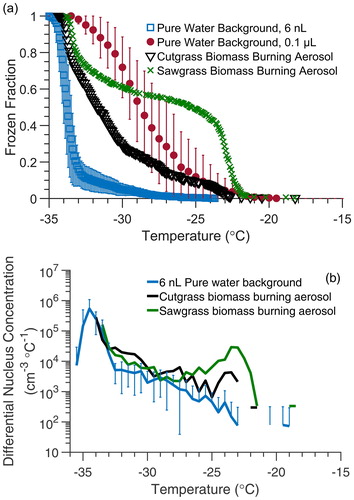
The low background freezing temperature also enables the study of weak INPs that initiate freezing near the homogeneous freezing temperature range of about –35 °C. For example, some types of biomass-burning aerosol (BBA) have been found to contain INPs that are generally weak ice nucleants and induce immersion freezing below −20 °C (Levin et al. Citation2016; Hiranuma et al. Citation2015; McCluskey et al. Citation2014; Prenni et al. Citation2012; Petters et al. Citation2009). This makes their immersion freezing properties difficult to measure using conventional droplet-on-substrate cold plate methods due to interference from background freezing. As shown in , the BBA-containing droplets freeze below −20 °C. The BBA freezing behavior would have been lost within the background signal of the conventional droplet-on-substrate technique that also begins near −20 °C (Polen et al. Citation2018). To further compare against our filtered water control we converted the frozen fractions to the differential nucleus concentration (k(T)) spectrum using EquationEquation (4)(4)
(4) (Vali Citation1971, Citation2019). Over most of the spectral temperature range where freezing is observed, –25 °C < T < –21 °C, the BBA is almost an order of magnitude higher in k(T) compared to the filtered water control, and further demonstrates the potential for BBA to be a source of weak atmospheric INPs. The k(T) analysis shows that background freezing becomes an important interference for T < –30 °C. This can also be observed in the droplet freezing temperature spectra () where the slopes of the filtered water control and BBA-containing droplets become similar for T < –30 °C. The examination of the immersion freezing of BBA demonstrates another advantage of the microfluidic approach as a potential INP measurement system through its ability to measure the immersion freezing behavior of weaker ice nucleants, using smaller INP and particle concentrations and higher droplet statistics, and reduced background freezing interference.
Figure 8. (a) Droplet freezing temperature spectra from a static microfluidic droplet array using 6 nL droplets containing sawgrass BBA (green crosses), cutgrass BBA (black triangles), and 6 nL filtered water droplets (blue squares). The background water freezing spectrum for 0.1 µL droplets in the conventional droplet-on-substrate method are shown for comparison (red circles). Error bars are the standard deviation obtained from three trials produced from the same suspension. (b) The frozen fraction spectra for the 6 nL filtered water control and fresh BBA converted to the k(T) spectrum using EquationEquation (4)(4)
(4) and ΔT = 0.5 °C.
Repeatability of droplet freezing spectra obtained
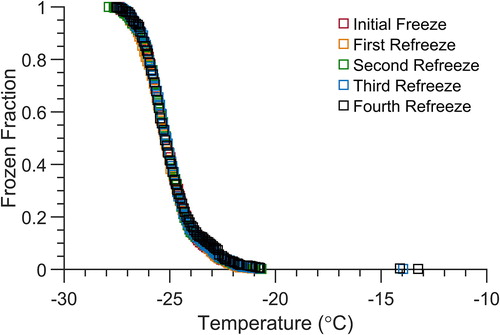
Performing droplet refreeze experiments provides important information regarding the repeatability of ice nucleation induced by the same INPs in a droplet, and the rigidity of the ice active surface sites. Refreeze experiments can also help to distinguish between deterministic and stochastic contributions to heterogeneous ice nucleation (Peckhaus et al. Citation2016; Vali Citation2014; Wright and Petters Citation2013). We performed droplet refreeze experiments using 6 nL droplets containing 0.01 wt% illite NX to assess the capabilities of the microfluidic approach for refreeze experiments. The same droplets experienced a normal cooling cycle down to −40 °C, and the device was then warmed to 10 °C after all droplets had frozen, and the normal freezing cycle was then repeated. The spectra shown in represent five successive droplet refreeze experiments and are essentially indistinguishable from one another, indicating that no changes occurred in the ice nucleation properties of the droplets and the particles contained within them during the successive freeze-thaw-freeze cycles. This result further indicates that there are minimal interactions of the aqueous droplets with PDMS due to the oil layer, and that there is excellent reproducibility of the droplet freezing temperature spectra we obtain using the microfluidic device. If the droplet was interacting or pinning to the PDMS surface this substrate interaction would likely shift the observed freezing temperature to a few degrees warmer (Polen et al. Citation2018). We would expect the frozen fraction curve to broaden and skew to warmer temperatures than are seen in the highly reproducible refreeze experiments shown in . Microfluidic approaches that use surfactant to separate droplets immersed in a continuous oil phase typically cannot be used to perform refreeze experiments, as the first cooling cycle appears to alter the fluid and interfacial properties of the surfactant-doped oil phase such that the aqueous droplets that are in contact with one another coalesce when thawed (Tarn et al. Citation2018). In both our technique and other isolated ice nucleation techniques our droplets are not in contact with another surface or droplet (Nandy and Dutcher Citation2018; Reicher, Segev, and Rudich Citation2018; Weng, Swei, and Toner Citation2018). This allows for repeated refreeze experiments without worrying about droplet–droplet interactions.
Figure 9. Droplet freezing temperature spectra for arrays of 6 nL microfluidic droplets containing 0.01 wt% illite NX mineral particles for five consecutive freeze-thaw-freeze cycles.
Conclusions
A “store and create” microfluidic droplet generation technique was applied for the first time to the analysis of homogeneous freezing of water droplets, and immersion freezing of droplets containing ice nucleating particles. The low background freezing temperature obtained for filtered water droplets, and the excellent agreement with literature immersion freezing spectra for Snomax bacterial and illite mineral particles indicate that this approach can reliably measure the concentration and freezing properties of INPs over almost the entire immersion freezing temperature regime, from 0 to –33 °C, with high accuracy and precision. This enables the detection and analysis of important but low ice-activity INPs such as from biomass burning. The microfluidic freezing technique is capable of bridging the immersion freezing temperature measurement gap between online single particle (e.g., continuous flow diffusion chambers) and conventional droplet-on-substrate techniques that are routinely used to evaluate instrument performance and measurement reliability. The high-resolution droplet population freezing data generated has enabled the full application of the differential ice nucleation analysis to quantitatively determine the contribution of different types of ice nucleants versus background interference in a mixed particle sample for the first time since this analysis was first introduced by Vali in 1971. The device achieves several important criteria of high-quality droplet freezing assays: large numbers of uniformly sized droplets, low background freezing from the substrate or water used, highly reproducible freezing spectra, droplet refreeze capabilities, realistic cooling rates, and nanoliter droplet volumes approaching those of atmospheric cloud droplets. This is achieved using a small, simple to fabricate and operate microfluidic device that can readily be used to analyze any suspended particle sample of choice, requiring just a few mL of sample. Subsequent droplet or particles-in-droplet physicochemical analysis is facilitated by the nondestructive storing nature of the device. If desired, faster cooling rates could be achieved using this technique, however, a more powerful and expensive temperature controller would likely be needed. This approach can be easily applied to the analysis of essentially any type of aerosol particle sample collected from laboratory or field experiments.
Conflicts of interest
The authors declare no conflicts of interest for this work.
Supplemental Material
Download PDF (406.4 KB)Acknowledgments
Gourav Shet provided the design and schematic of the “store and create” microfluidic device. Lydia Jahl and Leif Jahn assisted in the collection of the biomass-burning aerosol filter samples. We would like to thank Naruki Hiranuma at AIDA for providing the Illite NX mineral sample as part of the INUIT project. We thank Greg Askins and Bert Wyatt of the Savannah Coastal Refuges Complex for collecting the biomass fuel samples.
Additional information
Funding
Related Research Data
References
- Ahern, A. T., L. Goldberger, L. Jahl, J. Thornton, and R. C. Sullivan. 2018. Production of N2O5 and ClNO2 through nocturnal processing of biomass-burning aerosol. Environ. Sci. Technol. 52(2):550–559. doi:10.1021/acs.est.7b04386.
- Anna, S. L., N. Bontoux, and H. A. Stone. 2003. Formation of dispersions using “flow focusing” in microchannels. Appl. Phys. Lett. 82(3):364. doi:10.1063/1.1537519.
- Beydoun, H., M. Polen, and R. C. Sullivan. 2017. A new multicomponent heterogeneous ice nucleation model and its application to Snomax bacterial particles and a Snomax–illite mineral particle mixture. Atmos. Chem. Phys. 17(22):13545–13557. doi:10.5194/acp-17-13545-2017.
- Beydoun, H., M. Polen, and R. C. Sullivan. 2016. Effect of particle surface area on ice active site densities retrieved from droplet freezing spectra. Atmos. Chem. Phys. 16(20):13359–13378. doi:10.5194/acp-16-13359-2016.
- Bhattacharya, S., A. Datta, J. M. Berg, and S. Gangopadhyay. 2005. Studies on surface wettability of poly(dimethyl) siloxane (PDMS) and glass under oxygen-plasma treatment and correlation with bond strength. J. Microelectromech. Syst. 14(3):590–597. doi:10.1109/JMEMS.2005.844746.
- Bigg, E. K. 1953. The supercooling of water. Proc. Phys. Soc. Sect. B 66(8):688–694. doi:10.1088/0370-1301/66/8/309.
- Bithi, S. S., and S. A. Vanapalli. 2010. Behavior of a train of droplets in a fluidic network with hydrodynamic traps. Biomicrofluidics 4(4):044110. doi:10.1063/1.3523053.
- Bleier, B. J., S. L. Anna, and L. M. Walker. 2018. Microfluidic droplet-based tool to determine phase behavior of a fluid system with high composition resolution. J. Phys. Chem. B 122(14):4067–4076. doi:10.1021/acs.jpcb.8b01013.
- Boukellal, H., Š. Selimović, Y. Jia, G. Cristobal, and S. Fraden. 2009. Simple, robust storage of drops and fluids in a microfluidic device. Lab Chip 9(2):331–338. doi:10.1039/B808579J.
- Bretherton, F. P. 1961. The motion of long bubbles in tubes. J. Fluid Mech. 10(02):166. doi:10.1017/S0022112061000160.
- Budke, C., and T. Koop. 2015. BINARY: An optical freezing array for assessing temperature and time dependence of heterogeneous ice nucleation. Atmos. Meas. Tech. 8(2):689–703. doi:10.5194/amt-8-689-2015.
- Cziczo, D. J., L. Ladino, Y. Boose, Z. A. Kanji, P. Kupiszewski, S. Lance, S. Mertes, and H. Wex. 2017. Measurements of ice nucleating particles and ice residuals. Meteorol. Monogr. 58:8.1–8.13. doi:10.1175/AMSMONOGRAPHS-D-16-0008.1.
- DeMott, P. J., O. Möhler, O. Stetzer, G. Vali, Z. Levin, M. D. Petters, M. Murakami, T. Leisner, U. Bundke, H. Klein, et al. 2011. Resurgence in ice nuclei measurement research. Bull. Amer. Meteor. Soc. 92(12):1623–1635. doi:10.1175/2011BAMS3119.1.
- DeMott, P. J., A. J. Prenni, G. R. McMeeking, R. C. Sullivan, M. D. Petters, Y. Tobo, M. Niemand, O. Möhler, J. R. Snider, Z. Wang, and S. M. Kreidenweis. 2015. Integrating laboratory and field data to quantify the immersion freezing ice nucleation activity of mineral dust particles. Atmos. Chem. Phys. 15(1):393–409. doi:10.5194/acp-15-393-2015.
- Duffy, D. C., J. C. McDonald, O. J. A. Schueller, and G. M. Whitesides. 1998. Rapid prototyping of microfluidic systems in poly(dimethylsiloxane). Anal. Chem. 70(23):4974–4984. doi:10.1021/ac980656z.
- Edd, J. F., K. J. Humphry, D. Irimia, D. A. Weitz, and M. Toner. 2009. Nucleation and solidification in static arrays of monodisperse drops. Lab Chip 9(13):1859. doi:10.1039/b821785h.
- Hader, J. D., T. P. Wright, and M. D. Petters. 2014. Contribution of pollen to atmospheric ice nuclei concentrations. Atmos. Chem. Phys. 14(11):5433–5449. doi:10.5194/acp-14-5433-2014.
- Harris, C. L., M. Toner, A. Hubel, E. G. Cravalho, M. L. Yarmush, and R. G. Tompkins. 1991. Cryopreservation of isolated hepatocytes: Intracellular ice formation under various chemical and physical conditions. Cryobiology 28(5):436–444. doi:10.1016/0011-2240(91)90052-P.
- Hiranuma, N., S. Augustin-Bauditz, H. Bingemer, C. Budke, J. Curtius, A. Danielczok, K. Diehl, K. Dreischmeier, M. Ebert, F. Frank, et al. 2015. A comprehensive laboratory study on the immersion freezing behavior of illite NX particles: A comparison of 17 ice nucleation measurement techniques. Atmos. Chem. Phys. 15(5):2489–2518. doi:10.5194/acp-15-2489-2015.
- Hoose, C., and O. Möhler. 2012. Heterogeneous ice nucleation on atmospheric aerosols: a review of results from laboratory experiments. Atmos. Chem. Phys. 12(20):9817–9854. doi:10.5194/acp-12-9817-2012.
- Koop, T., B. Luo, A. Tsias, and T. Peter. 2000. Water activity as the determinant for homogeneous ice nucleation in aqueous solutions. Nature 406(6796):611–614. doi:10.1038/35020537.
- Koop, T., and B. J. Murray. 2016. A physically constrained classical description of the homogeneous nucleation of ice in water. J. Chem. Phys. 145(21):211915. doi:10.1063/1.4962355.
- Levin, E. J. T., G. R. McMeeking, P. J. DeMott, C. S. McCluskey, C. M. Carrico, S. Nakao, T. Jayarathne, E. A. Stone, C. E. Stockwell, R. J. Yokelson, and S. M. Kreidenweis. 2016. Ice-nucleating particle emissions from biomass combustion and the potential importance of soot aerosol. J. Geophys. Res. Atmos. 121(10):5888–5903. doi:10.1002/2016JD024879.
- Li, J., and T. C. Lee. 1998. Bacterial extracellular ice nucleator effects on freezing of foods. J. Food Sci. 63(3):375–381. doi:10.1111/j.1365-2621.1998.tb15746.x.
- Mason, R. H., C. Chou, C. S. McCluskey, E. J. T. Levin, C. L. Schiller, T. C. J. Hill, J. A. Huffman, P. J. DeMott, and A. K. Bertram. 2015. The micro-orifice uniform deposit impactor–droplet freezing technique (MOUDI-DFT) for measuring concentrations of ice nucleating particles as a function of size: Improvements and initial validation. Atmos. Meas. Tech. 8(6):2449–2462. doi:10.5194/amt-8-2449-2015.
- McCluskey, C. S., P. J. DeMott, A. J. Prenni, E. J. T. Levin, G. R. McMeeking, A. P. Sullivan, T. C. J. Hill, S. Nakao, C. M. Carrico, and S. M. Kreidenweis. 2014. Characteristics of atmospheric ice nucleating particles associated with biomass burning in the US: Prescribed burns and wildfires. J. Geophys. Res. Atmos. 119(17):10458–10470. doi:10.1002/2014JD021980.
- Metcalf, A. R., S. Narayan, and C. S. Dutcher. 2018. A review of microfluidic concepts and applications for atmospheric aerosol science. Aerosol Sci. Technol. 52(3):310–329.
- Morris, G. J., and E. Acton. 2013. Controlled ice nucleation in cryopreservation – A review. Cryobiology 66(2):85–92. doi:10.1016/j.cryobiol.2012.11.007.
- Moyle, T. M., L. M. Walker, and S. L. Anna. 2012. Predicting conditions for microscale surfactant mediated tipstreaming. Phys. Fluids 24(8):082110. doi:10.1063/1.4746253.
- Mülmenstädt, J., O. Sourdeval, J. Delanoë, and J. Quaas. 2015. Frequency of occurrence of rain from liquid-, mixed-, and ice-phase clouds derived from A-Train satellite retrievals. Geophys. Res. Lett. 42(15):6502–6509. doi:10.1002/2015GL064604.
- Murray, B. J., D. O'Sullivan, J. D. Atkinson, and M. E. Webb. 2012. Ice nucleation by particles immersed in supercooled cloud droplets. Chem. Soc. Rev. 41(19):6519. doi:10.1039/c2cs35200a.
- Myhre, G., D. Shindell, F.-M. Bréon, W. Collins, J. Fuglestvedt, J. Huang, D. Koch, J.-F. Lamarque, D. Lee, B. Mendoza, et al. 2013. Anthropogenic and natural radiative forcing. In Climate change 2013: The physical science basis. Contribution of working group I to the fifth assessment report of the intergovernmental panel on climate change, ed. T. F. Stocker, D. Qin, G.-K. Plattner, M. Tignor, S. K. Allen, J. Boschung, A. Nauels, Y. Xia, V. Bex and P. M. Midgley, 659–740. Cambridge: Cambridge University Press. doi:10.1017/CBO9781107415324.018.
- Nandy, L., and C. S. Dutcher. 2018. Phase behavior of ammonium sulfate with organic acid solutions in aqueous aerosol mimics using microfluidic traps. J. Phys. Chem. B 122(13):3480–3490. doi:10.1021/acs.jpcb.7b10655.
- Nandy, L., S. Liu, C. Gunsbury, X. Wang, M. A. Pendergraft, K. A. Prather, and C. S. Dutcher. 2019. Multistep phase transitions in sea surface microlayer droplets and aerosol mimics using microfluidic wells. ACS Earth Sp. Chem. 3(7):1260–1267. doi:10.1021/acsearthspacechem.9b00121.
- Nelson, C. 2016. Probing the phase behavior of complex fluids using microliter droplet reactors. Pittsburgh, PA: Carnegie Mellon University.
- Niemand, M., O. Möhler, B. Vogel, H. Vogel, C. Hoose, P. Connolly, H. Klein, H. Bingemer, P. DeMott, J. Skrotzki, and T. Leisner. 2012. A particle-surface-area-based parameterization of immersion freezing on desert dust particles. J. Atmos. Sci. 69(10):3077–3092. doi:10.1175/JAS-D-11-0249.1.
- Peckhaus, A., A. Kiselev, T. Hiron, M. Ebert, and T. Leisner. 2016. A comparative study of K-rich and Na/Ca-rich feldspar ice-nucleating particles in a nanoliter droplet freezing assay. Atmos. Chem. Phys. 16(18):11477–11496. doi:10.5194/acp-16-11477-2016.
- Petters, M. D., M. T. Parsons, A. J. Prenni, P. J. DeMott, S. M. Kreidenweis, C. M. Carrico, A. P. Sullivan, G. R. McMeeking, E. Levin, C. E. Wold, J. L. Collett, and H. Moosmüller. 2009. Ice nuclei emissions from biomass burning. J. Geophys. Res. 114(D7):D07209. doi:10.1029/2008JD011532.
- Polen, M., T. Brubaker, J. Somers, and R. C. Sullivan. 2018. Cleaning up our water: reducing interferences from nonhomogeneous freezing of “pure” water in droplet freezing assays of ice-nucleating particles. Atmos. Meas. Tech. 11(9):5315–5334. doi:10.5194/amt-11-5315-2018.
- Polen, M., E. Lawlis, and R. C. Sullivan. 2016. The unstable ice nucleation properties of Snomax® bacterial particles. J. Geophys. Res. Atmos. 121(19):11666–11678. doi:10.1002/2016JD025251.
- Prenni, A. J., P. J. DeMott, A. P. Sullivan, R. C. Sullivan, S. M. Kreidenweis, and D. C. Rogers. 2012. Biomass burning as a potential source for atmospheric ice nuclei: Western wildfires and prescribed burns. Geophys. Res. Lett. 39(11):1–5. doi:10.1029/2012GL051915.
- Reicher, N., L. Segev, and Y. Rudich. 2018. The WeIzmann supercooled droplets observation on a microarray (WISDOM) and application for ambient dust. Atmos. Meas. Tech. 11(1):233–248. doi:10.5194/amt-11-233-2018.
- Riechers, B., F. Wittbracht, A. Hütten, and T. Koop. 2013. The homogeneous ice nucleation rate of water droplets produced in a microfluidic device and the role of temperature uncertainty. Phys. Chem. Chem. Phys. 15(16):5873–5887. doi:10.1039/c3cp42437e.
- Rogers, D. C., P. J. DeMott, S. M. Kreidenweis, and Y. Chen. 2001. A continuous-flow diffusion chamber for airborne measurements of ice nuclei. J. Atmos. Oceanic Technol. 18(5):725–741. doi:10.1175/1520-0426(2001)018<0725:ACFDCF>2.0.CO;2.
- Rosenfeld, D., U. Lohmann, G. B. Raga, C. D. O’Dowd, M. Kulmala, S. Fuzzi, A. Reissell, and M. O. Andreae. 2008. Flood or drought: How do aerosols affect precipitation? Science 321(5894):1309–1313. doi:10.1126/science.1160606.
- Schmitz, C. H. J., A. C. Rowat, S. Köster, and D. A. Weitz. 2009. Dropspots: A picoliter array in a microfluidic device. Lab Chip 9(1):44–49. doi:10.1039/B809670H.
- Schnell, R. C., and G. Vali. 1976. Biogenic ice nuclei: Part I. Terrestrial and marine sources. J. Atmos. Sci. 33(8):1554–1564. doi:10.1175/1520-0469(1976)033<1554:BINPIT>2.0.CO;2.
- Sgro, A. E., P. B. Allen, and D. T. Chiu. 2007. Thermoelectric manipulation of aqueous droplets in microfluidic devices. Anal. Chem. 79(13):4845–4851. doi:10.1021/ac062458a.
- Sgro, A. E., and D. T. Chiu. 2010. Droplet freezing, docking, and the exchange of immiscible phase and surfactant around frozen droplets. Lab Chip 10(14):1873. doi:10.1039/c001108h.
- Stan, C. A., G. F. Schneider, S. S. Shevkoplyas, M. Hashimoto, M. Ibanescu, B. J. Wiley, and G. M. Whitesides. 2009. A microfluidic apparatus for the study of ice nucleation in supercooled water drops. Lab Chip 9(16):2293. doi:10.1039/b906198c.
- Stetzer, O., B. Baschek, F. Lüönd, and U. Lohmann. 2008. The Zurich ice nucleation chamber (ZINC)-a new instrument to investigate atmospheric ice formation. Aerosol Sci. Technol. 42(1):64–74. doi:10.1080/02786820701787944.
- Tarn, M. D., S. N. F. Sikora, G. C. E. Porter, D. O’Sullivan, M. Adams, T. F. Whale, A. D. Harrison, J. Vergara-Temprado, T. W. Wilson, J.-U. Shim, and B. J. Murray. 2018. The study of atmospheric ice-nucleating particles via microfluidically generated droplets. Microfluid. Nanofluidics 22(5):52.
- Tobo, Y. 2016. An improved approach for measuring immersion freezing in large droplets over a wide temperature range. Sci. Rep. 6(1):32930.
- Tong, H.-J., B. Ouyang, N. Nikolovski, D. M. Lienhard, F. D. Pope, and M. Kalberer. 2015. A new electrodynamic balance (EDB) design for low-temperature studies: Application to immersion freezing of pollen extract bioaerosols. Atmos. Meas. Tech. 8(3):1183–1195. doi:10.5194/amt-8-1183-2015.
- Trad, F. S., M. Toner, and J. D. Biggers. 1999. Effects of cryoprotectants and ice-seeding temperature on intracellular freezing and survival of human oocytes. Hum. Reprod. 14(6):1569–1577. doi:10.1093/humrep/14.6.1569.
- Turner, M. A., F. Arellano, and L. M. Kozloff. 1990. Three separate classes of bacterial ice nucleation structures. J. Bacteriol. 172(5):2521–2526. doi:10.1128/jb.172.5.2521-2526.1990.
- Vali, G. 1971. Quantitative evaluation of experimental results and the heterogeneous freezing nucleation of supercooled liquids. J. Atmos. Sci. 28(3):402–409. doi:10.1175/1520-0469(1971)028<0402:QEOERA>2.0.CO;2.
- Vali, G. 1996. Ice nucleation—A review. In Nucleation and atmospheric aerosols 1996, ed. M. Kulmala and P. Wagner, 271–279. Helsinki: Pergamon Press.
- Vali, G. 2014. Interpretation of freezing nucleation experiments: Singular and stochastic; sites and surfaces. Atmos. Chem. Phys. 14(11):5271–5294. doi:10.5194/acp-14-5271-2014.
- Vali, G. 2018. Interactive comment on “Cleaning up our water: reducing interferences from non-homogeneous freezing of ‘pure’ water in droplet freezing assays of ice nucleating particles” by Michael Polen. Atmos. Meas. Tech. Discuss. doi:10.5194/amt-2018-134-SC1.
- Vali, G. 2019. Revisiting the differential freezing nucleus spectra derived from drop-freezing experiments: methods of calculation, applications, and confidence limits. Atmos. Meas. Tech. 12(2):1219–1231. doi:10.5194/amt-12-1219-2019.
- Vali, G., P. J. DeMott, O. Möhler, and T. F. Whale. 2015. Technical note: A proposal for ice nucleation terminology. Atmos. Chem. Phys. 15(18):10263–10270. doi:10.5194/acp-15-10263-2015.
- Vuong, S. M. 2014. A microfluidic platform for the control and analysis of phase transitions in concentrating droplets. Pittsburgh, PA: Carnegie Mellon University.
- Vuong, S. M., and S. L. Anna. 2012. Tuning bubbly structures in microchannels. Biomicrofluidics 6(2):022004–2200418. doi:10.1063/1.3693605.
- Weng, L., A. Swei, and M. Toner. 2018. Role of synthetic antifreeze agents in catalyzing ice nucleation. Cryobiology 84:91–94. doi:10.1016/j.cryobiol.2018.08.010.
- Weng, L., S. N. Tessier, K. Smith, J. F. Edd, S. L. Stott, and M. Toner. 2016. Bacterial ice nucleation in monodisperse D2O and H2O-in-Oil emulsions. Langmuir 32(36):9229–9236. doi:10.1021/acs.langmuir.6b02212.
- Wex, H., S. Augustin-Bauditz, Y. Boose, C. Budke, J. Curtius, K. Diehl, A. Dreyer, F. Frank, S. Hartmann, N. Hiranuma, et al. 2015. Intercomparing different devices for the investigation of ice nucleating particles using snomax® as test substance. Atmos. Chem. Phys. 15(3):1463–1485. doi:10.5194/acp-15-1463-2015.
- Whale, T. F., B. J. Murray, D. O’Sullivan, T. W. Wilson, N. S. Umo, K. J. Baustian, J. D. Atkinson, D. A. Workneh, and G. J. Morris. 2015. A technique for quantifying heterogeneous ice nucleation in microlitre supercooled water droplets. Atmos. Meas. Tech. 8(6):2437–2447. doi:10.5194/amt-8-2437-2015.
- Whitesides, G. M., and A. D. Stroock. 2001. Flexible methods for microfluidics. Phys. Today 54(6):42–48. doi:10.1063/1.1387591.
- Wright, T. P., and M. D. Petters. 2013. The role of time in heterogeneous freezing nucleation. J. Geophys. Res. Atmos. 118(9):3731–3743. doi:10.1002/jgrd.50365.