
 ?Mathematical formulae have been encoded as MathML and are displayed in this HTML version using MathJax in order to improve their display. Uncheck the box to turn MathJax off. This feature requires Javascript. Click on a formula to zoom.
Abstract
The size distribution and effective density of ambient particles were measured with and without using Catalytic Stripper (CS) at Riverside, CA in September 2015 and June 2016 to calculate time-dependent human respiratory system deposited particulate matter (hereafter referred to as PMRS) mass using composition dependent growth factors along with the lung deposition fraction reported by ICRP (1994). The particle active surface area, black carbon (BC) mass, particle number (PN), solid particle number (SPN), and suspended PM mass (from particle size distributions and effective densities) were also obtained to investigate correlations with PMRS. Non-refractory organic and inorganic mass measured by an aerosol mass spectrometer (mAMS) provided additional information in relation to PMRS vs. chemical nature of particles.
Ambient particle size distributions showed strong diurnal variations during the sampling period. While the respiratory system deposited PM mass fraction (0.32–0.36) did not vary much with time, the PMRS followed the trend of suspended PM mass in the ambient air. The PMRS for the alveolar region was the highest (0.3–1.0 μg/m3), followed by that for nasal region (0.16–0.83 μg/m3), and that for tracheobronchial region (0.05–0.27 μg/m3). They all peaked during noon to 6 PM and reached the lowest value near midnight.
Suspended PM mass in the ambient air correlated best with PMRS, followed by mAMS measured organics, active surface area, and BC mass. It is also found that particle hygroscopicity did not significantly affect correlations between metrics and PMRS. Considering the accessibility and cost of these measurements, we propose particle active surface area and BC mass to be considered when evaluating/monitoring the adverse health effects caused by PM.
Copyright © 2019 American Association for Aerosol Research
EDITOR:
1. Introduction
Particulate mass is the metric used to regulate PM (Particulate Matter) concentrations for both ambient air quality standards and source emissions standards (US EPA Citation2004). There is an ample number of health effect studies and data built around this metric for several decades (Dockery et al. Citation1993). These studies are the scientific basis for regulations to mitigate the adverse health effects by lowering particle mass concentrations. Numerous studies have shown reduction of PM mass, such as PM2.5, reduces adverse human health effects (Brook et al. Citation2010; Clancy et al. Citation2002; Delfino, Sioutas, and Malik Citation2005; Pope et al. Citation2004; Schwartz, Dockery, and Neas Citation1996). These studies enabled enforcement of low PM mass emitting technologies in sources, such as low PM mass emitting vehicles, benefiting society with improved air quality.
Mass metric has served very well to improve public health by cleaning air up to the current level during the past decades. Significant health benefits have been achieved by lowering ambient PM mass concentrations. Majority of the US cities are attaining National Ambient Air Quality Standards (NAAQS) for PM2.5 while there are some areas such as central California and Los Angeles (LA) basin that have remained as non-attainment areas for a long time. Benefits on human health due to the reduction of ambient PM2.5 mass is known to have non-linear relationships (For example see of Apte et al. (Citation2015)). Underlying physics, chemistry, biology, and toxicity may have contributed to this non-linearity. There are conflicting evidences regarding further increasing health benefits with more stringent NAAQS. Laden et al. (Citation2006) extended the mortality analysis of the Harvard Six Cities adult cohort study, following them up for 8 years in a period of reduced air pollution concentrations, and reported that total, cardiovascular, and lung cancer mortality were each positively associated with ambient PM2.5 concentrations. They also reported reduced PM2.5 concentrations were associated with reduced mortality risk. Di et al. (Citation2017a, Citation2017b) analyzed the entire Medicare population from 2000 to 2012 residing in 39,182 zip codes and reported there is a risk of mortality by exposure to PM2.5 and ozone, even at levels below current national air quality standards. On the other hand, Enstrom (Citation2017) re-analyzed 1982 American Cancer Society Cancer Prevention Study (CPS II) cohort data and reported no significant relationship between PM2.5 and total mortality in the CPS II cohort when the best available PM2.5 data were used. Young, Smith, and Lopiano (Citation2017) analyzed air quality and acute deaths in California from 2000 to 2012, and found little evidence for association between air quality and acute deaths.
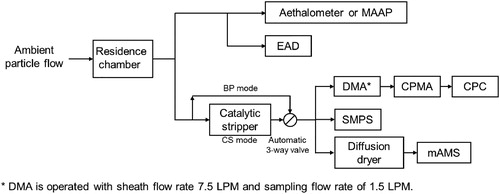
Figure 1. Schematic diagram of the experimental setup for ambient particle size distribution and effective density measurement.
A specific question, of both legislative and research interest, is to examine appropriateness of PM metrics in light of improved measurement capabilities of particle properties. Particle number, solid particle number, black carbon concentration, particle active surface area and suspended particle mass are examples of metrics of consideration for this study. The current study responds to one of the grand challenges summarized by Sorensen et al. (Citation2019) They recommended multidimensional approach beyond typically measured PM2.5 and PM10 to further elucidate the relationship between ambient particle properties and adverse health effect.
Particle number is not an ideal metric since there has been evidence of negative correlation between PM2.5 mass and particle number concentrations during nucleation events while the correlation is positive in the absence of nucleation (Baldauf et al. Citation2016; Stanier, Khlystov, and Pandis Citation2004). On the other hand, solid particle number (SPN) can potentially be a better metric, considering soot is a carrier for toxic compounds and SPN should have relatively good positive correlations with PM2.5. Toxic compounds, such as polycyclic aromatic hydrocarbons (PAHs) are adsorbed on the surface of solid particles and carried into the human respiratory system. Soot aggregates from combustion, as the most abundant solid particle type in urban environments, act as a carrier of carcinogenic compounds. A solid particle number concentration limit of 6 × 10¹¹ particles/km has been included in Euro 5/6 standards for light-duty diesel vehicles (UNECE Citation2008). The Euro 6 standard for heavy-duty diesel vehicles includes a solid particle number concentration limit as well, with the proposed limits of 8 × 10¹¹ particles/kWh for stationary cycles and 6 × 10¹¹ particles/kWh for transient cycles (Johnson Citation2010). While the current regulatory solid particle measurement system for vehicle exhaust is a sophisticated system (Giechaskiel et al. Citation2008) composed of a heated and cooled dilutor, an evaporation tube, and a condensational particle counter (CPC), a simpler system can be designed for the measurement of ambient air. In the current study, we used integrated particle concentrations using a catalytic stripper-SMPS system. A simpler system such as a catalytic stripper-CPC system can measure solid particle number of ambient air for routine monitoring in the future study.
Previous studies suggested surface area concentrations in various environments may be suitable to present negative human health effects of aerosol exposure. Toxicological studies have found that ultrafine particles may have an increased toxicity compared to larger particles with the same composition and mass (Johnston et al. Citation2000; Karlsson et al. Citation2009) due to higher specific surface area.
Many previous studies were based on BET surface area (Brunauer, Emmett, and Teller Citation1938) which requires relatively large sample amount and post-collection analysis. BET surface area is not a convenient metric for routine monitoring. Geometric surface area (GSA) refers to the external surface area of particles, but does not include internal pore areas like BET. Lall and Friedlander (Citation2006) and Lall et al. (Citation2006) developed a theory to calculate geometric surface area of chain aggregates. Cao et al. (Citation2017) also reported some success measuring GSA for spherical and aggregate particles. Both studies have limitations as they need to know types of particles before the measurement to determine GSA. Particle active surface area defines the exterior envelop surface area that is responsible for mass transfer of diffusing species. It can be measured using an aerosol diffusion charger and can be a promising and feasible metric for routine monitoring. Moshammer and Neuberger (Citation2003) reported correlations of the measured active surface area for particle sizes ranging from 10 nm to 1 µm with lung function and pulmonary symptoms of school children in Austria. Moshammer, Neuberger, and Nebot (Citation2004) also reported active surface area as a good indicator for ETS (environmental tobacco smoke) exposure. They found a good correlation between active surface area and nicotine concentrations in the ambient air.
Black Carbon (BC) mass also has a potential to be a good indicator of the aerosols’ adverse health effects. Epidemiological studies have provided evidence for the positive association of human health effects with exposure to BC. Delfino et al. (Citation2010) found BC mass has a positive association with blood pressure but it has a weaker correlation than with aerosol organic carbon mass. Mordukhovich et al. (Citation2009) observed positive associations between blood pressure and BC, but not with PM2.5. Janssen et al. (Citation2011) performed a systematic review and meta-analysis of health effects of BC compared with PM mass based on data from time-series studies. They concluded that mass increase of BC led to higher mortality and more frequent hospital admissions compared to PM2.5 or PM10 mass. Toxicological studies suggest that BC may operate as a ubiquitous carrier of a wide variety of chemicals of varying toxicity to the human body (WHO Citation2012). BC is a dominant component in traffic-related particles. There are a few studies suggesting a potential of BC as a proxy to estimate health effects from the exposure to traffic related pollutants (Janssen et al. Citation2011; Schaap and van der Gon Citation2007).
Lung-deposited particle mass is of researchers’ interest. To estimate the respiratory system deposited mass (PMRS), which includes lung-deposited particle mass, aerosol size-resolved density profiles are needed. There are a few studies which applied size-resolved particle effective density to estimate the lung-deposited particle mass of ambient PM. Rissler et al. (Citation2012) and Wierzbicka et al. (Citation2014) applied differential mobility analyzer (DMA)-aerosol particle mass analyzer (APM) technique to measure size dependent density of diesel exhaust particles and used the density profile with particle size distributions to estimate the respiratory system deposited particulate mass (PMRS).
PM deposition in the human respiratory tract is an important link between exposure to ambient particulates and observed health effects. There are limited studies reporting lung-deposited PM mass of ambient particulate (Löndahl et al. Citation2009) and diesel exhaust (Rissler et al. Citation2012; Wierzbicka et al. Citation2014). Löndahl et al. (Citation2006) developed a flow-through system, which was applied to human subjects, to measure the lung-deposition fraction as a function of particle size by comparing particle size distributions during inhalation and exhalation. With this technique, Löndahl et al. (Citation2007) reported that there is almost no dependence of the deposition fraction by gender and exercise level; however, higher deposition was measured for male subjects and during exercise due to increased ventilation rate. They also reported the deposition fraction of hygroscopic ultrafine particles could be estimated by calculating their equilibrium size at 99.5% relative humidity (RH), i.e., the RH in the alveolar region (Anselm et al. Citation1990). Additionally, Löndahl et al. (Citation2008) investigated aerosol deposition fraction and growth factor using hygroscopic particles from biomass combustion using their flow-through system. They reported deposition fraction is affected by particle hygroscopicity and hygroscopic ultrafine particles obtain deposition probabilities close to the minimum due to hygroscopic growth. In a follow up study, Löndahl et al. (Citation2009) investigated deposition fraction of curbside ambient particles to understand deposition fraction of traffic related particles. They found that deposition fraction of particles from curbside was much higher than those from biomass combustion because of the lower fraction of hygroscopic particles and higher number of ultrafine particles. While Löndahl and his colleagues research provides critical information regarding deposition fraction and growth factor, involvement of human subjects prevents application of this method for routine monitoring.
Our study aims to: 1) determine respiratory system deposited PM mass (PMRS) using particle size distributions determined by a scanning mobility particle sizer (SMPS), particle effective density determined by DMA-CPMA method, and lung deposition fraction curves in an SOA- (secondary organic aerosol) rich area, Riverside, CA. 2) compare correlations between the PMRS and ambient aerosol monitoring metrics, such as BC, SPN, suspended PM mass and active surface area to determine metrics that correlate best with PMRS. We acknowledge reactivity (and toxicity) of particles vary widely and PMRS by itself may not be sufficient to explain all of the adverse aerosol health effects. Also, it should be noted that we are not suggesting a PM metric itself will solely be predictive for a toxic response in the human respiratory system as much of the effects will be related to the interaction of particles with macrophages and epithelial cells. Despite this, physical metrics provide a common denominator for potential toxicity measurements and ambient monitoring. Results of this study will inform policy-makers about importance of different metrics that could be considered for developing future regulations.
2. Experimental
The measurements were conducted at the second floor of the Geology building at the University of California, Riverside (33.974762, –117.326313), 0.55 km away from the nearest highway (State Route 60) and 3.6 km away from highway 91. The measurements were conducted continuously during two periods: 09/16/2015–09/23/2015 and 06/06/2016–06/15/2016.
The experimental setup is shown in . Ambient particles were sampled through a residence chamber with residence time of 4.4 min to provide a pseudo-steady state condition for each measurement. All the instruments were placed indoors at a constant temperature of 25 °C.
An aethalometer (Magee Scientific model AE33) measured the BC mass concentration in September 2015 campaign, and MAAP (Thermo Scientific model 5012) measured the BC in June 2016 campaign. An Electrical Aerosol Detector (EAD TSI model 3070 A) measured active aerosol surface area based on diffusion charging. Unipolar ions carried by a particle-free flow are mixed with the aerosol sample flow in a counter-flow chamber for diffusion charging. A lab-made Catalytic Stripper (CS; Abdul-Khalek and Kittelson Citation1995; Stenitzer Citation2003) operating at 300 ˚C was used to remove semivolatile components of ambient aerosols. The wall loss in the CS mode was corrected by an experimentally-determined, size-dependent penetration efficiency curve. A three-way solenoid valve (ASCO Valve, Inc) was programed to switch the flow passage between ambient (BP mode as the sample flow bypasses CS) and the CS (CS mode as the flow goes through the CS) every 10 min. A DMA-centrifugal particle mass analyzer (CPMA)-CPC (DMA model 3081, TSI, Inc.; CPMA, Cambustion, Limited; CPC model 3022, TSI, Inc.) system was placed downstream of the solenoid valve to measure particle effective density, once every 10 min. Monodisperse aerosol in electrical mobility was selected by the DMA and fed into the CPMA-CPC system. The CPMA-CPC system determined mass of aerosol at a given mobility diameter, allowing calculation of particle effective density as a function of mobility diameter. Four mobility diameters (dm= 50, 70, 101, 152 nm) covering the range where the alveolar and tracheobronchial deposited mass fraction is relatively high (Oberdörster, Oberdörster, and Oberdörster Citation2005) were selected. Detailed description of the density measurement setup of this study was reported in a previous manuscript (Lin et al. Citation2018). A Scanning Mobility Particle Sizer (SMPS) consisting of a Differential Mobility Analyzer (TSI model 3081) and Condensation Particle Counter (CPC TSI model 3022) was used to measure particle size distributions (PSDs) in the range of 10–346 nm, which covers most of the size range, important to the lung deposition by diffusion and interception but not necessarily by inertial impaction.
A compact time-of-flight aerosol mass spectrometer (mini-AMS or mAMS) measured non-refractory dry aerosol composition in June 2016 campaign. Composition-dependent collection efficiency correction was applied to the bulk mAMS concentrations (Middlebrook et al. Citation2012).
3. Results and discussions
3.1. Particle size spectra with and without using CS
Temperature and RH in show strong diurnal trends from 6/6 to 6/10 and 6/12 to 6/13. On the other hand, much weaker diurnal temperature and RH trends were observed on 6/11. Westerly wind was dominant with the average wind speed of 4 m/s during the period as shown in . show particle spectra for BP mode and CS mode. Note that wall loss in the CS was corrected for CS mode particle spectra using experimentally determined penetration curve for the CS. Maximum particle concentrations were observed during 6–7 PM as temperature-driven mixing (or dilution) rapidly slows down. shows PN for CS and BP modes. Strong diurnal trends were observed except on 6/11. CS mode particle concentration was the lowest (∼4000 particles/cm3) at 6–7 AM and the highest (∼15,000 particles/cm3) at 6–7 PM. The BP mode particle concentration was the highest (∼30,000 particles/cm3) at ∼7 PM. shows that particle mode diameter increased from ∼20 nm at ∼9 AM to ∼90 nm at ∼12 PM, and decreased from noon to night time to 10–30 nm. Given that the majority of the aerosol mass in Riverside is secondary in nature, we speculate this size change from morning to noon represents growth of particles due to condensation of organic and inorganic vapors as the urban plume is transported from western part of the LA Basin to Riverside. Time dependent and size independent BP mode particle effective density, shown in , was obtained by averaging the nearest size-dependent particle effective density at each time. We published in depth analysis of the effective density analysis separately in our previous work (Lin et al. Citation2018). We found the CS mode particle effective density is clearly size-dependent and can be characterized by mass-mobility exponent. We also found BP mode effective density has a slight size-dependency, but the variance was within the measurement uncertainty. As such, we decided to determine size-independent (or size-averaged) particle effective density at each time to calculate suspended PM mass for the BP mode, MBP. Size-independent BP mode particle effective density showed strong diurnal trend from 6/6 to 6/10 while the diurnal trend got weaker from 6/12 to 6/13.
Figure 2. (a) Temperature and humidity trend, (b) wind speed and direction, (c) BP mode particle size spectra, (d) CS mode particle size spectra, (e) particle number concentration, and (f) BP mode particle effective density variation during June 2016 measurement period, (g) temperature and humidity trend, (h) wind speed and direction, (i) BP mode particle size spectra, (j) CS mode particle size spectra, (k) particle number concentration, and (l) BP mode particle effective density variation during September 2015 measurement period.
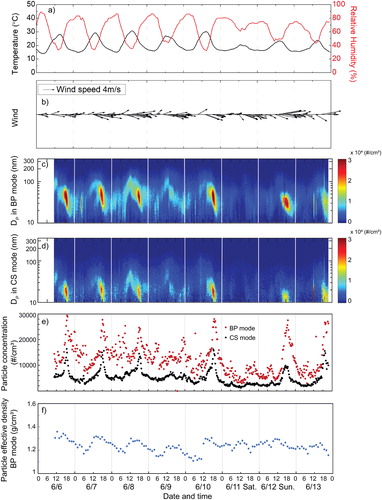

Temperature and RH in show strong diurnal trends from 9/17 to 9/21. On the other hand, slightly weaker diurnal temperature and RH trends were observed on 9/16 and 9/22. Westerly wind was dominant from 9/17 to 9/19 with the average wind speed of 3.2 m/s during the period as shown in . show particle spectra for BP mode and CS mode. Particle size distributions showed broader atmospheric accumulation mode particles compared to those in the June measurement period (. The time for maximum particle concentrations varied daily during September measurement period as shown in . Time-dependent and size-independent BP mode particle effective densities are shown in .
Particle mass concentration of the BP mode, MBP (μg/m3) was calculated by the following equation:(1)
(1)
where the is the average effective density of the BP mode over the four measured particle sizes (50 nm, 70 nm, 100 nm, 150 nm) that was used to cover the size range of 10–350 nm, di is the particle diameter of the size bin from the particle size distributions, and
is the number concentration of the size bin.
Nonvolatile (or CS mode) particle mass concentration was calculated by the following equation:(2)
(2)
where is particle effective density of the CS mode at the ith size bin. Particle effective density profile was obtained at each time by fitting the particle effective density measured at each selected size in the nearest time steps to mass fractal dimension equation:
(3)
(3)
Effective density at the ith size bin is obtained using the constant (C) and mass-mobility exponent (Dm) determined at each time step. As the largest selected mobility diameter was 150 nm, effective density for sizes larger than 150 nm was obtained by extrapolating the mass-mobility relationship (McMurry et al. Citation2002; Park et al. Citation2003).
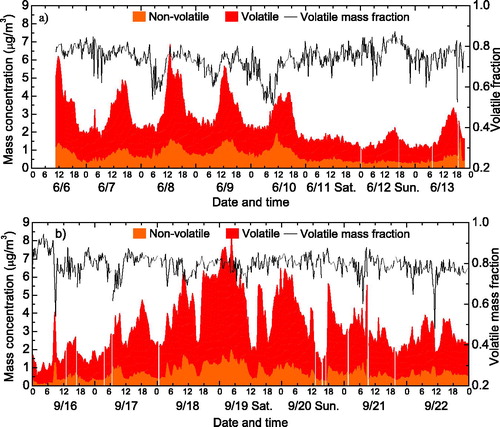
Both volatile aerosol (obtained by subtracting CS mode from BP mode) and nonvolatile ambient aerosol mass showed diurnal trends (). Nonvolatile ambient particle mass on 6/11 and 6/12 were much lower compared to the other dates in . Likewise, volatile PM mass showed reduced concentrations. We speculate this reduction in particle mass was due to changes in meteorological conditions (such as relatively high late-afternoon temperatures on 6/11 and 6/12 suppressing boundary layer height reduction in the late afternoon, leading to less reduction in vertical mixing [or dilution]), and not due to changes in traffic pattern during the weekend. Previous studies (e.g., Bahreini et al. Citation2012) have shown that mass concentration of secondary organic aerosols, the major component of submicron aerosol mass, in the Los Angeles Basin is unchanged on weekends relative to weekdays despite a significant reduction in diesel traffic emissions during the weekends. confirms that meteorological condition dictates both nonvolatile and volatile PM mass at the measurement location. The volatile mass fraction of ambient aerosol ranged from 0.51 to 0.87 (0.48 to 0.94) with the average of 0.74 (0.79) and standard deviation of 0.06 (0.05) during June period (September period).
Figure 3. Time series of volatile and nonvolatile suspended particle mass concentrations in (a) June 2016, (b) September 2015 measurement period.
The effective densities published at Lin et al. (Citation2018) have uncertainty of 9.4%. Wiedensohler et al. (Citation2012) reported SMPS sizing is as accurate as the uncertainties of calibration PSL which was about 2.5%. Based on authors’ experience the largest error is derived from the uncertainty of the sheath flow of the SMPS system. Our sheath flow calibration results were within 1% of the setpoints and so we assume the sizing uncertainty of 1%. Wiedensohler et al. (Citation2012) reported number concentrations measured by SMPS has 10% uncertainty. When these uncertainties are taken into account, the uncertainty in MBP and MCS is estimated to be ∼22.4%.
3.2. Calculation of the deposited PM mass to three different areas in the human respiratory system
The area plot in shows temporal trends of deposited particle mass in different sections of the human respiratory system. The deposited mass concentration of the BP mode, MBP,deposit (μg/m3) was calculated by the following equation:(4)
(4)
Figure 4. Time course of PM mass deposited at different regions of the human respiratory system during (a) June 2016 and (b) September 2015 measurement periods.
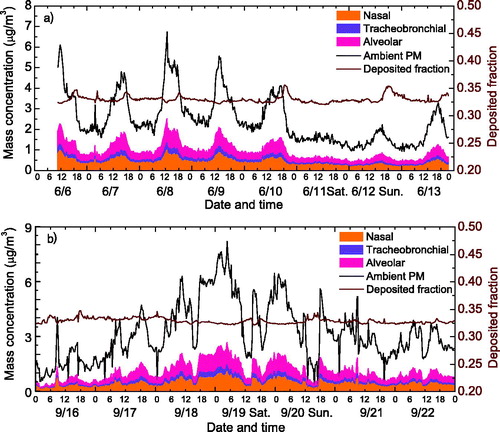
where the is the average effective density of the BP mode over the four measured particle sizes (50 nm, 70 nm, 100 nm, 150 nm) that was used to cover the size range of 10–350 nm, di is the particle diameter of the size bin from the particle size distribution,
is the number concentration of the size bin, and
is the deposition fraction from ICRP (1994). MBP,deposit is also noted as PMRS in the manuscript.
Nasal and alveolar regions showed 2.85 and 3.15 times higher deposited PM mass, respectively, compared to tracheobronchial regions over the size range of 10–350 nm. More specifically, the deposited mass to alveolar region is the highest among the three regions in the respiratory system, with deposited mass ranging from 0.3 to 1.0 μg/m3 for the conditions encountered during these measurement periods. The deposited mass to nasal area was the second highest, ranging from 0.16 to 0.83 μg/m3. The deposited mass to tracheobronchial region is the lowest (0.05–0.27 μg/m3). The deposited PM mass in the human respiratory system followed the diurnal trend of suspended PM mass, MBP. The deposited PM mass in all three regions in the respiratory system consistently peaked at noon ∼6 PM and showed the lowest value near midnight. The deposited PM mass fraction (compared to MBP), ranged from 0.32 to 0.36, and it did not vary much with time.
3.3. Respiratory deposited PM mass vs PM metric
Our goal is to find a physical metric, e.g., solid particle number, BC mass, or suspended PM mass, which has the best correlation with the respiratory system deposited PM mass (PMRS). show the scatterplot matrix between deposited mass in the human respirarotory system and aerosol properties in June 2016 and September 2015 campaigns, respectively. We included mAMS-measured organic aerosol (OA) for comparison although mAMS monitoring is costly and not practical for routine monitoring.
Figure 5. Scatterplot matrix between deposited mass in the human respirarotory system and aerosol metrics for ambient air monitoring in (a) June 2016 and (b) September 2015 campaign.
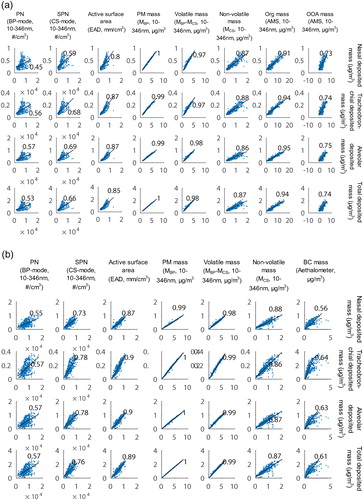
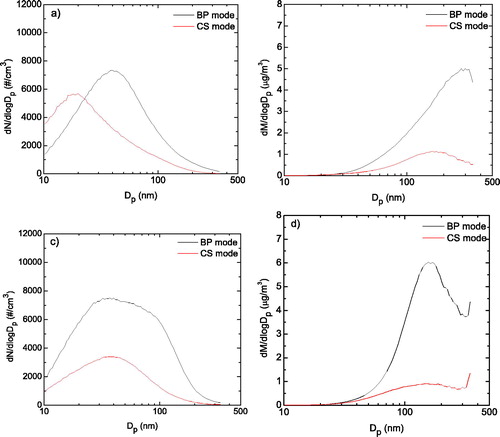
MBP showed the highest correlation coefficients of nearly 1 with the respiratory system deposited PM masses during both June and September periods in . We attribute this to the characteristics of particle size distributions at the background location. shows period-averaged particle number and mass size distributions. While number concentration peaks are below 100 nm where the lung deposition fraction is the highest, mass concentration peaks are at 168 nm for CS mode and 242 nm for BP mode. We may find larger contribution of ultrafine particles at locations where primary emissions are important, such as near-road locations. In that case, MBP may have a lower correlation coefficient with the respiratory system deposited PM mass.
Figure 6. (a) Average number and (b) mass particle size distribution for June 2016 data; (c) average number and (d) mass particle size distribution for September 2015 data. Size independent and time-varying particle effective density were used for mass calculation of the BP mode. Size-dependent and time-varying particle effective density were used for mass calculation of CS mode.
Because of MAAP malfunctioning during the June period, we used the aethalometer data from the September measurement period to investigate the correlations between BC and PMRS. shows BC measured by Aethalometer has moderate correlation, with correlation coefficient R2 ranging from 0.56 to 0.63, with PMRS.
summarizes correlations between PMRS and PM metrics shown in . Among the metrics of our interest, the MBP showed the best correlation with PMRS (R2 = 0.99–1), followed by OA (R2 = 0.91–0.95), active surface area (R2 = 0.80–0.90), oxygenated OA (OOA, R2 = 0.73–0.75), SPN (CS-mode) (R2 = 0.59–0.78), BC mass (R2 = 0.56–0.63), and PN (BP-mode) (R2 = 0.45–0.57). Correlations were similar for deposition in different sections of the respiratory system. As discussed earlier, MBP and mAMS are not ideal methods for a routine monitoring practice. However, active surface area measurements based on a diffusion charging instrument (i.e., EAD) are relatively inexpensive and easy to maintain and deploy. BC and SPN (CS-mode) reported intermediate correlations in this study. We expect BC to have a higher correlation with PMRS in locations where primary emissions are more prevalent. Future health effect studies should consider including these two promising metrics (active surface area and BC) and compare effectiveness of these metrics with the current PM mass metrics determined by FEM (Federal Equivalent Method) and FRM (Federal Reference Method).
Table 1. Correlations (R2) between deposited PM mass in the human respiratory system and PM metrics for ambient air monitoring.
3.4 Effect of hygroscopic growth
The relative humidity (RH) in the lungs has been estimated to be 99.5% (Anselm et al. Citation1990). Particles can grow to larger sizes at this RH depending on their hygroscopicity. Hämeri et al. (Citation2000) reported a growth factor (GF) of 1.72 for 50 nm ammonium sulfate assuming RHdry = 40% and RHwet = 90%. Hu et al. (Citation2011) reported GF of ∼1.36–1.68 for 50–150 nm ammonium nitrate for RH increasing from 40% to 86%. Hu et al. (Citation2011) reviewed hygroscopicity of urban ambient particles and found ambient particles exhibited growth distributions with at least one hygroscopic mode with GF = 1.15–1.68 besides the hydrophobic mode. Aerosol composition measurements previously reported in Lin et al. (Citation2018) indicated that aerosols in the size range of 10–346 nm were dominated by OA (42.6%) and BC (39.7%, assuming all the measured bulk BC was in this size range), with a minor contribution from ammonium sulfate (13.2%) and ammonium nitrate (4.5%). Size dependent GF can be calculated if mixing state and chemical composition are known. Lin et al. (Citation2018) reported that the ambient aerosol at Riverside during June, 2015 was internally mixed. Using the size-dependent chemical composition as measured by the mAMS and the total BC mass concentration by the MAAP, the volume-weighted overall GF was calculated following the Zdanovskii–Stokes–Robinson (ZSR) mixing rule (Stokes and Robinson Citation1966) shown as EquationEquation (5)(5)
(5) . In the absence of size-resolved BC concentration measurements, we assumed that BC was uniformly distributed in the size range of dm = 50–152 nm (Lin et al. Citation2018). Additionally, GF of the non-refractory inorganic components was assumed to be 2.4 in the size range of interest (Wex et al. Citation2005). Since the GF of organics aerosol (OA) and BC are not well known at high RH, upper (1.7 and 1.5, respectively) and lower (1.15 and 1.05, respectively) estimates of GF were used to obtain a range of the possible overall GF values (Li et al. Citation2018; Yeung et al. Citation2014). With these assumptions, four sets of time-resolved, size-dependent particle GFs were determined (high GF_BC + high GF_OA, high GF_BC + low GF_OA, low GF_BC + high GF_OA, low GF_BC + low GF_OA) using EquationEquation (5)
(5)
(5) :
(5)
(5) where ε is the volume fraction of each component in a specific size bin, calculated using the mass concentrations of the species in each bin and assuming densities of 1.75 g/cm3, 1.25 g/cm3, and 1.8 g/cm3 for inorganics, OA, and BC, respectively (Lin et al. Citation2018). Next, four sets of time-resolved, total deposited particle mass (M(t), µg/m3) was determined by EquationEquation (6)
(6)
(6) :
(6)
(6)
where the i refers to the 8 size bins covering the mobility diameter between 10 and 346 nm, t refers to the time steps between June 6th and13th, 2015, refers to the time-resolved number size distribution,
refers to the number-based respiratory deposition fraction of each size bin considering size growth,
is the geometric mean diameter of each size bins.
The correlations between these four deposited particle mass datasets and various metrics were determined. Interestingly there was no significant difference in correlations with the metrics—therefore figure or data are not shown—when hygroscopic growth was considered. That is because contribution of the ultrafine particles to the total deposited PM mass was not significant enough in this environment. This may change in different measurement locations where primary emissions dominate particle size distributions. The current analysis assumed PM toxicity is related to the mass of deposited PM. If PM toxicity is based on other metrics such as respiratory deposited particle surface area or number, the correlations may change quite differently.
4. Conclusion
We measured ambient particle size distribution, effective density, BC, surface area, and volatile fraction in September 2015 and June 2016 at Riverside, CA and investigated the correlation between these particle metrics and the respiratory system deposited PM mass.
Ambient particle size distributions showed strong diurnal variations during the sampling period. Particle mode diameter was the lowest (10–30 nm) at nighttime and highest (∼90 nm) at noon. Particle concentrations were the highest at ∼7 PM (∼30,000 particles/cm3 for BP mode and ∼15,000 particles/cm3 for CS mode), and the lowest (∼4000 particles/cm3) at 6–7 AM for CS mode.
While the deposited PM mass fraction (0.32–0.36) didn’t vary much with time of the day or during the sampling periods, PM mass deposited in the human respiratory system followed the trends of the suspended PM mass in the ambient air. Deposited PM mass for the alveolar region was the highest (0.3–1.0 μg/m3), followed by that for the nasal region (0.16–0.83 μg/m3), and that for tracheobronchial region (0.05–0.27 μg/m3). All respiratory system deposited PM masses peaked at noon-6 PM and reached the lowest value near midnight.
Ambient suspended PM mass correlated best with respiratory system deposited PM mass, followed by OA, active surface area, and BC mass. Particle hygroscopicity did not affect correlations between metrics and respiratory system deposited PM mass under the environment where the current study was conducted. Considering accessibility and cost of these measurements, we propose that active surface area and BC mass measurements be considered when evaluating/monitoring the health effects caused by air pollution.
Additional information
Funding
References
- Abdul-Khalek, I. S., and D. B. Kittelson. 1995. Real time measurement of volatile and solid exhaust particles using a catalytic stripper. SAE Technical Paper 950236. https://doi.org/10.4271/950236.
- Anselm, A., T. Heibel, J. Gebhart, and G. Ferron. 1990. “In vivo”-studies of growth factors of sodium chloride particles in the human respiratory tract. J. Aerosol Sci. 21:S427–S30. doi:10.1016/0021-8502(90)90272-Y.
- Apte, J. S., J. D. Marshall, A. J. Cohen, and M. Brauer. 2015. Addressing global mortality from ambient PM2.5. Environ. Sci. Technol. 49:8057–66. doi:10.1021/acs.est.5b01236.
- Bahreini, R., A. M. Middlebrook, J. A. de Gouw, C. Warneke, M. Trainer, C. A. Brock, H. Stark, S. S. Brown, W. P. Dube, J. B. Gilman, et al. 2012. Gasoline emissions dominate over diesel in formation of secondary organic aerosol mass. Geophys. Res. Lett. 39 (6):L06805. doi:10.1029/2011GL050718.
- Baldauf, R. W., R. B. Devlin, P. Gehr, R. Giannelli, B. Hassett-Sipple, H. Jung, G. Martini, J. McDonald, J. D. Sacks, and K. Walker. 2016. Ultrafine particle metrics and research considerations: review of the 2015 UFP workshop. Int. J. Environ. Res. Public Health 13 (11):1054. doi:10.3390/ijerph13111054.
- Brook, R. D., S. Rajagopalan, C. A. Pope, J. R. Brook, A. Bhatnagar, A. V. Diez-Roux, F. Holguin, Y. Hong, R. V. Luepker, and M. A. Mittleman. 2010. Particulate matter air pollution and cardiovascular disease: an update to the scientific statement from the American Heart Association. Circulation 121:2331–78. doi:10.1161/CIR.0b013e3181dbece1.
- Brunauer, S., P. H. Emmett, and E. Teller. 1938. Adsorption of gases in multimolecular layers. J. Am. Chem. Soc. 60 (2):309–19. doi:10.1021/ja01269a023.
- Cao, L. N., S.-C. Chen, H. Fissan, C. Asbach, and D. Y. Pui. 2017. Development of a geometric surface area monitor (GSAM) for aerosol nanoparticles. J. Aerosol Sci. 114:118–29. doi:10.1016/j.jaerosci.2017.09.013.
- Clancy, L., P. Goodman, H. Sinclair, and D. W. Dockery. 2002. Effect of air-pollution control on death rates in Dublin, Ireland: An intervention study. Lancet 360 (9341):1210–14. doi:10.1016/S0140-6736(02)11281-5.
- Delfino, R. J., C. Sioutas, and S. Malik. 2005. Potential role of ultrafine particles in associations between airborne particle mass and cardiovascular health. Environmental Health Perspectives 113 (8):934. doi:10.1289/ehp.7938.
- Delfino, R. J., T. Tjoa, D. L. Gillen, N. Staimer, A. Polidori, M. Arhami, L. Jamner, C. Sioutas, and J. Longhurst. 2010. Traffic-related air pollution and blood pressure in elderly subjects with coronary artery disease. Epidemiology 21: 396–404. doi:10.1097/EDE.0b013e3181d5e19b.
- Di, Q., L. Dai, Y. Wang, A. Zanobetti, C. Choirat, J. D. Schwartz, and F. Dominici. 2017a. Association of short-term exposure to air pollution with mortality in older adults. JAMA 318 (24):2446–56. doi:10.1001/jama.2017.17923.
- Di, Q., Y. Wang, A. Zanobetti, Y. Wang, P. Koutrakis, C. Choirat, F. Dominici, and J. D. Schwartz. 2017b. Air pollution and mortality in the medicare population. New Engl. J. Med. 376 (26):2513–22. doi:10.1056/NEJMoa1702747.
- Dockery, D. W., C. A. Pope, X. Xu, J. D. Spengler, J. H. Ware, M. E. Fay, B. G. Ferris, Jr., and F. E. Speizer. 1993. An association between air pollution and mortality in six US cities. New Engl. J. Med. 329 (24):1753–59. doi:10.1056/NEJM199312093292401.
- Enstrom, J. E. 2017. Fine particulate matter and total mortality in cancer prevention study cohort reanalysis. Dose-Response: An International Journal 15 (1):1–12. doi:10.1177/1559325817693345.
- Giechaskiel, B., P. Dilara, E. Sandbach, and J. Andersson. 2008. Particle measurement programme (PMP) light-duty inter-laboratory exercise: Comparison of different particle number measurement systems. Meas. Sci. Technol. 19 (9):095401. doi:10.1088/0957-0233/19/9/095401.
- Hämeri, K., M. Väkevä, H. C. Hansson, and A. Laaksonen. 2000. Hygroscopic growth of ultrafine ammonium sulphate aerosol measured using an ultrafine tandem differential mobility analyzer. J. Geophys. Res. Atmos. 105 (D17):22231–42. doi:10.1029/2000JD900220.
- Hu, D., J. Chen, X. Ye, L. Li, and X. Yang. 2011. Hygroscopicity and evaporation of ammonium chloride and ammonium nitrate: Relative humidity and size effects on the growth factor. Atmos. Environ. 45 (14):2349–55. doi:10.1016/j.atmosenv.2011.02.024.
- ICRP, ICoRP. 1994. Human respiratory model for radiological protection. Ann. ICRP 24:1–300.
- Janssen, N. A., G. Hoek, M. Simic-Lawson, P. Fischer, L. van Bree, H. ten Brink, M. Keuken, R. W. Atkinson, H. R. Anderson, B. Brunekreef, et al. 2011. Black carbon as an additional indicator of the adverse health effects of airborne particles compared with PM10 and PM2.5. Environ Health Perspect. 119 (12):1691–1699
- Johnson, T. V. 2010. Review of diesel emissions and control. SAE Int. J. Fuels Lubr. 3 (1):16–29. doi:10.4271/2010-01-0301.
- Johnston, C. J., J. N. Finkelstein, P. Mercer, N. Corson, R. Gelein, and G. Oberdörster. 2000. Pulmonary effects induced by ultrafine PTFE particles. Toxicol. Appl. Pharmacol. 168 (3):208–15. doi:10.1006/taap.2000.9037.
- Karlsson, H. L., J. Gustafsson, P. Cronholm, and L. Möller. 2009. Size-dependent toxicity of metal oxide particles—A comparison between nano- and micrometer size. Toxicol. Lett. 188 (2):112–18. doi:10.1016/j.toxlet.2009.03.014.
- Laden, F., J. Schwartz, F. E. Speizer, and D. W. Dockery. 2006. Reduction in fine particulate air pollution and mortality: Extended follow-up of the harvard six cities study. Am. J. Respir. Crit. Care Med. 173 (6):667–72. doi:10.1164/rccm.200503-443OC.
- Lall, A. A., and S. K. Friedlander. 2006. On-line measurement of ultrafine aggregate surface area and volume distributions by electrical mobility analysis: I. Theoretical analysis. J. Aerosol Sci. 37 (3):260–71. doi:10.1016/j.jaerosci.2005.05.021.
- Lall, A. A., M. Seipenbusch, W. Rong, and S. K. Friedlander. 2006. On-line measurement of ultrafine aggregate surface area and volume distributions by electrical mobility analysis: II. Comparison of measurements and theory. J. Aerosol Sci. 37 (3):272–82. doi:10.1016/j.jaerosci.2006.01.006.
- Li, K., X. Ye, H. Pang, X. Lu, H. Chen, X. Wang, X. Yang, J. Chen, and Y. Chen. 2018. Temporal variations in the hygroscopicity and mixing state of black carbon aerosols in a polluted megacity area. Atmos. Chem. Phys. 18 (20):15201–218. doi:10.5194/acp-18-15201-2018.
- Lin, Y., R. Bahreini, S. Zimmerman, E. A. Fofie, A. Asa-Awuku, K. Park, S.-B. Lee, G.-N. Bae, and H. S. Jung. 2018. Investigation of ambient aerosol effective density with and without using a catalytic stripper. Atmos. Environ. 187:84. doi:10.1016/j.atmosenv.2018.05.063.
- Löndahl, J., A. Massling, J. Pagels, E. Swietlicki, E. Vaclavik, and S. Loft. 2007. Size-resolved respiratory-tract deposition of fine and ultrafine hydrophobic and hygroscopic aerosol particles during rest and exercise. Inhal. Toxicol. 19 (2):109–16. doi:10.1080/08958370601051677.
- Löndahl, J., A. Massling, E. Swietlicki, E. V. BräUner, M. Ketzel, J. Pagels, and S. Loft. 2009. Experimentally determined human respiratory tract deposition of airborne particles at a busy street. Environ. Sci. Technol. 43:4659–64. doi:10.1021/es803029b.
- Löndahl, J., J. Pagels, C. Boman, E. Swietlicki, A. Massling, J. Rissler, A. Blomberg, M. Bohgard, and T. Sandström. 2008. Deposition of biomass combustion aerosol particles in the human respiratory tract. Inhal. Toxicol. 20 (10):923–33. doi:10.1080/08958370802087124.
- Löndahl, J., J. Pagels, E. Swietlicki, J. Zhou, M. Ketzel, A. Massling, and M. Bohgard. 2006. A set-up for field studies of respiratory tract deposition of fine and ultrafine particles in humans. J. Aerosol Sci. 37 (9):1152–63. doi:10.1016/j.jaerosci.2005.11.004.
- McMurry, P. H., X. Wang, K. Park, and K. Ehara. 2002. The relationship between mass and mobility for atmospheric particles: A new technique for measuring particle density. Aerosol Sci. Technol. 36:227–38. doi:10.1080/027868202753504083.
- Middlebrook, A. M., R. Bahreini, J. L. Jimenez, and M. R. Canagaratna. 2012. Evaluation of composition-dependent collection efficiencies for the aerodyne aerosol mass spectrometer using field data. Aerosol Sci. Technol. 46 (3):258–71. doi:10.1080/02786826.2011.620041.
- Mordukhovich, I., E. Wilker, H. Suh, R. Wright, D. Sparrow, P. S. Vokonas, and J. Schwartz. 2009. Black carbon exposure, oxidative stress genes, and blood pressure in a repeated-measures study. Environ. Health Perspect. 117 (11):1767. doi:10.1289/ehp.0900591.
- Moshammer, H., and M. Neuberger. 2003. The active surface of suspended particles as a predictor of lung function and pulmonary symptoms in Austrian school children. Atmos. Environ. 37 (13):1737–44. doi:10.1016/S1352-2310(03)00073-6.
- Moshammer, H., M. Neuberger, and M. Nebot. 2004. Nicotine and surface of particulates as indicators of exposure to environmental tobacco smoke in public places in Austria. Int. J. Hygiene Environ. Health 207 (4):337–43. doi:10.1078/1438-4639-00299.
- Oberdörster, G., E. Oberdörster, and J. Oberdörster. 2005. Nanotoxicology: An emerging discipline evolving from studies of ultrafine particles. Environ. Health Perspect. 113 (7):823. doi:10.1289/ehp.7339.
- Park, K., F. Cao, D. B. Kittelson, and P. H. McMurry. 2003. Relationship between particle mass and mobility for diesel exhaust particles. Environ. Sci. Technol. 37:577–83. doi:10.1021/es025960v.
- Pope, C. A., R. T. Burnett, G. D. Thurston, M. J. Thun, E. E. Calle, D. Krewski, and J. J. Godleski. 2004. Cardiovascular mortality and long-term exposure to particulate air pollution: Epidemiological evidence of general pathophysiological pathways of disease. Circulation 109 (1):71–77. doi:10.1161/01.CIR.0000108927.80044.7F.
- Rissler, J., E. Swietlicki, A. Bengtsson, C. Boman, J. Pagels, T. Sandström, A. Blomberg, and J. Löndahl. 2012. Experimental determination of deposition of diesel exhaust particles in the human respiratory tract. J. Aerosol Sci. 48:18–33. doi:10.1016/j.jaerosci.2012.01.005.
- Schaap, Á., and H. D. van der Gon. 2007. On the variability of black smoke and carbonaceous aerosols in The Netherlands. Atmos. Environ. 41 (28):5908–20. doi:10.1016/j.atmosenv.2007.03.042.
- Schwartz, J., D. W. Dockery, and L. M. Neas. 1996. Is daily mortality associated specifically with fine particles? J. Air Waste Manage. Assoc. 46: 927–39. doi:10.1080/10473289.1996.10467528.
- Sorensen, C. M., R. C. Flagan, U. Baltensperger, and D. Y. Pui. 2019. Grand challenges for aerosol science and technology. Aerosol Sci. Technol. 53 (7):731–34. doi:10.1080/02786826.2019.1611333.
- Stanier, C. O., A. Y. Khlystov, and S. N. Pandis. 2004. Ambient aerosol size distributions and number concentrations measured during the Pittsburgh Air Quality Study (PAQS). Atmos. Environ. 38 (20):3275–84. doi:10.1016/j.atmosenv.2004.03.020.
- Stenitzer, M. 2003. Nano particle formation in the exhaust of internal combustion engines. Master's thesis, Technischen Universität Wien.
- Stokes, R., and R. Robinson. 1966. Interactions in aqueous nonelectrolyte solutions. I. Solute-solvent equilibria. J. Phys. Chem. 70 (7):2126–31. doi:10.1021/j100879a010.
- UNECE. 2008. European Commission Regulation (EC) No. 692/2008. https://www.eea.europa.eu/policy-documents/commission-regulation-ec-no-692
- US EPA. 2004. Air quality criteria for particulate matter, (Final Report, 2004). U.S. Environmental Protection Agency, Washington, DC, EPA 600/P-99/002aF-bF.
- Wex, H., A. Kiselev, F. Stratmann, J. Zoboki, and F. Brechtel. 2005. Measured and modeled equilibrium sizes of NaCl and (NH4)2SO4 particles at relative humidities up to 99.1%. J. Geophys. Res. Atmos. 110 (D21). doi:10.1029/2004JD005507.
- WHO. 2012. Health effects of black carbon. WHO.
- Wiedensohler, A., W. Birmili, A. Nowak, A. Sonntag, K. Weinhold, M. Merkel, B. Wehner, T. Tuch, S. Pfeifer, M. Fiebig, et al. 2012. Mobility particle size spectrometers: Harmonization of technical standards and data structure to facilitate high quality long-term observations of atmospheric particle number size distributions. Atmos. Meas. Tech., 5:657–685. doi:10.5194/amt-5-657-2012.
- Wierzbicka, A., P. T. Nilsson, J. Rissler, G. Sallsten, Y. Xu, J. H. Pagels, M. Albin, K. Österberg, B. Strandberg, A. Eriksson, et al. 2014. Detailed diesel exhaust characteristics including particle surface area and lung deposited dose for better understanding of health effects in human chamber exposure studies. Atmos. Environ. 86:212–19. doi:10.1016/j.atmosenv.2013.11.025.
- Yeung, M. C., B. P. Lee, Y. J. Li, and C. K. Chan. 2014. Simultaneous HTDMA and HR‐ToF‐AMS measurements at the HKUST supersite in Hong Kong in 2011. J. Geophys. Res. Atmos. 119:9864–83. doi:10.1002/2013JD021146.
- Young, S. S., R. L. Smith, and K. K. Lopiano. 2017. Air quality and acute deaths in California, 2000–2012. Regul. Toxicol. Pharmacol. 88:173–84. doi:10.1016/j.yrtph.2017.06.003.