
 ?Mathematical formulae have been encoded as MathML and are displayed in this HTML version using MathJax in order to improve their display. Uncheck the box to turn MathJax off. This feature requires Javascript. Click on a formula to zoom.
Abstract
A stable high-temperature condensation particle counter (HTCPC), operating above 170 °C was realized. First a dedicated working fluid was identified in a two-stage process, consisting of a pre-selection based on relevant substance properties and a subsequent experimental evaluation. A prototype for experimental evaluation of the concept was designed and built, supported by CFD simulations considering the properties of the working fluid. The surface tension of the working fluid was measured at different temperatures, revealing higher values than predicted and a specific adhesion to graphite. With a especially developed high-temperature optics module, the proof of principle was verified. Calibration measurements have been performed against an automotive grade CPC. The operation in compliance to the legislative requirements for particle number counters was successfully proven.
Copyright © 2020 American Association for Aerosol Research
EDITOR:
1. Introduction
Condensation particle counters (CPCs) are well established devices for measuring particle number (PN) concentrations in aerosols (McMurry Citation2000; Sem Citation2002; Wang et al. Citation2010). These simple apparati were studied and developed by various groups all over the world, evolving them to reliable and established instruments (Barmpounis et al. Citation2018; Kuang et al. Citation2012; Stolzenburg and McMurry Citation1991; McMurry Citation2000; Hering Citation2018). Applications range from clean room monitoring (Zhang and Liu Citation1991) to atmospheric (Wehner et al. Citation2011) or ambient measurements (Seipenbusch, Binder, and Kasper Citation2008) to classification of automotive exhaust (Giechaskiel et al. Citation2008) due to the large range of measurable concentrations and particle species. Specialized instruments are available for every mentioned application and even hand-held devices (Hämeri et al. Citation2002) are available. Apart from some exceptions, like the water CPC (Hering et al. Citation2005), the majority of CPCs are using n-Butanol or Isopropanol as a working fluid and operating at 20° to 40°. In 2013 Nick Collings et al. proposed new concept of a CPC operating at high temperatures around 150 °C (Collings Rongchai, and Symonds Citation2014), for direct and artifact minimized PN determination of engine exhaust as alternative to the corresponding legislative regulations (Giechaskiel et al. Citation2010). The current particle number counter (PNC) requirements according to the solid particle number emission legislation require a limit of detection of less than 100 #/cm3 of the PNC, which can hardly be fulfilled by other high temperature capable devices like, e.g., ELPI, or diffusion charger based methods (United Nations Citation2014). By modifying a commercially available CPC Collings et al. demonstrated the principle operation for two siloxanes as working fluids and the necessary cutoff requirement for the European PN measurement regulation (European Commission Citation2008). The general concept of a high-temperature CPC (HTCPC) was proven, revealing a possible new application field, e.g., enabling direct measurements of hot exhaust without preconditioning or measure close to flames without influencing the particle formation. Despite the proof of concept, no long-term stability of the device was reported and after Collings work no further research on HTCPCs has been reported to our knowledge. The Collings et al. concept used an existing optical particle counter (OPC, TSI 3034), which requires further development for high temperature operation.
This work deals with the realization of an optimized HTCPC explicitly designed for high temperature operation. Our study comprises a dedicated saturator and condenser design, supported by CFD simulations, an extensive study on different working fluid candidates and the development of a high-temperature OPC. We placed special emphasis on long-term stable operation and enabling measurements in accordance with current European PN measurement regulation. Furthermore the approach of a high temperature CPC would allow to extend the size range covered by regulatory guidelines from 23 down to 10 nm, without the risk of counting artifacts caused by nucleation mode particles due to sampling. Thus, the high temperature CPC might pave the way to a robust alternative to the existing PMP protocol (United Nations Citation2014).
2. Materials and methods
The study comprises the identification of an appropriate working fluid, the design of a HTCPC embodiment and a dedicated high-temperature optics module.
2.1. Working fluid
The long-term stability of HTCPC operation requires a working fluid that is thermally stable, has applicable vapor pressures at high temperatures and is widely available. A dedicated working fluid was identified from a wider pre-selection of possible candidates belonging to various classes of chemicals. The surface tension of the chosen working fluid was measured. Using the specific material parameters of the substance, CFD-simulations were performed to optimize the HTCPC design. The device was built and its function evaluated experimentally.
Identifying a suitable working fluid is a crucial part of the realization of a HTCPC. Collings et al. selected their working fluid by an empirical approach (Collings Rongchai, and Symonds Citation2014). They evaluated six substances and tested four in operation with their HTCPC device: a per-fluorinated polyether, a polyphenyl ether, tetramethyl tetraphenyl trisiloxane and pentaphenyl trimethyl trisiloxane. A sufficient counting efficiency was reported with the two siloxanes. Based on the results of Collings et al., we performed for a systematic study on possible working fluids for high temperature application.
2.1.1. Preselection
Based on criteria favorable for a CPC working fluid, which were, e.g., identified by Magnusson et al. (Magnusson et al. Citation2003), a preselection of potential working fluids was done. In total 46 substances out of 10 substance classes were chosen (see ). To evaluate the potential of the candidate substances to act as a working fluid, an adapted classical nucleation theory (CNT) approach according to Magnusson et al. Citation2003 was applied. The nucleation criteria found in their work are basing on a derivation of an explicit solution for the saturation ratio from the CNT.
Table 1. Investigated potential high-temperature CPC working fluids, sorted by classes.
To find nucleation criteria from the CNT equation, Magnusson et al. set the nucleation rate to 1 #/cm3s and to obtain an explicit solution for the saturation ratio, they replaced the product of the saturation ratio and the saturation vapor pressure by the partial pressure. Insertion into the Kelvin equation leads them to the following expression for the Kelvin diameter dK:
(1)
(1)
with the gas constant R, the temperature T, the molecular weight M, Avogadro’s constant NA, the surface tension σ, the partial pressure p and the density ρ. Magnusson et. al. state that “σ is the strongest factor that influences the theoretical dK as expressed by the CNT.” From EquationEquation (1)
(1)
(1) it follows that dK is directly proportional to
so fluids with a higher surface tension should give a smaller Kelvin diameter. Basing on experimental evaluation they conclude that a high surface tension in combination with a low molecular weight will generally have a small Kelvin diameter, whereas they saw a dominant influence of the surface tension. Additionally, a correlation with the dielectric constant was shown and explained by the relationship between the surface tension and the dielectric constant (Papazian Citation1971). The found correlations can be seen as a general trend and applied with varying success to different classes of chemicals. Iida, Stolzenburg, and McMurry Citation2009 states the same result, the surface tension has the dominant correlation with the activation efficiency.
The potential working fluid candidates were classified by these parameters. As additional other important substance properties we included: melting point, boiling point, dissociation temperature, flash point, ignition point, density, vapor pressure, viscosity, polarity, estimated consumption, diffusivity, toxicity, corrosivity, solvation and price. The substances were classified by selection criteria listed in Appendix B. The properties were taken from literature (Kirk et al. Citation2007; VDI-Gesellschaft Citation2005; Poling, Prausnitz, and O’Connel Citation2001; Marrero and Mason Citation1972; Haynes Citation2012; NIST Citation2015; infotherm.com Citation2015), but for many substances very little experimental high-temperature data were available. In the cases the values were available for lower temperatures, linear extrapolation to higher temperatures were performed. If data were not available, they were calculated from regression equations found in literature (Kirk et al. Citation2007; VDI-Gesellschaft Citation2005; Poling, Prausnitz, and O’Connel Citation2001; Marrero and Mason Citation1972; Haynes Citation2012; NIST Citation2015; infotherm.com Citation2015). The table used for the preselection can be found in Appendix E.
2.1.2. Degradation experiments
To test the most promising working fluid candidates under operational conditions, a dedicated vessel with four equal containers, each with a volume of 40 mL, was manufactured from aluminum. Three tests were performed. First the vessel was sealed tightly and heated for 8 h to 250 °C with 20 mL of one substance in every container. Second, a piece of silicon carbide (SiC), as a candidate for a wick material, was placed into the container with the substance and again heated for 8 h to 250 °C. Finally the container was filled with the working fluid candidates and additionally with 200 µL water and again heated for 8 h to 250 °C, to test for hydrolysis.
2.1.3. Surface tension measurement
Since the surface tension was considered as the crucial parameter for the nucleation behavior and for none of the considered substances measured values at high temperature were available, measurements for the found working fluid (the working fluid is presented in section 3.1) were done. By the pendent droplet method the bulk surface tension was measured. Therefore a aluminum capillary with an outer diameter of 1.5 mm was attached upright to the side of a heated aluminum block so that cm protruded from the bottom. Solid pieces of the working fluid were held to the hot capillary, so the melted working fluid flew down to the tip of the capillary, forming a droplet. The droplet was photographed with a digital camera and the pictures were analyzed using the open source “Opendrop” software (Berry et al. Citation2015) The measurement was done between 80 °C and 220 °C in steps of 20 °C. The temperature of the aluminum block was controlled by a PID algorithm (Pt100) and restive heating. For every temperature setting the system was held for about 10 min to assure a uniformly temperature distribution in the capillary and the droplet. It was assumed that the capillary and the droplet take the temperature from the heated aluminum block, since the free part if the capillary and the droplet had a small mass and the thermal conductivity inside the material can be considered much higher than losses due to convection and radiation.
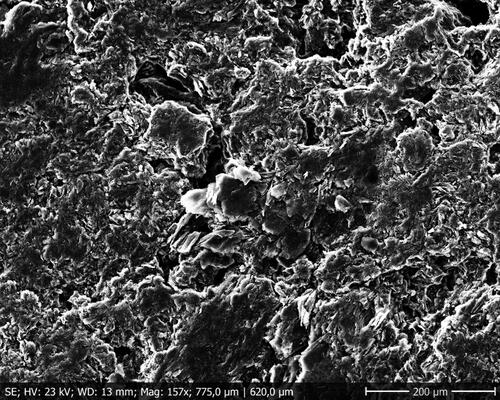
Second the contact angle on a graphite substrate was measured between 80 °C and 220 °C in steps of 20 °C to investigate the material influence. The temperature of the graphite was controlled by a PID algorithm (Pt100) and restive heating. The setup was in a cubic box with 10 cm edge length and an opening for a digital camera, to ensure homogeneity between the setup and the surrounding air. Graphite was chosen to estimate the specific adhesion forces between the working fluid and soot. The nature of the used graphite was inspected with a scanning electron microscope (SEM, ) before the experiment and was identified as natural, crystalline graphite.
2.2. Flow design
The wick is a core element of the HTCPC. It is a porous material placed inside the saturator (location 6, ) and is in contact with the working fluid. By capillary forces it soaks completely and its high surface enables fast saturation of the passing aerosol with vapor from the working fluid. We used a cylinder from cordierite ceramics, originally used as a substrate for diesel particulate filters. The particle flow does not pass through the wick, since high losses can be expected. Therefore the HTCPC followed a sheathed-flow design (Stolzenburg and McMurry Citation1991) whereby the aerosol is injected separately (location 9) from the saturated vapor stream (location 8). Nitrogen was chosen as carrier gas to guard against oxidation of the working fluid, catalyzed by the wick material.
Figure 1. Schematics of the HTCPC setup. (a) Flow diagram of the operation, (b) scheme of the used HTCPC device. (1) Nozzle, (2) condenser, (3) PEEK-insulation, (4) elbow, (5) saturator, (6) wick, (7) saturator inlet, (8) PEEK carrier gas inlet, and (9) particle flow inlet.
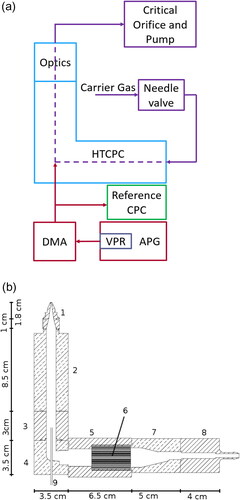
The HTCPC prototype was designed with a horizontal saturator containing the wick and a vertical condenser (Agarwal and Sem Citation1980). The device is thus shaped like a “L” (). It was manufactured mainly from aluminum, except where noted. The saturator is in total 6.5 cm long and contains one wick from NGK cordierite ceramics with cylindrical shape, 4 cm long and 2.5 cm in diameter. The wick fills the inner diameter of the saturator completely, enabling a flow with a honeycomb structure with a cell density of 400/inch2 (15.75 mm–2) and 0.2 mm wall thickness. The flow is led through an elbow and a 3 cm insulation made from Polyether ether ketnoe (PEEK) into the 8.5 cm long condenser, on whose end a nozzle with 1.8 cm length and a 500 µm outlet aperture is attached. To bypass the wick with the particle flow, a capillary with an inner diameter of 0.7 mm was introduced through the elbow, so that the particles enter directly into the condenser.
The filling of the working fluid into the saturator was controlled by means of an optical filling level monitor, a heated magnetic valve and an external heated tank.
CFD simulations regarding the flow and the droplet growth were performed with Ansys Fluent 16.0.1 using a density-based implicit solver with the pseudo-transient solution method. The fluid calculation uses the ideal gas model and considers the fluid as a mixture of two gases, whereas air was considered as one gas and the working fluid vapor as the second. The mass fractions of the gases in the fluid were calculated continuously, considering condensation at the walls and evaporation at the completely wetted wick. Thermal dependency of material properties was also considered in the simulation (see Appendix C).
The material properties of the working fluid are crucial input parameters (they are listed in Appendix C), since they influence the calculation in many ways like the saturation, the thermal diffusion of the vapor or the nucleation. The flow was set to 1 L min−1 at standard conditions -101 325 Pa and 273.15 K. For the simulation the temperature of the saturator was 210 °C, the temperature of the condenser was 190 °C. The Kelvin diameter and the droplet growth were calculated by post processing, using the resulting parameters from the simulation for the steady state. All simulations were full 3 D, using the original manufacturing CAD files without the capillary since just the general flow through the device was studied. The design was revised basing on the simulation results and was not simulated again.
2.3. Optics module and characterization
Two types of experiments were performed. First, for a fundamental proof of principle it was tested if particle activation (heterogeneous nucleation) occurs. Second the counting efficiency was measured.
For reliable measurements also the counting of the droplets must happen at high temperatures, since cooling over large temperature differences would cause a high supersaturation and therewith homogeneous nucleation becomes very likely. Performing optical measurements at about 200 °C requires a design which differs from typical OPCs, since no electronic components would stand the heat. For these studies an “open module” was developed for first experiments and inspection of the process. For the second set of experiments a dedicated high-temperature counting module was developed, designed to optimize the collection of scattered light in the high temperature environment.
2.3.1. Open optics module
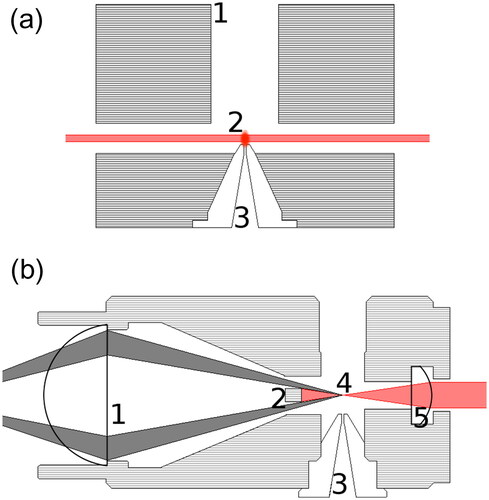
The open module carries no optical components (thus “open”) beside optional plane-parallel windows and allows optical measurements above the nozzle up to an angle of 23° in the horizontal plane of the beam (see ). It was constructed from aluminum and surrounds the nozzle completely. The aerosol is led upwards into exhaust removal. The purpose of it is to keep the aerosol flow at operational temperatures after leaving the nozzle and allow optical measurements like static light scattering (SLS). The optional plan parallel windows prevent disturbance by unwanted flows. Direct ejection of the hot saturated aerosol into ambient temperatures through the nozzle would create a very high supersaturated working fluid vapor and therewith bias the measurement. Also, for our working fluid, which is presented in section 3.1, the emerging fog solidifies at ambient temperature and starts to settle. The scattering on the solidified droplets would prevent any reliable optical measurement if not heated. For our optical measurements a 635 nm laser (Thorlabs CPS635) was aligned in such a way that it passed right above the nozzle at the end of the condenser. The scattered light was detected by a movable detector (avalanche photo diode, Thorlabs APD 120 A2/M) at different angles to inspect the angular dependency of the scattering.
Figure 2. Schematics of the (a) open optics module and (b) the counting optics module. (a): (1) Aerosol outlet, (2) scattering event, and (3) nozzle of the HTCPC. The observation is possible by a drilling perpendicular to the drawing. (b): (1) Collecting lens for the scattered light, (2) beam dump, (3) nozzle of the HTCPC, (4) scattering event, and (5) cylindrical collimating lens.
2.3.2. Counting optics module
The counting optics module (see ) was realized again with a 635 nm laser (Thorlabs CPS635). To improve the laser beam profile four adjustable shades were used to remove the dispersed light from the focused beam. The emerging beam was lead to the optics module by three mirrors, so repositioning was possible without moving the laser itself. A cylindrical lens (Thorlabs LJ1636L1) attached to the optics module focused the beam right above the nozzle at the end of the condenser. The distance of the lens to the nozzle was twice the focal length of the lens. By focusing the laser beam the interaction time of the droplets with the laser beam is minimized and the intensity of the scattering maximized. The beam is then dumped into a blackened rod. A converging lens (Thorlabs LA1951) attached at the other end of the module collected the scattered light and directed it onto an avalanche photo diode (Thorlabs APD 120 A2/M) which was placed away from the heated module right into the focus of the lens. The distance of the scattering event and the detector was chosen to twice the focal length of the lens. The diode signal could either be collected by an oscilloscope (Tektronix MDO3024) for adjustment and inspection or be connected to counting electronics supplied by AVL List GmbH, providing a pulse count per second in real time with dead time correction.
2.3.3. Scattering measurements
For the first experiments the open module was attached to the top of the condenser. Experiments were performed using pressurized air. The total flow through the device was 0.6 L min−1, set by a Vögtlin red-Y mass flow controller (MFC) at room temperature and driven by the gas flow from the laboratory pressurized air system. The exhaust was removed by laboratory ventilation.
The scattered light was inspected within a master’s thesis with dedicated a setup for detection of static light scattering (SLS). The detected scattering was, as expected, angular dependent Mie-scattering, originated by the working fluid droplets (Kuegler Citation2018).
2.3.4. Calibration measurements
The second part, regarding the performance of the HTCPC, was done with the counting optics module (). The linearity and the detection efficiency were measured to evaluate the performance of the HTCPC. A critical orifice was used to set the flow to 1 L min−1 at the outlet of the optics module. The critical orifice was heated to 60 °C, to prevent plugging by solidification of n-Eicosane. The flow was verified at this temperature. The flow through the capillary was controlled indirectly by a needle valve and flow meter at the carrier gas inlet. By a fixed overall flow given by the critical orifice, the difference between the overall flow and the carrier gas flow is the particle sample flow.
The saturator, condenser and the optics module were wrapped into glass wool for thermal insulation and to facilitate thermal stabilization. The operational temperatures were 205 °C saturator, 170 °C condenser, and 215 °C for the optics.
The linearity was measured with an AVL 10 nm CPC (factory calibration, AVL List GmbH) as a reference. Soot particles with polydisperse size distribution were generated with an AVL particle generator (APG, AVL List GmbH). The aerosol of the APG passed an internal volatile particle remover (VPR) and was then diluted by an internal dilution bridge. The dilution was set to 32 stationary points between 0 #/cm3 to 30000 #/cm3 in 4 independent test series, for every point data was collected for 30 s.
The detection efficiency was measured also with an AVL 10 nm CPC (factory calibration, AVL List GmbH) as a reference and a TSI 3082 differential mobility analyzer (DMA, TSI Ltd.) for selection of particles with the same mobility diameter (see for the flow diagram). Soot particles were again generated with an APG, by usage of the internal VPR and the internal dilution bridge. Particles were mobility selected with a DMA after the APG and afterwards the flow was lead subsequently into the HTCPC and the reference CPC. The size dependent counting efficiency was measured at 10, 20, 23, 30, 40, 50, 60 and 80 nm. nm. Data was collected for 60 s for every size, the repeated 3 times. The measurements of the HTCPC and the reference were done subsequently for every set point.
2.3.5. Long term durability
To test the long term durability against engine exhaust, measurements at two chassis dynamometer at the Institute of Internal Combustion Engines and Thermodynamics of the Technical University of Graz were done. Six types of tests were conducted with varying test cycles. The total time of operation was 450 min whereas in total 223 min a test was driven. The flow through the device and the sample flow were not switched off between the test runs. The tests were done within an ordered measurement campaign, thus details of the tested vehicles cannot be published. Measurements were done at a motorcycle equipped with a 1 L gasoline engine and a passenger car, also equipped with a 1 L gasoline engine. With the motorcycle two WMTC cycles were driven and with the car an IUFC, an ERMES and a RDE cycle1, followed by some constant points. The tests at one vehicle were done on one day in a row and both vehicles were tested within a week. The HTCPC was not serviced in between.
The sample position was at the transition line which transports the exhaust from the tailpipe to the dilution tunnel. The sample was drawn at ambient temperature with a Tygon tube to the particle flow inlet of the HTCPC, as carrier gas nitrogen was used. The sample position and the tube were at room temperature. Reference data from the other particle number counting devices available at the chassis dynamometer must not be published since it was an ordered measurement campaign. As a reference device the DownToTen system was installed, a loss optimized sampling system for sub 23 nm exhaust particles, equipped with a 10 and a 23 nm CPC (Bainschab et al. Citation2017).
3. Results and discussion
3.1. Working fluid
From the preselection (described in section 2.1) four promising candidates were selected for further evaluation: Palmitic Acid, n-Eicosane, Dibenzyltoluene and Dibutyl Sebacate (see ).
Table 2. Parameters of the four final working fluid candidates.
3.1.1. Degradation experiments
As shown in the investigations showed a significant thermal degradation and gas formation for Palmitic acid even with the sole substance in the vessel. Also, the aluminum was attacked rigorously. In contrast, with n-Eicosane no material change was observed at all three tests. A spectroscopic analysis of the n-Eicsane heated in the vessel, showed no decomposition products. Dibenzyltoluene turned from its original transparent appearance into a yellowish color at all three tests, but no additional influence from water or the SiC was observed. Dibutyl Sebacate also indicated thermal resulting in formation of solid particles, floating in the mixture of the original substance and other degradation products.
Figure 3. The vessel for experimental evaluation of the temperature stability of the four final working fluid candidates after being heated to 8 h to 250 °C. 1: Dibenzyltoluene, 2: Dibutyl Sebacate, and 3: Palmitic Acid and 4 n-Eicosane.
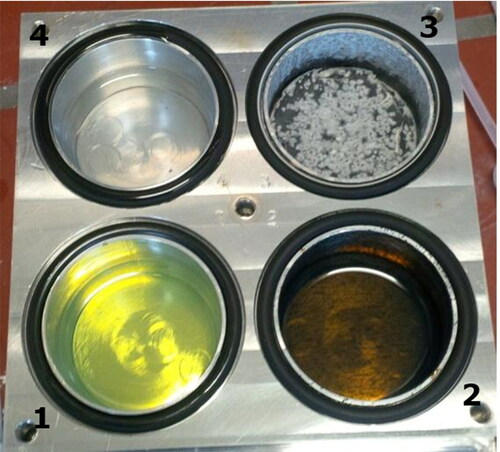
As a result of the selection experiments, n-Eicosane (), an aliphatic hydrocarbon, was selected as the dedicated working fluid. As a saturated and acyclic hydrocarbon its high boiling point, the high vapor pressure at operational temperatures (1532 mPa at 200 °C) and its classification as non-hazardous according to the chemical data sheet, made it in combination with the commercial availability at high purity the most desirable working fluid. As a paraffin n-Eicosane further combines many favorable properties from which chemical inertness should be emphasized. Therewith unwanted chemical reactions with the specimen are very unlikely, even at the high operating temperatures. As already stated before, to guard against oxidation catalyzed by the wick material, nitrogen was used as carrier gas.
Having assessed the working fluid feasibility based on bulk properties, there are still influences on the CPC operation which must be assessed relating to the nucleating and growth potential with a CPC. Two things should be pointed out here explicitly, first the chemistry between the particle functioning as nucleation seed and the working fluid and second the morphology of the particle. These influences are dominant and differ between particle species (Giechaskiel et al. Citation2011). The specific behavior has to be checked within a measurement campaign, so it can be considered for reliable CPC operation.
3.1.2. Surface tension measurements
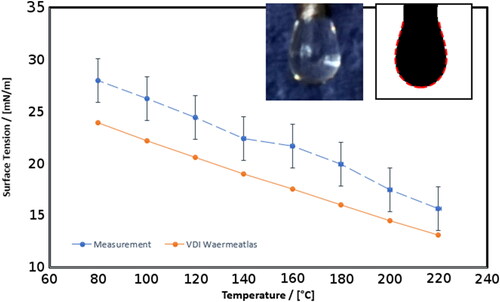
For the surface tension measurement, the digital photography taken at the pendent droplet experiment was evaluated using the “Opendrop” software (Berry et al. Citation2015). As input parameter the density of the material is required by the program, the values were taken from literature (Poling, Prausnitz, and O’Connel Citation2001). The measured surface tension values are shown in (see Appendix D for the values). The measurement gave values higher than the regression formula from literature (VDI-Gesellschaft Citation2005). The deviation of the measurement to the literature data is between 10% and 15%. As discussed in section 2.1, a higher surface tension causes a smaller Kelvin diameter dK. According to Magnusson et al. Citation2003 this reduces the calculated value for dK from the HTCPC simulation (presented in the next section) about 7%.
Figure 4. Measured surface tension of n-Eicosane in dependency of the droplet temperature, for comparison plotted with surface tension data from literature (VDI-Gesellschaft Citation2005). In the upper right corner an example is given for the picture evaluation. Left the original picture for the droplet at 220 °C is shown, right the evaluated shade of the droplet. The dashed line is the result of the “Opendrop” software.
The measurement of the contact angle of n-Eicosane on a graphite surface demonstrated complete wetting, since every droplet of n-Eicosane deliquesced on the graphite surface. Even with the setup open in the lab with the graphite heated to about 50 °C no contact angle could be observed. This behavior can be explained on one hand by the low surface tension of n-Eicosane compared to the surface energy of the graphite surface, but it also indicates high adhesion forces between the liquid and graphite. Thus efficient particle activation for soot is very likely. The specific adhesion forces cause the formation of a first layer of n-Eicosane on a soot particle in a supersaturated vapor, for much smaller sizes than the Kelvin diameter (Fletcher Citation1958). Since soot is a fractal particle, this process is enhanced by capillary condensation (Philip Citation1977). For a covered particle the interface to the vapor is completely given by the working fluid film and therewith the nucleation behavior follows CNT very close. Though, particles in automotive exhaust are not only soot. The interplay of different particle materials with n-Eicosane might result in material specific differences for the counting efficiency of the HTCPC.
3.2. Flow design
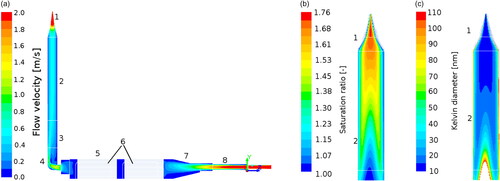
The flow dynamics within the original HTCPC design were investigated by CFD for typical operational flow rates (1 L minFootnote1 total) and temperatures (temperature difference of 20 °C). The results in show a laminar flow at the inlet and through the honeycomb structure of the wick. At the elbow a flow separation is predicted although the flow remains laminar through. The saturation of the wick was revealed to be very good. Modeled with a completely wetted honeycomb structure, after approximately 10 mm of the first wick 100% saturation of the gas is reached in the simulation. In consequence of these results, one wick was removed and the elbow was redesigned to minimize the flow separation, the revised design is shown in . The temperature of the gas in the condenser does not reach the condenser temperature, anyway a very high saturation of almost 180% is predicted for a δT of 20 °C. Considering the results of the surface tension measurements, the values of the calculated Kelvin diameter dK has to be reduced by 7% to nm.
Figure 5. Results of the Ansys Fluent simulation of the HTCPC geometry. (1) Nozzle, (2) condenser, (3) PEEK-insulation, (4) elbow, (5) saturator, (6) wick, (7) saturator inlet, (8) PEEK aerosol inlet, and (9) carrier gas inlet. (a) Flow profile inside the HTCPC geometry, a flow separation is visible at the elbow. A particle flow inlet (pos. (9) in ) was not considered. (b) The saturation ratio inside the condenser of the HTCPC. Very high values of nearly 180 % saturation were calculated for the set temperature difference of 20 °C. (c) Basing on the simulation results, the homogeneous Kelvin diameter was calculated. For the high supersaturation region an activation of 10 nm particles is possible. In subfigures (b) and (c) the condenser was stretched in diameter for better readability.
3.3. Optics module and characterization
Examination of the condensation behavior brought distinct results. At fixed operating temperatures, scattered light from droplets could be observed above the nozzle. If a HEPA filter was attached to the particle inlet, the scattering vanished. This proves heterogeneous nucleation on particles introduced into the device. As already mentioned, the scattered light was inspected by a SLS setup with a master’s thesis (Kuegler Citation2018) to characterize the droplets. The droplet diameter was found in the regime 4 µm to 8 µm (Kuegler Citation2018).
The intensity of the scattering can be taken as an estimator for the supersaturation, since the droplets grow bigger, the time to pass the laser beam increases and thereby increase the scattered intensity at a fixed flow rate. Changing the temperature difference between saturator and condenser influenced the observed scattering. Lowering the temperature difference caused a decrease of the intensity. Increasing the temperature difference also increased the scattered intensity, since the final droplet size and therefore the scattered intensity is dependent on the supersaturation.
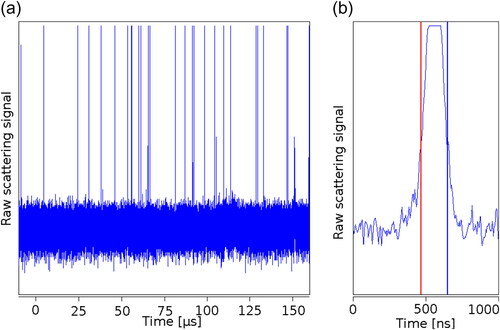
Using the counting optics module, the scattered light was inspected with an oscilloscope () and analyzed offline. Peaks were again only visible if particles were in the aerosol stream. The peak width was found to be about 200 ns (FWHM), which matches with a flow of 1 L min−1 and a nozzle diameter of 1 mm the approximated droplet size of a few µm at the given size of the laser focus. With the efficient light collection of the counting optics module, the APD reached saturation for every peak, which facilitates the counting but makes the peak intensity inspection impossible.
Figure 6. Raw signal of the detected scattered light above the HTCPC nozzle. Every peak in the graph is one droplet passing the laser beam. If no particles were in the aerosol, no peaks were present in the signal. (a) 400 µs of raw data, multiple peaks are visible and (b) magnification of 1 µs. The FWHM of the peak is about 200 ns.
3.3.1. Calibration measurements
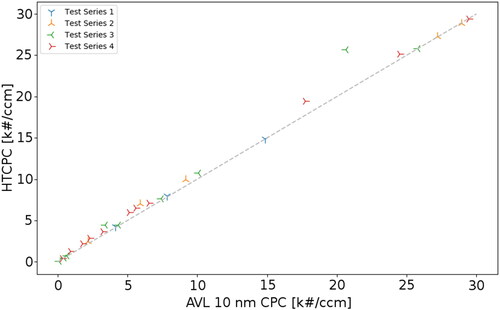
The result of the linearity check is shown in . For all four test series the response to changes in the particle concentration of both devices is very similar over the whole concentration range. The coefficient of determination gives R2 = 0.9907, calculated with Pearson’s formula of the correlation coefficient. By trend the HTCPC slightly overestimates the concentration.
Figure 7. Results of the linearity of the HTCPC to an 10 nm AVL CPC. 32 stationary points were measured in 4 test series (measurements). R2 = 0.9907. Saturator temperature: 205 °C; condenser temperature: 170 °C.
The measured detection efficiency on soot particles in dependency of the particle mobility diameter is shown in . The data is normalized to the measurement at 90 nm and corrected size dependent for losses in the particle supply and the capillary according to Hinds Citation1999; Baron and Willeke Citation2001. The counting efficiency curve of the reference device–the AVL 10 nm CPC–was considered for deriving the HTCPC counting efficiency. The legislative requirements for PNC according to Annex 5 of the GTR 15 (United Nations Citation2014) prescribes a detection efficiency of 50 ± 12% at 23 ± 1 nm and >90% at 41 ± 1 nm. For all three measurements the requirement at 23 nm is fulfilled and two measurements also fulfill it at 41 nm. The detection efficiency at 23 nm is at the lower end for all three measurements, thus fine tuning of the efficiency curve to reliably match the requirements by adaptation of saturator and condenser temperature is possible. This was not done within this study, since the possibility of a compliant measurement device was clearly proved.
Figure 8. Results of three detection efficiency measurements of the HTCPC for soot from a APG, corrected for diffusional losses in the capillary. Marked span covers GTR 15 requirements. Every point is the mean value of 60 s sampled data. Saturator temperature: 205 °C; condenser temperature: 170 °C.
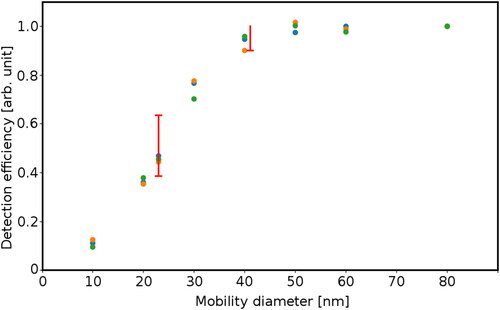
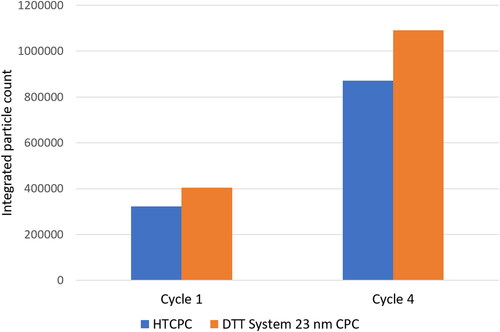
Figure 9. Integrated particle counts from two driven cycles from at the testbed. The ratio of both values is 1.25 in both cases.
It shall be noted that the observed working fluid consumption was about twice as the considered 8 mL h−1 for the simulation.
3.3.2. Long term durability
After 450 min of total operation and 223 min exposure to undiluted automotive exhaust, the HTCPC was functioning unrestricted. For automotive grade CPC that corresponds to at least 45000 min of operation (dilution >100). Inspection of the wick and the remaining working fluid showed no residue of chemical interaction with the exhaust.
The particle count was in correlation with the reference devices and a drift was not indicated, thus long term stability of operation is given. The integrated particle count over two complete cycles gives a ratio of 1.25 between the HTCPC and the reference CPC with legislation compliant counting efficiency for the first and one of the later cycles (see ). Data from the particle number counting devices available at the chassis dynamometer must not be published since it was an ordered measurement campaign. Furthermore for proper PN measurements with the HTCPC a calibration procedure for high temperatures has to be developed first.
4. Conclusion
The feasibility of our optimized HTCPC was proven. With systematic investigations we identified n-Eicosane as the best candidate for a high temperature working fluid. The measurements of its bulk surface tension gave in mean 7% higher values than predicted by the regression formula from the literature what results in a smaller dK. Measuring the contact angle on a graphite surface revealed specific adhesion forces between the two substances, making it even an even more desirable working fluid for automotive exhaust. The sheathed-flow design of the HTCPC enables a continuous laminar flow through the device and thus minimizing particle losses. As carrier gas nitrogen is used to prevent oxidation of the working fluid, catalyzed by the wick. With an open optics module we inspected the operation of the device and characterized the droplet growth. With our especially developed high temperature counting optics module, operating at 215 °C, we proved CPC operation at high temperatures. Calibration measurements were done using soot particles from an APG and revealed a linear behavior and a counting efficiency compliant to the current legislative requirements. By measurements on automotive exhaust for 223 min and a total operation time of 450 min, the long-term stability of the device was verified.
Acknowledgments
This project was performed within the COMET Centre ASSIC Austrian Smart Systems Integration Research Center, which is funded by BMVIT, BMDW, and the Austrian provinces of Carinthia and Styria, within the framework of COMET – Competence Centres for Excellent Technologies. The COMET programme is run by FFG. This work was supported by AVL List Gmbh.
Notes
1 The “RDE cycle” is a standardized route in Graz for measurements with portable emission measurement systems, for comparison a according test is also used at the chassis dynamometer.
Related Research Data
References
- Agarwal, J. K., and G. J. Sem. 1980. Continuous flow, single-particle-counting condensation nucleus counter. J. Aerosol Sci. 11 (4):343–57. doi:10.1016/0021-8502(80)90042-7.
- Bainschab, M., A. Bergmann, P. Karjalainen, J. Keskinen, J. Andersson, B. Giechaskiel, C. Haisch, A. Mamakos, L. Ntziachristos, Z. Samaras, et al. 2017. Extending particle number limits to below 23 nm: First results of the H2020 DownToTen Project. 2017 ETH-Conference on Combustion Generated Nanoparticles, ETH Zürich, CH. doi:10.1021/es505109u.
- Barmpounis, K., A. Ranjithkumar, A. Schmidt-Ott, M. Attoui, and G. Biskos. 2018. Enhancing the detection efficiency of condensation particle counters for sub-2 nm particles. J. Aerosol Sci. 117 (October 2017):44–53. doi:10.1016/j.jaerosci.2017.12.005.
- Baron, P. A., and K. Willeke. 2001. Aerosol measurement. 2nd ed., 1063. Hoboken, NJ: Wiley-Interscience.
- Berry, J. D., M. J. Neeson, R. R. Dagastine, D. Y. C. Chan, and R. F. Tabor. 2015. Measurement of surface and interfacial tension using pendant drop tensiometry. J. Colloid Interface Sci. 454:226–37. doi:10.1016/j.jcis.2015.05.012.
- Collings, N., K. Rongchai, and J. P. R. Symonds. 2014. A condensation particle counter insensitive to volatile particles. J. Aerosol Sci. 73:27–38. doi:10.1016/j.jaerosci.2014.03.003.
- European Commission. 2008. Commission regulation (EC) No 692/2008 of 18 July 2008. Official Journal of the European Union, 136. Luxembourg: Publication Office of the European Union.
- Fletcher, N. H. 1958. Size effect in heterogeneous nucleation. J. Chem. Phys. 29 (3):572–6. doi:10.1063/1.1744540.
- Giechaskiel, B., P. Dilara, E. Sandbach, and J. Andersson. 2008. Particle measurement programme (PMP) light-duty inter-laboratory exercise: comparison of different particle number measurement systems. Meas. Sci. Technol. 19 (9):095401.doi:10.1088/0957-.
- Giechaskiel, B., X. Wang, D. Gilliland, and Y. Drossinos. 2011. The effect of particle chemical composition on the activation probability in n-butanol condensation particle counters. J. Aerosol Sci. 42 (1):20–37. doi:10.1016/j.jaerosci.2010.10.006.
- Giechaskiel, B., M. Cresnoverh, H. Jörgl, and A. Bergmann. 2010. Calibration and accuracy of a particle number measurement system. Meas. Sci. Technol. 21 (4):045102 (13 pp). doi:10.1088/0957-0233/21/4/045102.
- Hämeri, K., I. K. Koponen, P. P. Aalto, and M. Kulmala. 2002. The particle detection efficiency of the TSI-3007 condensation particle counter. J. Aerosol Sci. 33 (10):1463–9. doi:10.1016/S0021-8502(02)00090-3.
- Haynes, W. M. 2012. CRC handbook of chemistry and physics. 93rd ed., 100 Key Points. Boca Raton, FL: CRC Press, Taylor & Francis Group. https://books.googleat/books?id=-BzP7Rkl7WkC.
- Hering, S. V., M. R. Stolzenburg, F. R. Quant, D. R. Oberreit, and P. B. Keady. 2005. A laminar-flow, water-based condensation particle counter (WCPC). Aerosol Sci. Technol. 39 (7):659–72. doi:10.1080/02786820500182123.
- Hering, S. V. 2018. From particle counting to aerosol collection: just add water. In 2018 IAC abstract book, 1. St. Louis, MO: IAC. http://aaarabstracts.com/2018IAC/AbstractBook.pdf.
- Hinds, W. C. 1999. Aerosol technology: properties, behavior, and measurement of airborne particles. Hoboken, NJ: Wiley-Interscience. https://books.google.at/books?%20id=ORxSAAAAMAAJ.
- Iida, K., M. R. Stolzenburg, and P. H. McMurry. 2009. Effect of working fluid on sub-2 nm particle detection with a laminar ow ultrafine condensation particle counter. Aerosol Sci. Technol. 43 (1):81–96. doi:10.1080/02786820802488194.
- infotherm.com. 2015. http://www.fiz-chemie.de/en/home/products-services/chemical-data/thermophysics/infotherm.html.
- Kirk, R. E., D. F. Othmer, M. Grayson, and D. Eckroth. 2007. Kirk-Othmer encyclopedia of chemical technology mass transfer. Kirk-Othmer Encyclopedia Chem. Technol. 1–75. doi:10.1002/0471238961.
- Kuang, C., M. D. Chen, P. H. McMurry, and J. Wang. 2012. Modification of laminar flow ultrafine condensation particle counters for the enhanced detection of 1 nm condensation nuclei. Aerosol Sci. Technol. 46 (3):309–15. doi:10.1080/02786826.2011.626815.
- Kuegler, M. 2018. Particle detection and experimental evaluation of different material combinations for saturators of particle counting devices. Master’s thesis, Graz University of Technology.
- Magnusson, L.-E., J. A. Koropchak, M. P. Anisimov, V. M. Poznjakovskiy, and J. F. de la Mora. 2003. Correlations for vapor nucleating critical embryo parameters. J. Phys. Chem. Ref. Data 32 (4):1387–410. doi:10.1063/1.1555590.
- Marrero, T. R., and E. A. Mason. 1972. Gaseous diffusion coefficients. J. Phys. Chem. Ref. Data 1.
- McMurry, P. H. 2000. A review of atmospheric aerosol measurements. Atmos. Environ. 34 (12–14):1959–99. doi:10.1016/S1352-2310(99)00455-0.
- NIST. 2015. NIST Chemistry WebBook. https://webbook.nist.gov.
- Papazian, H. A. 1971. Correlation of surface tension between various liquids. J. Am. Chem. Soc. 93 (22):5634–6. doi:10.1021/ja00751a008.
- Philip, J. R. 1977. Unitary approach to capillary condensation and adsorption. J. Chem. Phys. 66 (11):5069–75. doi:10.1063/1.433814.
- Poling, B. E., J. M. Prausnitz, and J. P. O’Connel. 2001. The properties of gases and liquids. 5th ed., 803. New York: The McGraw-Hill Companies. doi:10.1036/0070116822.
- Seipenbusch, M., A. Binder, and G. Kasper. 2008. Temporal evolution of nanoparticle aerosols in workplace exposure. Ann. Occup. Hyg. 52 (8):707–16. doi:10.1093/annhyg/men067.
- Sem, G. J. 2002. Design and performance characteristics of three continuous-ow condensation particle counters: A summary. Atmos. Res. 62 (3-4):267–94. doi:10.1016/S0169-8095(02)00014-5.
- Stolzenburg, M. R., and P. H. McMurry. 1991. An ultrafine aerosol condensation nucleus counter. Aerosol Sci. Technol. 14 (1):48–65. doi:10.1080/02786829108959470.
- United Nations. 2014. “GTR 15 - Global Registry Worldwide harmonized Light vehicles Test Procedure.” Global Registry, no. 15. http://www.unece.org/fileadmin/DAM/trans/main/wp29/wp29r-1998agr-rules/ECE-TRANS-180a15e.pdf.
- VDI-Gesellschaft. 2005. VDI-Wärmeatlas. Düsseldorf: VDI e.V. https://books.google.at/books?%20id=FyJBFadu8c0C.
- Wang, X., R. Caldow, G. J. Sem, N. Hama, and H. Sakurai. 2010. Evaluation of a condensation particle counter for vehicle emission measurement: Experimental procedure and effects of calibration aerosol material. J. Aerosol Sci. 41 (3):306–18. doi:10.1016/j.jaerosci.2010.01.001.
- Wehner, B., H. Siebert, M. Hermann, F. Ditas, and A. Wiedensohler. 2011. Characterisation of a new Fast CPC and its application for atmospheric particle measurements. Atmos. Meas. Tech. 4 (5):823–33. doi:10.5194/amt-4-823-2011.
- Zhang, Z., and B. Y. H. Liu. 1991. Performance of TSI 3760 condensation nuclei counter at reduced pressures and ow rates. Aerosol Sci. Technol. 15 (4):228–38. doi:10.1080/02786829108959530.
Appendix A. Inspection of the graphite surface
Figure A1. SEM picture of the graphite surface before the measurement of the contact angle of the working fluid.
Appendix B. Selection criteria for the working fluid selection
Table B1. Selection criteria applied for the preselection of the working fluid candidates.
Appendix C. Parameters of the CFD simulation
Table C1. Material parameters in the simulation were thermal dependency was considered.
Table C2. Polynomial fits of the material parameters of the working fluid used for the CFD simulation.
Appendix D. Results of the surface tension measurements
Table D1. The measured surface tension of n-Eicosane from the pendent droplet experiment and the associated density values from literature (VDI-Gesellschaft Citation2005) and temperatures.
Appendix E. Substances considered as possible high temperature working fluids
Table E1. Table of the considered substances for possible high temperature working fluids.