
 ?Mathematical formulae have been encoded as MathML and are displayed in this HTML version using MathJax in order to improve their display. Uncheck the box to turn MathJax off. This feature requires Javascript. Click on a formula to zoom.
Abstract
Significant evaporation of pure aerosols in a Volatility Tandem Differential Mobility Analyzer (V-TDMA) creates two Condensation Particle Counter (CPC) response peaks. Two hypotheses for the observed peaks have been proposed: the existence of two phases or the separation of the singly charged experimental size distribution from the remaining experimental size distributions with charges greater than 1 (charge separation). To explore this observation, we atomized pure levoglucosan aerosol and evaporated the aerosol until two peaks formed. We used an additional classifier and neutralizer to select particles from each of the two peaks and assessed the number of charges on the particles. The smaller diameter peak contained singly charged particles, and the larger diameter peak contained the remaining charges. The charge separation hypothesis alone accounts for the two-peak observations. We used a new V-TDMA model named TAO and show that charge separation should occur in other pure components as well. The TAO model was then used to display the impact of different DMA transfer functions, different inlet size distributions, and different oven residence time distributions (RTDs) on the CPC response. Large errors are possible when direct measurement of the RTD is not performed or when wide RTDs are used. We recommend use of narrow transfer functions with narrow RTDs to detect charge separation. When the singly charged CPC response is isolated (smaller diameter peak in the two peak response), accurate estimations of vapor pressure can be recovered, assuming accurate values for gas phase diffusivity, surface energy, particle density, etc. are used.
Copyright © 2020 American Association for Aerosol Research
EDITOR:
Introduction
A Tandem Differential Mobility Analyzer (TDMA) selects a set of monodisperse particle size distributions from an existing polydisperse inlet size distribution, performs an experiment that may alter the particle sizes, and then measures the final particle size distribution with a second scanning Differential Mobility Analyzer (DMA2) and Condensation Particle Counter (CPC) (Rader and McMurry Citation1986). TDMA experiments include hygroscopicity (Liu et al. Citation1978), chemical reactivity (McMurry et al. Citation1983), and volatility (Rader et al. Citation1987). In a Volatility-TDMA (V-TDMA), the selected particles pass through an evaporation oven, and a portion of the particle mass is evaporated (Bilde et al. Citation2015). The peak of the inverted DMA2-CPC response is associated with the final diameter, and this final measured diameter can be related to the vapor pressure of the investigated compound (Tao and McMurry Citation1989). By increasing the temperature of the oven and further evaporating the aerosol, the relationship between oven temperature and vapor pressure is investigated. This relationship allows the calculation of the phase change enthalpy (Saleh et al. Citation2008; Tester and Modell Citation1997). However, kinetic evaporation of a significant amount of the aerosol creates responses that complicate vapor pressure interpretation.
It will be critical to the following discussion to first define several terms used throughout this study. The inlet size distribution will be defined as the neutralized size distribution entering the first Differential Mobility Analyzer (DMA1). This size distribution will be assumed log-normal throughout. The particles exiting DMA1 will be called the selected size distributions. The selected size distributions are a set of size distributions, and each size distribution within the set is associated with a charge. We restrict our investigation to only the first three positive charges (+1, +2, +3). The experimental size distributions are a set of size distributions exiting the oven, and each size distribution within the set is again associated with a positive charge. To identify a size distribution within a set, we use the adverbs singly, doubly, or triply charged. Each of these adverbs are associated with one of the previously mentioned positive charges. When speaking of the total population in a size distribution, we use the term population. The CPC response results from scanning DMA2 and counting particles with the CPC. This CPC response will be expressed as the number of particles per cubic centimeter as a function of DMA2 mobility. Readers must remember that the CPC does not recognize the number of charges on each counted particle. So, the CPC response is a superposition of all charges (+1, +2, +3) present, and inverting this total CPC response calculates the superposition of all size distributions entering DMA2: the experimental size distributions. Since the inverted CPC response (and the CPC response itself) is a superposition, the CPC response and its inversion can be associated with an individual experimental size distribution. Thus, “singly”, “doubly”, and “triply” charged can also be applied to the CPC response and its inversion. Additionally, we define peak as the diameter where the first derivative is equal to zero (local maximum). Ideal TDMA responses contain two inflection points (second derivative equal to zero) and one peak. A TDMA response that contains a shoulder has 4 inflection points and one peak. The peak and shoulder definitions can be applied to any CPC response or size distribution (superposition or individual). These definitions are shown graphically in the online supplementary information (SI) S1.
Continuing with the discussion, significant evaporation of pure component aerosols creates a CPC response with multiple peaks. For example, Emanuelsson et al. (Citation2016) evaporated 110 nm meso-erythritol particles at a temperature of 25 °C. At an oven residence time of 39 s, the inverted CPC response contained two separate peaks: a peak at 54 nm and a second peak at 94 nm. The reported 54 nm peak is 12% of the original volume, and the 94 nm peak is 62%, assuming the particles are spherical and singly charged. The presence of two peaks complicates calculation of a single vapor pressure from the pure meso-erythritol and provides the appearance of two disparate vapor pressures.
This two peak CPC response has been explained either as two particle phases or as the separation of the singly charged experimental size distribution from the remaining experimental size distributions. Koponen et al. (Citation2007) reported responses with shoulders while evaporating malonic, succinic, and glutaric acids but did not report two peaks. The shoulder occurred when the particles dropped below 50 nm. Chattopadhyay and Ziemann (Citation2005) reported CPC responses with shoulders for glutaric and azelaic acids, and pimelic acid exhibited two peaks. The authors attributed the cause to more than one type of crystal structure present. Salo et al. (Citation2010) reported a two-peak CPC response for pimelic acid, but the authors did not report a shoulder or multiple peaks for succinic, glutaric, adipic, suberic, or azelaic acids. The authors attribute the two peaks to a co-existing amorphous phase and a crystalline phase. Emanuelsson et al. (Citation2016) reiterated the possibility of multiple phases from the evaporation of meso-erythritol and proposed the co-existence of subcooled liquid and crystalline particles. In contrast, Petters (Citation2018) modeled the CPC response and showed that the singly charged experimental size distribution separated from the remaining experimental size distributions. Although not a heated experiment, Wright et al. (Citation2016) also showed that the two peak CPC response could occur during evaporation. In this document, the two hypotheses are referred to as the multiple phase hypothesis and the charge separation hypothesis.
The multiple phase hypothesis assumes each of the two peaks represents a set of particles of a different phase, each phase with a different phase change enthalpy. Vapor pressure can be expressed as a function of enthalpy and oven temperature through the Clausius–Clapeyron equation. The hypothesis states that the vapor pressure at the beginning of evaporation appears to be the same between the two proposed phases, and the CPC response contains a single peak. This single peak is used to calculate the vapor pressure for both phases. After significant evaporation, the two peaks in the inverted CPC response are used to calculate two vapor pressures. When the logarithms of the vapor pressures are plotted as a function of inverse absolute temperature, two different linear curve fits are possible. The slopes from the curve fits relate to the phase change enthalpies, one for each peak in the inverted two peak CPC response. If a slight difference in final diameter (vapor pressure) occurs, the small difference between the two phase change enthalpies may resemble a difference in crystal structure. If a large difference in final diameter occurs, the resulting difference in enthalpy may resemble the simultaneous existence of a sub-cooled liquid and crystalline structure. We note that the reported observations from the authors above sometimes differ (e.g., glutaric acid was observed as a shoulder by Koponen et al. (Citation2007) and Chattopadhyay and Ziemann (Citation2005) and observed as a single peak by Salo et al. (Citation2010)).
The charge separation hypothesis by Petters (Citation2018) assumes that the singly charged experimental size distribution separates, by DMA2 mobility, from the other experimental size distributions. The singly charged experimental size distribution defines the smaller (diameter) peak in the CPC response, and the CPC response from the remaining experimental size distributions (charges greater than +1) sum to create the larger (diameter) CPC response peak. As previously mentioned, the CPC response is a plot of the CPC measurement (ordinate) as a function of singly charged diameter (abscissa). The CPC response is a superposition of all charges, and the singly charged diameter is the DMA2 mobility converted to diameter assuming a singly charged, spherical particle. Thus, for the singly charged experimental size distribution to separate from the remaining experimental size distributions, the singly charged experimental size distribution mobility must increase faster than the mobility of the remaining experimental size distributions, during evaporation. The evaporation model used by Petters (Citation2018) included gas phase diffusivity, the transition regime correction factor (which includes mass accommodation), and vapor pressure but did not investigate the impact of the Kelvin effect or the oven residence time distribution. We note that the word separate only has meaning when the abscissa is expressed as DMA2 mobility or expressed as DMA2 diameter assuming the particles are spherical and singly charged. The experimental size distribution and the CPC response can both be expressed in terms of DMA2 mobility, and therefore, use of the word separate when referring to either implies that the abscissa is DMA2 mobility or DMA2 diameter assuming the particles are spherical and singly charged.
In this study, we investigated the two peak CPC response using atomized pure levoglucosan. Two different experimental approaches were available: directly test the multiple phase hypothesis or directly test the charge separation hypothesis. Like Wright et al. (Citation2016), we chose to directly test the charge separation hypothesis, and this decision does not disprove or exclude future occurrences of the multiple phase hypothesis. However, the charge separation hypothesis explains all the two-peak observations from the evaporation of levoglucosan. Additionally, we used a new model named TAO to help explain the laboratory observations. This model includes the Kelvin effect and the oven residence time distribution in addition to all variables included in Petters (Citation2018). The mathematics in the new model are used to compare the relative contributions of the different variables on the charge separation. We then use the model to demonstrate the process of charge separation and show how V-TDMA settings and design parameters can change the CPC response creating two peak responses and single peak responses from the same oven temperatures.
Description of a new model for TDMA analysis: TAO
TAO models the response recorded by the CPC (#/cm3) as a function of single charge diameter using first principal equations. The user enters the inlet size distribution, the DMA1 and DMA2 settings, the vapor pressure, the gas phase diffusivity, the surface energy, and the mass accommodation to calculate the CPC response. The intermediate size distributions (e.g., selected size distributions, experimental size distributions) are also saved. This model allows users to investigate the impact of different variables (e.g., different DMA settings, different compounds, different oven residence times) on the CPC response. TAO does not invert the CPC response; rather, TAO helps interpret difficult CPC responses by allowing the user to propose different hypothetical situations and compare the results to experimentally measured CPC responses. For this study, TAO is used to explain the experimental CPC responses and to demonstrate the impact of V-TDMA settings on the response recorded by the CPC. A general description of the TAO model follows, and a more detailed description is found in SI S2.
TAO uses a non-diffusing transfer function (Stolzenburg and McMurry Citation2008) and assumes the inlet size distribution is log-normal (Friedlander Citation2000). The user enters the parameters defining the log-normal size distribution and parameters defining the non-diffusing transfer function. The Cunningham correction factor is calculated using the expression from Kim et al. (Citation2005), and the viscosity of air is calculated using the expression from Allen and Raabe (Citation1985). The charging fraction is assumed to adhere to Wiedensohler (Citation1988) with constants from Baron (Citation2005). The mean free path is calculated using expressions from Kim et al. (Citation2005). By multiplying the non-diffusing transfer function by the inlet size distribution and charging fraction, the DMA1 subroutine calculates the selected size distributions exiting DMA1.
TAO models the evaporation of all particles using the expression from Bilde et al. (Citation2003). The selected size distributions calculated by the DMA1 subroutine are passed to the evaporation subroutine. Gas phase diffusivities are entered by the user, and in this study, the gas phase diffusivities are calculated using expressions from Bird et al. (Citation2002) and parameters obtained from Oxford et al. (Citation2019). The residence time in the oven is modeled as a distribution of residence times, an array of times and number fractions. The residence time distribution in the oven (described below in the equipment section) was measured using the experiment described in SI S3. The temperature in the oven is assumed to be one value throughout all residence times: the experimental set point.
The DMA2 subroutine integrates the resulting product of the DMA2 non-diffusing transfer function multiplied by the experimental size distributions calculated by the evaporation subroutine. The DMA2 subroutine uses the same methods as the DMA1 subroutine but uses the parameters for DMA2. The output from the DMA2 subroutine is the CPC response as a function of single charge diameter at DMA2. As will be seen in the next section, an extra classifier and neutralizer were inserted into the V-TDMA (see ). The extra classifier is modeled again as a non-diffusing transfer function (Stolzenburg and McMurry Citation2008), and the additional neutralizer is again modeled using relations from Wiedensohler (Citation1988) and coefficients from Baron (Citation2005). The experimental size distributions exiting the oven are multiplied by the extra classifier transfer function and the charge distribution prior to DMA2 integration.
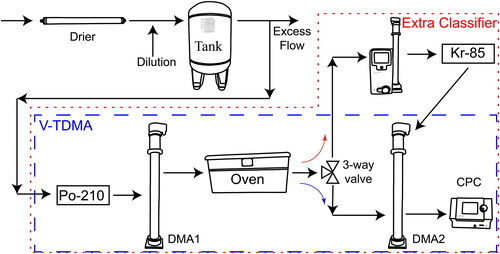
Figure 1. The experimental apparatus used to test the charge separation hypothesis. The V-TDMA mode (blue dashed) confirms the presence of the bimodal volatility response. The extra classifier mode (red dotted) selects a portion of the bimodal response, re-neutralizes the classified particles, and uses DMA2 and the CPC to confirm the number of charges on the selected particles.
Apparatus and experiment
The V-TDMA used in this study has been previously described (Oxford et al. Citation2019), and we briefly outline how it is used here to investigate the evaporation of pure levoglucosan aerosol. We mixed 0.1 g of levoglucosan (Sigma-Aldrich 316555) with 100 ml of 18 MΩ deionized water. We placed this mixture into a custom atomizer and set the supply air pressure to 30 psi. The atomizer (not shown) emitted levoglucosan aerosol into a diffusion drier, and the flow was then diluted with filtered, clean dry air as shown in . We used a flow control valve on the dilution line (not shown) to set the excess flow rate to 16 LPM. The diluted aerosol entered a 75.5 L equilibration tank to equilibrate the aerosol with the gas phase. The mean residence time in the tank was 4.3 min. The characteristic water equilibration time for a wet levoglucosan particle was estimated to be approximately 8 s, assuming the particle phase was amorphous and particle phase diffusion was limiting. The characteristic equilibration time for levoglucosan in air was estimated to be 1 ns assuming gas phase diffusion. Thus, both characteristic times were much shorter than the mean residence time in the tank.
A portion of the equilibrated aerosol flow exiting the tank (1.5 LPM) supplied the V-TDMA while the excess flow was vented to a hood through a HEPA filter. The equilibrated flow exiting the tank had a relative humidity of less than 10%. The aerosol was neutralized using a Particle Technology Laboratory (University of Minnesota) neutralizer case containing two Po-210 strips (NRD 2U500). We set both DMA1 and DMA2 (2 TSI-3081 long DMAs, TSI, Inc., Shoreview, MN, USA) to a sheath flow rate of 15 LPM. The oven consisted of a 15.25 m coil of 0.95 cm thin wall copper tubing suspended in a 0.25 m3 heated oven. The oven temperature was set to 35 °C to obtain the two-peak CPC response from levoglucosan. We installed a manual three-way ball valve in the V-TDMA, after the oven, to select either normal V-TDMA operation (indicated by blue dashed line in ) or the extra classifier mode (indicated by red dotted line in ). When in V-TDMA mode, the flow exiting the oven passed directly to DMA2 and the CPC. When in extra classifier mode, the flow exiting the oven passed through an extra classifier (TSI-3080), which operated with a sheath flow rate of 6 LPM. The classifier set point was either 47 nm or 78 nm to select either of the two CPC response peaks. Once classified by the extra classifier, the additional Kr-85 neutralizer (TSI-3077) re-neutralized the aerosol. The re-neutralization process significantly reduced the number of particles detected by the CPC, so we increased the scan time of the instrument to 20 min in response to the reduced number of particles.
Experimental results
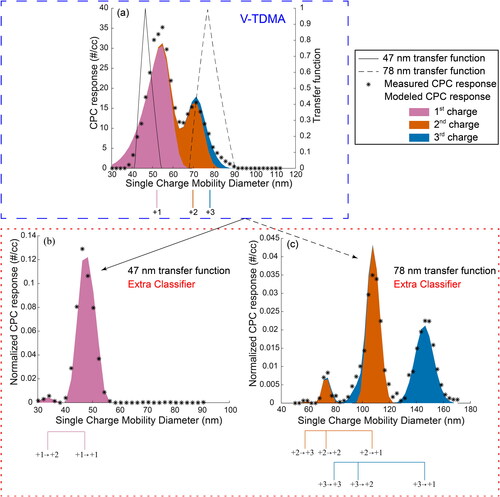
We set the DMA1 diameter to 90 nm and successively increased the oven temperature until we obtained the two peak CPC response from levoglucosan, as shown in panel (a). The lower peak was located at 55 nm while the upper peak was located at 72 nm. With the locations of the two peaks known, we then turned the ball valve to extra classifier mode. We used two different extra classifier set points, 47 nm or 78 nm, to select one of the two existing peaks as shown in panel (a). At this point we define the set of size distributions exiting the extra classifier as the extra classifier size distributions. This set of size distributions contains the individual size distributions associated with the positive charges mentioned above.
Figure 2. Measured CPC responses for the evaporation of levoglucosan are compared to model results, which represent the charge separation hypothesis. Panel (a) shows the CPC response from the V-TDMA mode, while panels (b) and (c) show the resulting CPC response when the extra classifier is included in the experimental set-up using set points of 47 nm and 78 nm, respectively. The peaks of the populations with different charges (post-Po-210 neutralizer → post-Kr-85 neutralizer) are indicated below the abscissa.
Without re-neutralization or further evaporation, the individual extra classifier size distributions would not change in mobility. The CPC response, derived from scanning DMA2 under these conditions, would have a single peak at the extra classifier set point. Inserting the Kr-85 neutralizer after the extra classifier alters the charges on the extra classifier size distributions and thus alters the DMA2 mobility. This change in charge creates many more size distributions. We identify these re-neutralized size distributions in words using the previously mentioned charge number adverbs followed by the words “extra classifier size distribution re-neutralized to” and then by the specific charge (e.g., doubly charged extra classifier size distribution re-neutralized to a single charge). In , this phrase is identified symbolically by the original extra classifier charge followed by an arrow followed by the re-neutralized charge (e.g., +2→+1). When an extra classifier size distribution is re-neutralized to a single charge, the single charge mobility diameter associated with the CPC response is correct. For example, the doubly charged extra classifier size distribution, when the extra classifier centroid is 47 nm, would be re-neutralized to be mostly singly charged. DMA2 would correctly measure the single charge mobility diameter of this re-neutralized extra classifier size distribution as 68 nm. Unfortunately, the re-neutralized extra classifier size distributions will still contain charges greater than 1. However, the reader should understand that the charging function favors singly charged particles at this size. Thus, the primary peaks measured by DMA2 and the CPC will be the extra classifier size distributions re-neutralized to a single charge.
TAO reproduced the charge separation hypothesis as previously observed by the Petters (Citation2018) model: the singly charged experimental size distribution is associated with the lower (diameter) CPC response peak and the remaining experimental size distributions create the larger (diameter) CPC response peak. The color shaded areas display the modeled CPC responses from TAO. No particle loss function exists in TAO, and the model CPC response in panel (a) has been altered to have the same area under the curve as the measured CPC response. panels (b) and (c) are normalized using the area under the measured CPC response curve from panel (a). This normalization process retains the shape of the modeled CPC responses and adjusts for the lack of a particle loss function. If the charge separation hypothesis is correct, the measured CPC response (black asterisks) should match the modeled response from the TAO model.
When the extra classifier was set to 47 nm, two peaks in the CPC response were observed: a large peak at the extra classifier set point of 47 nm and a second smaller peak at approximately 33 nm, as shown in panel (b). The 47 nm peak corresponds to the singly charged extra classifier size distribution re-neutralized to a single charge. The 33 nm CPC response peak corresponds with the singly charged extra classifier size distribution re-neutralized to two charges. The charge separation hypothesis, as modeled by TAO, explains all observations.
If the multiple phase hypothesis were true, all three charges (+1, +2, and +3) would be present in the lower CPC response peak. If doubly charged particles were present in the 55 nm CPC peak from panel (a), they would also be present in the extra classifier size distributions, and these doubly charged particles would be re-neutralized to mostly a single charge. A doubly charged particle at 47 nm would create a peak at 68 nm after re-neutralization. A very small amount of noise was present around 68 nm, but nothing quantitative was measured. If the multiple phase hypothesis were true, the measured CPC response in panel (b) should include a measurable peak at 68 nm (+2) and 85 nm (+3). The measured CPC response shows that only singly charged particles exist in the smaller 55 nm CPC response peak shown in panel (a).
All peaks in panel (c), the 78 nm extra classifier setpoint, are explained by the TAO model. For the third charge, the largest peak from the CPC response corresponds to 148 nm. This peak corresponds to a triply charged extra classifier size distribution that was re-neutralized to a single charge. TAO’s 3rd charge extra classifier prediction, re-neutralized to a single charge, is similar and shifted slightly to the smaller diameter of 146 nm. The doubly charged extra classifier size distribution, re-neutralized to a single charge, should appear at 116 nm. The measured and the modeled CPC response both peak at 108 nm. The discrepancy is caused by the off-centroid doubly charged experimental size distribution in panel (a). The centroid of the extra classifier is 78 nm, and the peak of the doubly charged CPC response is 70 nm. The doubly charged experimental size distribution, which is centered on the +2 line, exists only on the left side of the 78 nm extra classifier transfer function. This off-centroid doubly charged experimental size distribution shifts the re-neutralized doubly charged extra classifier size distribution (and the corresponding CPC response) to smaller diameters. A third peak appears at 73 nm creating the impression of a singly charged extra classifier size distribution re-neutralized to a single charge. However, the 73 nm peak is shifted left of the extra classifier set point of 78 nm. Like the doubly charged extra classifier size distribution re-neutralized to a single charge, the CPC response, from the doubly charged extra classifier size distribution re-neutralized to two charges, is shifted left of the 78 nm extra classifier centroid. The cause of the shift to smaller diameters is again the off-centroid doubly charged extra classifier size distribution. The charge separation hypothesis explains all observations.
If the multiple phase hypothesis were true, the larger (diameter) CPC response peak should contain singly charged particles. The singly charged particles should be present in greater amounts than the doubly and triply charge particles, due to the charging function. In panel (c), the peak at 73 nm is much smaller in population than either the doubly charged peak (108 nm) or the triply charged peak (146 nm). The measured CPC response suggests the absence of singly charged particles. Panel (c) demonstrates that the larger 72 nm peak in panel (a) does not contain singly charged particles.
The measured CPC response from the extra classifier mode confirms that the smaller 55 nm mode in panel (a) contains singly charged particles and the larger 72 nm mode contains the doubly and triply charged particles. Experimental size distributions of particles having charges greater than 3 should also be in the second peak and in the 83 nm area of the panel (a) plot. TAO, like the Petters (Citation2018) model, predicted the charge separation. Additionally, the TAO model predicted the outcome of the extra classifier CPC responses. From the measured CPC responses, we conclude that the hypothesis presented by Petters (Citation2018) is correct: the two peak CPC response, derived from significant evaporation of levoglucosan, is created by the separation of the singly charged experimental size distribution from the remaining experimental size distributions. The next section will determine whether charge separation occurs in other pure component aerosol measurements, not just levoglucosan.
Cause of charge separation
The cause of charge separation, following significant particle evaporation, is multifaceted and includes: the particle diameters, the Kelvin effect, the transition regime correction factors, and the differing mobilities between the experimental size distributions. The two-peak CPC response in panel (a) is not unique to levoglucosan. We have recorded this two-peak response in a variety of pure component aerosols including levoglucosan, all dicarboxylicacids between malonic acid and azelaic acid, caffeine, and oleic acid. To show that the multiple peak response is a consequence of the evaporation method rather than the compound investigated, we will use the underlying mathematics from TAO to display the reasons for charge separation.
Although we plot the x-axis as diameter in panel (a), the x-axis is derived from DMA2 mobility. DMAs do not directly select or measure particles by diameter; they select by mobility. EquationEquation (1)(1)
(1) displays the equation for mobility (Hinds Citation1999). In EquationEquation (1)
(1)
(1) , Zj is the electrical mobility of a particle, j is the number of charges, e is the charge of an electron, C(Dp) is the Cunningham correction factor as a function of particle size, μ is the viscosity of air, and Dp is the diameter of an assumed spherical particle. For a single DMA mobility, a set of diameters, as a function of charge, transit the DMA. For the singly charged experimental size distribution to separate from the remaining experimental size distributions during evaporation, each experimental size distribution (+1, +2, +3) must move unequally along the x-axis, which is mobility (not diameter) space. We define single charge diameter space as the diameter of the particle assuming the particle is spherical and has a single charge. We will use single charge diameter space, as is usually assumed, as the x-axis in further plots. The reader must recognize that a multiply charged particle does not have the diameter shown on the x-axis.
(1)
(1)
EquationEquation (2)
(2)
(2) enables the calculation of the particle evaporation rate and is used in conjunction with EquationEquation (1)
(1)
(1) . In EquationEquation (2)
(2)
(2) , Dp is particle diameter, t’ is time, Di,air is the gas phase diffusivity of the component i in air, Mi is the molecular weight, ρi is the aerosol particle density, R is the gas constant, T is the evaporation temperature, F is the transition regime correction factor (Fuchs and Sutugin Citation1971) as a function of Knudsen number (Kni) and accommodation coefficient (αi), P* is the vapor pressure, and σi is the surface tension of component i. The following variables are set for levoglucosan (C6H10O5): the molecular weight is 162.1 g/mole, the surface energy was assumed to be 0.022 N/m (Topping et al. Citation2007), the density was assumed to be 1.64 g/cm3 (Koehler et al. Citation2006), and the accommodation coefficient was assumed to be unity. The diffusivity of levoglucosan in air was calculated using Chapman–Enskog kinetic theory (Bird et al. Citation2002) and is estimated to be 7.05 × 10⁻⁶ m2/s at 36 °C (Oxford et al. Citation2019). To show the relative evaporation rate in single charge diameter space, an expression for the ratio of the rate of change in diameter of the singly charged particles to the greater charges (>1) must be developed.
(2)
(2)
To develop an expression for the relative evaporation rate in single charge diameter space, we divide the singly charged version of EquationEquation (2)
(2)
(2) by the doubly charged version. To convert doubly charged particle diameter to single charge diameter space, we equate the singly and doubly charged versions of EquationEquation (1)
(1)
(1) and take the implicit derivative with respect to diameter. The result of the differentiation is used to convert the doubly charged version of EquationEquation (2)
(2)
(2) to single charge diameter space. The final form of the derivation is shown as EquationEquation (3)
(3)
(3) . See SI S4 for the complete form, derivation, and discussion of EquationEquation (3)
(3)
(3) . In EquationEquation (3)
(3)
(3) , the subscript 1 represents the singly charged particles, the subscript 2 represents the doubly charged particles, and the subscript 2-1 represents the doubly charged particle diameter mapped to the equivalent single charge diameter space. The change in diameter in single charge diameter space is expressed as the product of four ratios.
(3)
(3)
The change in diameter of a singly charged particle in single charge diameter space relative to a higher charge (second charge shown) is the ratio of the diameters (α ratio), the Kelvin effects (β ratio), the transition corrections (γ ratio), and the doubly charged change in diameter divided by the doubly charged change in diameter in single charge diameter space (δ ratio). The diffusivity, molecular weight, density, gas constant, vapor pressure, and temperature from EquationEquation (2)
(2)
(2) cancel. For a single component aerosol i, the molecular weight, surface tension, density, and mean free path used to calculate Knudsen number and accommodation coefficient impact both the numerator and denominator. In further calculations, we assume that the accommodation coefficient is not only unity but is also not a function of diameter. The β ratio, expressed above as the ratio of Kelvin effects, can also be expressed as the ratio of exponential of the inverse diameters raised to the power of the constant component specific variables: surface tension, molecular weight, and density. Therefore, the β ratio is really driven by the ratio of the exponential of the inverse of the diameters. See SI S4.
For a pure component aerosol measured in single charge diameter space, the singly charged particles shrink faster than the doubly charged particles, which in turn shrink faster than the triply charged particles. If we assume a 90 nm aerosol particle of levoglucosan, the value for each ratio at the beginning of evaporation is shown in EquationEquation (4)(4)
(4) . All ratios but the transition regime correction factor, the γ ratio, are greater than 1. If the γ ratio is multiplied by the ratio of the diameters, the α ratio, the product is greater than 1 and approaches a value of 1 as the diameter approaches 0 nm. Therefore, this product is always greater than 1, even for low mass accommodation. The remaining two ratios, the β ratio and the δ ratio, are both always greater than 1 for pure components and ensure a final evaporation ratio greater than 1. For a 90 nm aerosol particle of levoglucosan, the singly charged particles evaporates 1.79 times faster than the doubly charged particles in single charge diameter space. The increased evaporation ensures the singly charged particles separate from the remaining charges. If we extend our investigation to include the triply charged particles, the doubly charged particles evaporate 1.48 times faster than the triply charged particles in single charge diameter space. Thus, the singly charged particles evaporate 2.66 times faster than the triply charged particles in single charge diameter space, and the singly charged particles always separate first from the remaining (for pure components). If we were to continue to evaporate the particles measured in panel (a), the singly charged CPC response will fully separate from the remaining CPC response, and the doubly charged CPC response would eventually separate from the CPC response for charges greater than 2. Therefore, multiple peaks are possible when evaporating pure components.
(4)
(4)
Compound specific variables (like surface tension, Knudsen number, and accommodation-) impact both the numerator and the denominator of EquationEquation (3)
(3)
(3) , limiting influence on charge separation. To determine the dependency of the separation of charges on compound specific variables, we explore an example comparing particles of levoglucosan, malonic acid, and oleic acid. The component variables used are shown in Table S1. The use of these example compounds creates large variations in compound specific variables (factor of 2 in particle density; factor of 10 in surface tension; factor of 2 in molecular weight; and factor of 2 in diffusivity), are representative of the phenomena, and are not comprehensive. To simplify the comparison, only the ratio of the change in diameter of the singly charged particles to the doubly charged particles is evaluated (EquationEquation (3)
(3)
(3) ). Two ratios are changed by compound specific components: the ratio of the Kelvin effects and the ratio of the transition correction factors. When comparing the value of the transition correction factor ratio, the values for both malonic acid and oleic acid are higher than levoglucosan over the evaluated range of 5 nm to 500 nm. The maximum increase in transition correction factor ratio (the γ ratio) for oleic acid is +3.2% and occurs at 200 nm. This increase represents the maximum deviation from levoglucosan for both components over the evaluated range. This difference, caused by the change in component, is small compared to the 20% change in transition correction factor ratio caused by the particle diameter over the same range (for a related discussion see SI S5 and Figure S10). Therefore, the γ ratio is a stronger function of particle diameter than pure component composition. The compositional impact on the Kelvin effect ratio is different. As the particle size approaches zero, the Kelvin effect ratio increases exponentially. The exponent in the Kelvin effect ratio contains the component specific variables. The exponent strengthens the existing diameter dependency in the Kelvin effect ratio enabling charge separation. Interestingly, if the Kelvin effects were neglected, the charges would still separate, as shown by Petters (Citation2018). Therefore, the Kelvin effect does not inhibit separation. In summary, the α ratio and the δ ratio are not functions of compound tested, and the γ ratio is a stronger function of diameter than compound. In contrast, compound identity does have a large effect on the β ratio, and this impact is limited to small diameters and augments the separation of the particles. For further discussion on the behavior of these ratios see SI S5.
Therefore, the singly charged experimental size distribution will separate from the remaining experimental size distributions first, regardless of the pure component aerosol tested. Multiple phases are still possible, but the reason for the peaks observed in the diacids experiments are explained by charge separation alone, not multiple phases. If multiple phases occurred during the evaporation of pure component aerosols, an increase in observed peaks would occur. The peak representing the singly charged particles would separate into two peaks, and the 72 nm peak in panel (a) may exhibit multiple peaks as well. We observed no more than two peaks in the CPC response during the evaporation of levoglucosan, all dicarboxylicacids between malonic acid and azelaic acid, caffeine, and oleic acid. Some experiments resulted in a single CPC response peak or shoulder in contrast to the two CPC response peaks shown above. To explain these different shapes, we investigate V-TDMA specific settings in the next section.
Process of charge separation
The shape of the CPC response is defined by the DMA transfer function widths, the DMA1 diameter, and the number populations in the sampled size distributions, as shown in . We calculated the CPC response in using data from the V-TDMA and the TAO model. We used the V-TDMA to determine vapor pressures as a function of temperature using an aerosol-to-sheath ratio of 1:10 and a DMA1 diameter of 90 nm. We then fit the Clausius–Clapeyron equation to this vapor pressure and temperature data for levoglucosan. This curve fit was then used as an input to the TAO model to develop the different hypothetical situations in . In panel (a), the shape and progression of the CPC response with increasing oven temperature is easily seen. At 21.5 °C, a small amount of the 90 nm particles evaporates. Increasing the temperature to 28 °C evaporates the particles further while the peak of the CPC response drops, and the response widens. At 32 °C, the singly charged experimental size distribution is beginning to separate from the remaining experimental size distributions, and a shoulder forms. This results in a wide single peaked curve. At 34 °C, two distinct peaks are observed. The singly charged experimental size distribution constitutes the peak on the left while the remaining experimental size distributions are on the right. At 38 °C, the singly charged experimental size distribution is nearly separated from the remaining experimental size distributions, and a shoulder forms on the larger (diameter) peak. The doubly charged experimental size distribution is in the process of separating from the experimental size distributions with charges greater than two. For our instrument, the shape of the CPC response in panel (a) changes from a single peak (21.5 °C), to a shoulder (32 °C), and then to two distinct peaks (34 °C). In panels (b) and (c), the same progression occurs, but the shape of the progression and the temperature at which charge separation occurs is different.
Figure 3. Panel (a): The modeled CPC response from the progressive evaporation of levoglucosan using an aerosol-to-sheath ratio of 1:10, a DMA1 set point of 90 nm, and the first size distribution (Sz Dist 1). Panel (b): The modeled CPC response using an aerosol-to-sheath ratio of 1:10, a DMA1 set point of 200 nm, and the first size distribution. Panel (c): The modeled CPC response using an aerosol-to-sheath ratio of 1:4, a DMA1 set point of 90 nm, and the first size distribution. Panel (d): The modeled CPC response using an aerosol-to-sheath ratio of 1:4, a DMA1 setpoint of 90 nm, and the second size distribution (Sz Dist 2).
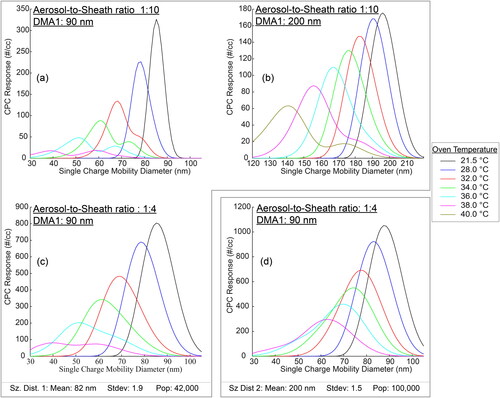
Changing the DMA transfer functions affects the shape of the CPC response (though not the extent of evaporation), since wider transfer functions have less resolving power to distinguish multiple peaks. For the same aerosol population and DMA1 setpoint diameter, the shape of the CPC response can differ based on the user’s choice of wider transfer functions ( panel (c), 1:4 aerosol-to-sheath flowrate ratio) or narrower transfer functions ( panel (a), 1:10 aerosol-to-sheath flowrate ratio). For example, at 34 °C, two peaks are observed when using a narrower transfer function, while one peak is observed with a wider transfer function. Similarly, widening the transfer functions can also change a shoulder to a single peak (32 °C) or change a two peak CPC response to a shoulder (36 °C). Although the overall CPC response peaks may slightly change location, the location of the experimental size distributions remain unchanged when widening the DMA transfer functions (38 °C).
Increasing the DMA1 diameter (from 90 nm to 200 nm) also reduces the DMA2 resolution since the transfer function is wider at larger diameters. ( panel (a) (36 °C) and panel (b) (36 °C)). To reproduce the two-peak response in the overall DMA2 size distribution, the width of the base of the DMA2 transfer function should be narrower in diameter than the distance between the two peaks being measured. In panel (a) (36 °C), two peaks are detected, because the distance between the two peaks in panel (a) (16 nm) is greater than the width of the base of the DMA2 transfer function at 90 nm (11 nm). For panel (b) (36 °C), the two peaks are unresolved because the width between the two peaks (18 nm) is smaller than the width of the base of the transfer function at 200 nm (26 nm). Therefore, selection of a 200 nm particle reduces resolution inhibiting detection of charge separation in the CPC response. As previously discussed for panel (c), DMA resolution was reduced by decreasing the aerosol-to-sheath ratio to 1:4. Interestingly, the width of the base of that transfer function (at 90 nm) is nearly equal to the width of the base of the 200 nm transfer function in panel (b). Thus, the root cause of the smoothed shape of the responses in panels (b) and (c) is the same, though different instrument settings are changing in the two cases (diameter in (b), aerosol-to-sheath ratio in (c)).
In order to understand panel (d), we must first understand the role the inlet size distribution has on the CPC response. The populations of the sampled size distributions exiting DMA1 define the populations of the experimental size distributions and the peak heights in the CPC responses seen in . Two variables contribute to the population exiting DMA1 at any diameter: the charging fraction and the inlet size distribution. We explore those variables here by developing a relationship between the singly charged selected size distribution and the doubly charged selected size distribution. We divide the singly charged selected size distribution, defined by Equation (S2), by the doubly charged selected size distribution, also defined by Equation (S2). Both equations are evaluated at the centroid of the DMA1 transfer function. The final developed equality is shown as EquationEquation (5)(5)
(5) . As in Equation (S2), the size distribution is again dN/dDp, the DMA transfer function is Ω, and the fraction charged is η. However, in EquationEquation (5)
(5)
(5) , the subscript DMA1 represents the selected size distribution exiting DMA1, and the subscript SD represents the inlet size distribution entering DMA1. The subscript 1c and 2c represent the value at the first and second charge transfer function centroids, respectively. At the centroid, the value of the transfer function (Ω) is equal for both charges and is removed. The ratio of the fraction charged is a function of neutralizer age, neutralizer design and material, and aerosol flow rate (Jiang et al. Citation2014). We assume an equilibrium charge distribution defined by Wiedensohler (Citation1988) throughout. By considering different inlet size distributions, we can evaluate the impact on the selected size distribution (and thus the experimental size distribution). Since the DMA1 set point in panels (c) and (d) is the same, these two panels will be compared. The ratio of the fraction charged for the two panels is the same and comparing these two panels displays the role of the inlet size distribution.
(5)
(5)
When the left side of EquationEquation (5)
(5)
(5) is much greater than 1, the sampled size distribution, at the centroid, is primarily singly charged. For a multi-charged scenario, the left side of EquationEquation (5)
(5)
(5) must be near 1 or less, and for this to occur, the inlet size distribution fraction must be reduced to less than 1, assuming a constant fraction charged. This reduction occurs when the value of the inlet size distribution at the doubly charged centroid is larger than the value at the singly charged centroid. For example, if the peak (maximum) of the inlet size distribution occurs at the doubly charged centroid, the population at all other centroids (singly, triply) would be less than the population at the maximum. In this case, the inlet size distribution ratio is less than 1. This can only occur when the DMA1 set point (singly charged centroid) is smaller (diameter) than the diameter associated with the peak of the inlet size distribution. When this multicharged scenario occurs, the relative contribution of the singly charged experimental size distribution to the overall CPC response is reduced. In panel (d), the CPC response peak, from the singly charged experimental size distribution, is equal to or smaller in concentration than the CPC response peak from the doubly charged experimental size distribution. The 90 nm DMA1 set point is smaller (diameter) than the peak of the inlet size distribution; and 41% of the selected population is singly charged, 43% of the selected population is doubly charged, and 16% of the selected population is triply charged. By contrast in panel (c), the DMA1 set point is larger than the peak of the log-normal size distribution (90 nm > 82 nm). Under those conditions, 82% of the selected population is singly charged. These situations are reproduced graphically in SI S6.
When wide transfer functions are used with multicharged populations, significant changes in the shape and the peak of the CPC response can occur. Panel (c) and panel (d) both use wide transfer functions; but the experimental population in panel (c) is mostly singly charged, and the experimental population in panel (d) is multiply charged. After significant evaporation (panel (d)), the singly charged CPC response becomes significantly wider with a shorter peak. When this shorter peak combines with the significant doubly and triply charged CPC response, the superposition creates a more symmetrical CPC response. This symmetry significantly changes the peak location, and this peak is closer to the peak of the doubly charged experimental size distribution. In panel (c), the smaller (diameter) 38 °C peak occurs at 40 nm, and the singly charged CPC response in panel (d) is in a similar location. The 38 °C peak in panel (d) more closely aligns with the larger (diameter) peak in panel (c). If the peak of the inverted CPC response in panel (d) is used, significant errors in vapor pressure occur. Lastly, if the aerosol-to-sheath ratio were reduced for panel (d), the previously mentioned progression (panels (a) through (c)) would be seen. However, the smaller (diameter) CPC response peak associated with the singly charged experimental size distribution would appear first as a shoulder on the left side of the CPC response for experimental size distributions with charges greater than 1. Further evaporation would separate the singly charged CPC response from the remaining, and this smaller (diameter) CPC response peak would be shorter than the larger (diameter) CPC response peak associated with charges greater than 1.
We see from these hypothetical situations above that the progression of evaporation goes from a single peak, to a single peak with a shoulder, to two separate peaks. By changing the width of the DMA transfer functions, the progression changes. This change in DMA transfer function width can create a very different response (single peak versus two separate peaks) from the same oven temperature set point. Since the peaks in panel (d) do not correspond to the peak of the singly charged experimental size distribution, calculated vapor pressures may be incorrect. We will explore this further, but first cover additional errors caused by the residence time distribution.
Role of the residence time distribution
The residence time in the oven contributes to the final evaporated diameter. Due to velocity profiles in tubing, evaporation ovens do not have a single residence time, but a set of residence times. We define the set of residence times as the Residence Time Distribution (RTD). A very narrow (time) set of residence times yields narrow and tall CPC responses while a wide RTD yields wide and short CPC responses. In both cases, asymmetries in the RTD create asymmetrical CPC responses, as seen in panel (a). Changes in flow rate through the heater or changes in heater design alter the RTD and thus the CPC response.
We measured the RTD in our oven, and neither the average residence time nor the calculated residence time, from the tubing diameter and length, correlated with the peak of the CPC response. The correct residence time associated with the peak of the singly charged experimental size distribution is the residence time at the peak of the RTD. Assuming the average residence time correlated with the CPC response generated an error in vapor pressure of 13%, and assuming the calculated residence time correlated with the CPC response generated an error of nearly 30%. This underscores the importance of directly measuring the residence time in the oven and using the residence time corresponding with the peak of the RTD for vapor pressure calculations.
Assuming the peak of the inverted CPC response corresponds with the peak of the RTD may not always hold true. When convoluting the RTD with the DMA1 and DMA2 transfer functions using EquationEquation (2)(2)
(2) , the peak of the CPC response may not correlate with the peak or average time in the RTD. Errors approaching 50% are possible due to convolution. For narrow RTDs, the convolution correlates well with the peak of the residence time distribution, and therefore, it is important to design ovens with narrow RTDs and to use narrow DMA transfer functions. For our oven RTD with a 1:10 aerosol-to-sheath ratio, the expected error is 1%. See SI S7 for details.
Error associated with multi-charged populations
To calculate vapor pressure, V-TDMA users traditionally assume that the inverted CPC response peak, before and after evaporation, is equal to the peak of the singly charged experimental size distribution (Tao and McMurry Citation1989). This assumption is only true when the singly charged experimental size distribution fully separates from the remaining experimental size distributions. To display this error, we use the 28 °C responses from both panel (c) and panel (d). These two peaks are reproduced in . Both responses have a single peak, and the exact location of the singly charged CPC response peak is unable to be determined from an overall measured CPC response alone. We used the TAO model to define the location of the singly charged CPC response under the total modeled response for these two situations.
Figure 4. Modeled CPC responses for the evaporation of levoglucosan at 28 °C is shown for different size distributions (a) mean = 82 nm, standard deviation = 1.9, N = 42,000; (b) mean = 200 nm, standard deviation = 1.5, N = 100,000). In both cases, the aerosol-to-sheath flowrate ratio is 1:4, and the DMA1 setpoint is 90 nm. The peaks for the CPC response as well as the singly charged CPC response are indicated below the abscissa.
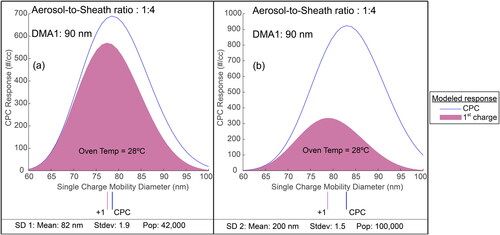
Multi-charged populations will shift the peak of the CPC response toward larger diameters, and use of the total inverted CPC response peak from this multi-charged situation creates error in calculated vapor pressure. In panel (a), the selected size distribution is mostly singly charged; and in panel (b), the selected size distribution is mostly associated with charges greater than 1. The peak of the CPC response in panel (b) is larger (diameter) than the peak in panel (a). We see that the peak of the singly charged CPC response resides on the left side and is in approximately the same location in both panels. After inversion, the difference between the two peaks, in panel (a), is about 1.2 nm, and the total estimated evaporation is about 13 nm. Assuming the inverted CPC response peak is equal to the singly charged inverted CPC response peak results in a vapor pressure error of about 11%. Reducing the aerosol-to-sheath ratio in both DMA1 and DMA2 to 1:10 reduces the error to 5%. In panel (b), the difference between the peak of the inverted singly charged CPC response and the peak of the inverted CPC response is approximately 6 nm. The estimated loss in diameter for the singly charged experimental population in panel (b) is still 13 nm. This difference in diameter results in a vapor pressure error of 45% compared to the 11% from panel (a). As the temperature increases, the difference between the peak of the total CPC response and the peak attributed to the singly charged CPC response increases. TDMA users must be aware that large errors can occur when the CPC response contains a single peak.
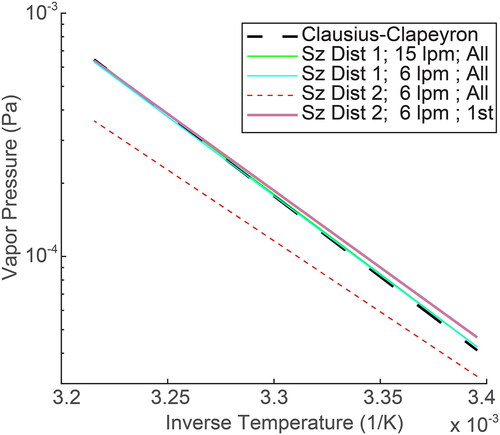
Assuming the overall CPC response peak corresponds with the peak of the singly charged CPC response can lead to inaccurately low measurements of vapor pressure and enthalpy. plots the vapor pressures derived from some of the responses in . The modeled CPC response peaks were inverted using Scanning Mobility Particle Sizer (SMPS) relations (Stolzenburg and McMurry Citation2008). The peaks from the inverted CPC responses were used in conjunction with the time at the peak of the RTD to calculate vapor pressure. We then plotted the calculated vapor pressures as a function of inverse absolute temperature and fit a linear model. This procedure created the lines in . The dashed line in is the original Clausius–Clapeyron relation used to generate the responses in . The green and cyan lines in correlate with the CPC responses in panels (a) and (c), respectively. We see that the SMPS method recovers the original Clausius–Clapeyron model from the situations presented in panels (a) and (c). For the 82 nm size distribution (size distribution 1), the error in estimated enthalpy is −1% to −2% for all cases. For size distribution 2 (200 nm mean), the error in calculated enthalpy of sublimation is −12%. The error in vapor pressure at 296 K can be calculated from the curve fits in . This error is approximately 3% for the 82 nm size distribution and 25% for the 200 nm size distribution. Interestingly, both size distributions create linear responses. If we continued to shift the mean of the inlet size distribution to sizes larger than 200 nm, the response would continue to shift away from the Clausius–Clapeyron relation and further reduce the calculated enthalpy and vapor pressure. If the singly charged experimental size distribution could be tracked in the 200 nm inlet size distribution scenario, accurate vapor pressures and enthalpies could be recovered as illustrated by the thick purple line in .
Figure 5. Clausius–Clapeyron plots from the different modeled situations. The dashed line is the actual Clausius–Clapeyron relationship assumed to develop all hypothetical situations. The multi-charged situation (size distribution 2) in combination with the wide transfer function (sheath flow rate of 6 lpm) creates errors in both vapor pressure and enthalpy measurements (red dotted). If the actual location of the singly charged particles is known, (for example, if instrument settings are used to force the separation of the singly charged particles from the multiply charged particles) then the correct relationship is recovered (thick purple).
Conclusions
The multiple response peaks in published CPC responses from V-TDMA measurement likely correlate with the separation of the singly charged experimental size distribution from the remaining experimental size distributions, not multiple phases. When evaporating levoglucosan in the above experiment, the smaller (diameter) peak in the CPC response resulted from the singly charged experimental size distribution. This charge separation is predicted by the evaporation mechanics. The evaporation mechanics from the TAO model demonstrate that the rate of evaporation of singly charged particles exceeds the rate of evaporation of the higher charges in single charge diameter space. Additionally, the doubly charged experimental size distribution begins to separate from the experimental size distributions with charges greater than two, after the singly charged experimental size distribution is nearly evaporated. If multiple phases exist, many more peaks should be present. The TAO model suggests that narrow DMA transfer functions and narrow residence time distributions must be used to detect the two-peak CPC response.
Heater design and proper characterization of the RTD are critical for accurate vapor pressure measurements. To use the peak of the inverted CPC response for vapor pressure determination, an oven residence time is needed. When we measured the oven RTD, the correct oven residence time correlated with neither the measured average residence time nor the residence time calculated from the tubing diameter and length. The correct residence time corresponds with the peak of the RTD. Errors of 30% occurred when using the residence time calculated from the tubing diameter and length. This underscores the necessity of directly measuring the RTD of the oven and using the time associated with the peak of the RTD. Additionally, the convolution of wide RTDs with wide DMA transfer functions creates errors between the inverted CPC response and the peak time of the RTD. When using a wide RTD and convoluting this RTD with the wide DMA transfer functions, TAO calculated errors in vapor pressure up to 50% from convolution. To reduce convolution error, narrow RTDs and narrow DMA transfer functions should be used. For our RTD with a narrow DMA transfer function, the convolution error is estimated to be 1%.
The peak of the inverted CPC response does not necessarily correlate with the peak of the singly charged experimental size distribution. The selected population exiting DMA1 contains many size distributions, and each size distribution corresponds with a number of charges. The experimental size distributions, with charges greater than one, skew the CPC response to larger diameters. To prevent the inlet size distribution from creating a multi-charged selected population, DMA1 should sample diameters greater than the diameter corresponding with the peak (maximum) of the inlet size distribution. In this work, an example of a highly multi-charged selected population created errors in vapor pressure of 25% and errors in enthalpy of 12%.
Use of wide DMA transfer functions does not necessarily create error. When the population selected by DMA1 consists of primarily singly charged particles, the peak of the CPC response is close to the peak of the singly charged experimental size distribution. This relationship is true regardless of transfer function used. However, as shown in the examples above, the fraction of singly charged particles in the experimental population may be unknown throughout evaporation. Thus, for reasons of both data accuracy and quality, we recommend using narrow transfer functions with narrow residence time distributions to separate the CPC response into two peaks using the evaporation process. If the singly charged CPC response can be isolated, then accurate vapor pressures and enthalpies can be reproduced, assuming accurate measures of the input variables (e.g., surface energy, gas phase diffusivity, particle density).
Supplemental Material
Download MS Word (2.1 MB)Acknowledgments
Authors would like to thank Claire Fortenberry for her critical feedback. This document was written in memory of my mother, Theresa Ann Oxford. (1948-2004).
Additional information
Funding
References
- Allen, M. D., and O. G. Raabe. 1985. Slip correction measurements of spherical solid aerosol particles in an improved Millikan apparatus. Aerosol. Sci. Tech. 4 (3):269–86. doi:10.1080/02786828508959055.
- Baron, P. A. 2005. Aerosol measurement principles, techniques, and applications. Hoboken, NJ: Wiley.
- Bilde, M., K. Barsanti, M. Booth, C. D. Cappa, N. M. Donahue, E. U. Emanuelsson, G. McFiggans, U. K. Krieger, C. Marcolli, D. Topping, et al. 2015. Saturation vapor pressures and transition enthalpies of low-volatility organic molecules of atmospheric relevance: From dicarboxylic acids to complex mixtures. Chem. Rev. 115 (10):4115–56. doi:10.1021/cr5005502.
- Bilde, M., B. Svenningsson, J. Monster, and T. Rosenorn. 2003. Even-odd alternation of evaporation rates and vapor pressures of C3-C9 dicarboxylic acid aerosols. Environ. Sci. Technol. 37 (7):1371–8. doi:10.1021/es0201810.
- Bird, R. B., W. E. Stewart, and E. N. Lightfoot. 2002. Transport phenomena. New York: J. Wiley.
- Chattopadhyay, S., and P. J. Ziemann. 2005. Vapor pressures of substituted and unsubstituted monocarboxylic and dicarboxylic acids measured using an improved thermal desorption particle beam mass spectrometry method. Aerosol Sci. Tech. 39 (11):1085–100. doi:10.1080/02786820500421547.
- Emanuelsson, E. U., M. Tschiskale, and M. Bilde. 2016. Phase state and saturation vapor pressure of submicron particles of meso-erythritol at ambient conditions. J. Phys. Chem. A 120 (36):7183–91. doi:10.1021/acs.jpca.6b04349.
- Friedlander, S. K. 2000. Smoke, dust, and haze: Fundamentals of aerosol dynamics. New York: Oxford University Press.
- Fuchs, N. A., and A. G. Sutugin. 1971. High-dispersed aerosols. In Topics in current aerosol research, eds. G. M. Hidy and J. R. Brock, 1. Oxford: Pergamon.
- Hinds, W. C. 1999. Aerosol technology: Properties, behavior, and measurement of airborne particles. New York: Wiley.
- Jiang, J., C. Kim, X. Wang, M. R. Stolzenburg, S. L. Kaufman, C. Qi, G. J. Sem, H. Sakurai, N. Hama, and P. H. McMurry. 2014. Aerosol charge fractions downstream of six bipolar chargers: effects of ion source, source activity, and flowrate. Aerosol Sci. Tech. 48:1207–16. doi:10.1080/02786826.2014.976333.
- Kim, J. H., G. W. Mulholland, S. R. Kukuck, and D. Y. H. Pui. 2005. Slip correction measurements of certified PSL nanoparticles using a nanometer differential mobility analyzer (Nano-DMA) for Knudsen number from 0.5 to 83. J. Res. Natl. Inst. Stand. Technol. 110 (1):31–54. doi:10.6028/jres.110.005.
- Koehler, K. A., S. M. Kreidenweis, P. J. DeMott, A. J. Prenni, C. M. Carrico, B. Ervens, and G. Feingold. 2006. Water activity and activation diameters from hygroscopicity data – Part II: Application to organic species. Atmos. Chem. Phys. 6 (3):795–809. doi:10.5194/acp-6-795-2006.
- Koponen, I. K., I. Riipinen, A. Hienola, M. Kulmala, and M. Bilde. 2007. Thermodynamic properties of malonic, succinic, and glutaric acids: Evaporation rates and saturation vapor pressures. Environ. Sci. Technol. 41 (11):3926–33. doi:10.1021/es0611240.
- Liu, B., D. Pui, K. Whitby, D. Kittelson, Y. Kousaka, and R. McKenzie. 1978. The aerosol mobility chromatograph: a new detector for sulfuric acid aerosols. In Sulfur in the atmosphere, 99–104. Oxford: Elsevier.
- McMurry, P. H., H. Takano, and G. R. Anderson. 1983. Study of the ammonia (gas)-sulfuric acid (aerosol) reaction rate. Environ. Sci. Technol. 17 (6):347–52. doi:10.1021/es00112a008.
- Oxford, C. R., C. M. Rapp, Y. Wang, P. Kumar, D. Watson, J. L. Portelli, E. A. Sussman, S. Dhawan, J. Jiang, and B. J. Williams. 2019. Development and qualification of a VH-TDMA for the study of pure aerosols. Aerosol Sci. Technol. 53 (2):120–32. doi:10.1080/02786826.2018.1547358.
- Petters, M. D. 2018. A language to simplify computation of differential mobility analyzer response functions. Aerosol Sci. Tech. 52:1437–51.
- Rader, D. J., and P. H. McMurry. 1986. Application of the Tandem differential mobility analyzer to studies of droplet growth or evaporation. J. Aerosol Sci. 17 (5):771–87. doi:10.1016/0021-8502(86)90031-5.
- Rader, D. J., P. H. McMurry, and S. Smith. 1987. Evaporation rates of monodisperse organic aerosols in the 0.02-Mu-M-Diameter to 0.2-Mu-M-diameter range. Aerosol Sci. Tech. 6 (3):247–60. doi:10.1080/02786828708959137.
- Saleh, R., J. Walker, and A. Khlystov. 2008. Determination of saturation pressure and enthalpy of vaporization of semi-volatile aerosols: The integrated volume method. J. Aerosol Sci. 39 (10):876–87. doi:10.1016/j.jaerosci.2008.06.004.
- Salo, K., A. M. Jonsson, P. U. Andersson, and M. Hallquist. 2010. Aerosol volatility and enthalpy of sublimation of carboxylic acids. J. Phys. Chem. A 114 (13):4586–94. doi:10.1021/jp910105h.
- Stolzenburg, M. R., and P. H. McMurry. 2008. Equations governing single and tandem DMA configurations and a new lognormal approximation to the transfer function. Aerosol Sci. Technol. 42 (6):421–32. doi:10.1080/02786820802157823.
- Tao, Y., and P. H. McMurry. 1989. Vapor pressures and surface free energies of C14-C18 monocarboxylic acids and C5 and C6 dicarboxylic acids. Environ. Sci. Technol. 23:1519–23. doi:10.1021/es00070a011.
- Tester, J. W., and M. Modell. 1997. Thermodynamics and its applications. Upper Saddle River, NJ: Prentice Hall PTR.
- Topping, D. O., G. B. McFiggans, G. Kiss, Z. Varga, M. C. Facchini, S. Decesari, and M. Mircea. 2007. Surface tensions of multi-component mixed inorganic/organic aqueous systems of atmospheric significance: Measurements, model predictions and importance for cloud activation predictions. Atmos. Chem. Phys. 7 (9):2371–98.
- Wiedensohler, A. 1988. An approximation of the bipolar charge-distribution for particles in the sub-micron size range. J. Aerosol Sci. 19 (3):387–9. doi:10.1016/0021-8502(88)90278-9.
- Wright, T. P., C. Song, S. Sears, and M. D. Petters. 2016. Thermodynamic and kinetic behavior of glycerol aerosol. Aerosol Sci. Technol. 50 (12):1385–96. doi:10.1080/02786826.2016.1245405.