
 ?Mathematical formulae have been encoded as MathML and are displayed in this HTML version using MathJax in order to improve their display. Uncheck the box to turn MathJax off. This feature requires Javascript. Click on a formula to zoom.
Abstract
In this article, we present a novel method for the elemental analysis of airborne aerosol particles using electrodynamic balance (EDB) trapping followed by laser-induced breakdown spectroscopy. The setup consists of a newly designed corona-based aerosol charger, double-ring electrodynamic balance trap and optical arrangement for the spectroscopy. Experimental laboratory measurements using the method show that the minimum particle size for successful analysis is 1 µm in diameter, and the minimum airborne concentration is of the order of 1 particle/cm3. In addition to the method, we will present results on the charging efficiency of the developed charger and novel stability analysis of the EDB at the charge region. The results from the stability analysis will ease the way toward analyzing submicron particles with the technique.
EDITOR:
1. Introduction
Particulate matter (PM) affects human wellbeing both directly through breathing and indirectly by taking part in atmospheric processes, such as the hydrological cycle and radiation balance: PM smaller than 10 µm in diameter can penetrate through the nasal passages of the respiratory tract and cause adverse health effects (Kim, Kabir, and Kabir Citation2015). PM also takes part in cloud formation and droplet freezing, thus affecting precipitation processes and albedo (Charlson et al. Citation2001; DeMott et al. Citation2010; Murray et al. Citation2012). Moreover, lack of knowledge about PM driven droplet freezing dynamics in clouds is one of the main obstacles in a way of better understanding and predicting the climate system (DeMott et al. Citation2010; Vergara-Temprado et al. Citation2018).
Determining elemental composition provides crucial information about the aerosol species, sources and toxicity potential (Calvo et al. Citation2013; Schleicher et al. Citation2011). Thus, several studies have concluded the importance of elemental characterization of PM (e.g., Hoose and Möhler Citation2012; Kim, Kabir, and Kabir Citation2015; Knopf, Alpert, and Wang Citation2018; Paramonov et al. Citation2019). An extensive range of analysis methods have been established for particles collected on filters or impactors, capable of analyzing a broad variety of chemical properties up to the spatial distribution of molecular composition (see, e.g., Fletcher et al. Citation2011; Laskin et al. Citation2003). However, long sampling times in offline analysis restricts the observation of temporal variation of ambient aerosols. Also, contamination and evaporation and/or condensation of vapors may cause measurement artifacts to the analysis and single-particle resolution may be lost (Maeng et al. Citation2017; Turpin, Huntzicker, and Hering Citation1994).
Online analysis methods overcome many of the problems considering offline analysis, as direct analysis from ambient air enables to preserve temporal variability, volatile particle compounds and single-particle resolution. To date, the most common real-time technique to analyze chemical composition of ambient PM is aerosol mass spectrometry (Nash, Baer, and Johnston Citation2006). Though accurate and sensitive, mass spectrometry has certain shortcomings: the equipment is complicated and expensive, requires a good vacuum and relatively heavy data analysis to interpret the measurement results. Another possible technique for the online elemental analysis of (particulate) matter is laser-induced breakdown spectroscopy (LIBS) (Laserna, Vadillo, and Purohit Citation2018). It has the ability to classify every element in the periodic table without complicated sample preparation or a vacuum. Thus, LIBS is a widely used technique in different fields of research (e.g., Hamzaoui et al. Citation2011; Rai and Rai Citation2008; Vaniman et al. 2014), including aerosol science (Essien, Radziemski, and Sneddon Citation1988; Kim et al. Citation2019; Xiong et al. Citation2016).
In LIBS, a laser pulse is focused into a small volume of the order of 10–100 µm3 (Järvinen and Toivonen Citation2016). The signal originates only from this volume and thus the analyzed material must be within that volume. In order to obtain LIBS signal from PM, the particles can be collected on a substrate such as a filter (Panne et al. Citation2001) or an electric needle tip (Diwakar, Kulkarni, and Birch Citation2012). Without particle collection, a reasonable statistical probability of the laser hitting a particle can be achieved with large local particle concentration combined with a high pulse rate (e.g., Gallou et al. Citation2011; Hahn and Lunden Citation2000). In order to improve the statistical probability, the aerosol can be focused into a narrow stream with a nozzle and sheath flow (Park, Cho, and Kwak Citation2009; Tjärnhage et al. Citation2013). Fast sampling rates have been achieved for reasonable concentrations (> 1000 particles/cm3) of ambient PM by Maeng et al. (Citation2017), by combining timed ablation (as in Manninen et al. 2008; Tjärnhage et al. Citation2013) with aerosol flow focusing.
LIBS analysis of spatially focused single particles have been reported using methods including droplet generation and trapping (Contreras et al. Citation2018; S. T. Järvinen et al. Citation2014) and optical resuspension from a substrate combined with optical trapping (Fortes, Fernández-Bravo, and Laserna Citation2014). Water droplets have been focused with a standing acoustic wave (Contreras et al. Citation2018) and with an electrodynamic balance (EDB) trap (Järvinen et al. Citation2014). Furthermore, primary particles can be immersed in the water droplets and the dry residuals analyzed with the EDB-LIBS equipment, leading to a single-particle analysis technique (Saari et al. Citation2016). However, droplet generation leaves the residual particles with unwanted contamination from the carrier substance.
Using EDB focusing, Vehring et al. (Citation1998) successfully analyzed highly charged droplet residual particles originating from a vibrating orifice generator source (VOAG; Berglund and Liu Citation1973) with Raman spectroscopy, down to a minimum diameter of 3 µm. For ambient particles, Raman spectroscopy revealed challenging because of photophoresis overtaking the electrical focusing force in the EDB. However, a few large (dp>10 µm) particles were analyzed.
In this article, we present an EDB–LIBS technique for the direct analysis of airborne single particles. To our knowledge, no prior trapping techniques have been combined with LIBS directly for ambient aerosol sources before. In LIBS, photophoresis is not seen as a problem, since the pulse times are short and the emission spectrum is collected in the order of milliseconds. The focus on the presented results will be on the trapping stability of the EDB, since it emerged as the most limiting factor of the technique. This is due to the achieved relatively low particle charge compared to previously used droplet charging methods. Consequently, we present new methods to evaluate the trapping efficiency. The EDB-LIBS technique shows potential for single particle chemical analysis applicable for instance to composition analysis of ice residual particles or monitoring ambient particles with potential adverse health effects.
2. Materials and methods
The strength of the electric interaction between the particles and the focusing electric field sets the biggest challenge for the spatial focusing in the EDB. Since particle focusing is essential for the LIBS analysis and dependent on the particle charge, an aerosol charger was designed to maximize the charging state of large (dp > 0.5 µm) particles. The charge distribution produced by the charger was measured and the results were applied for the analysis of the EDB focusing stability. Laboratory measurements with the EDB-LIBS method were then conducted with two different aerosol generation methods using kaolinite mineral particles.
2.1. Charger design
Operation of a corona discharge-based aerosol charger relies on two major phenomena: charging due to ion diffusion and charging due to electric field in the charging region. Ion diffusion is considered the dominant charging process for small (dp < 200 nm) particles and field charging for large particles (e.g., Hinds Citation1999). The phenomena will not be discussed in detail here, but for spherical particles the charging efficiencies due to them can be estimated by equations
(1)
(1)
and
(2)
(2)
where nd and nf are the charging efficiencies of a diffusion and a field charger, respectively (Hinds Citation1999). Terms in the diffusion charging EquationEquation (1)
(1)
(1) are the permittivity of the vacuum ε0, particle diameter dp, the Boltzmann constant k, absolute temperature T, mean thermal velocity of the ions ci, the elementary charge e, ion concentration in the charging zone Ni and the residence time of the particle in the charging volume t. In EquationEquation (2)
(2)
(2) , the permittivity of the particle ε, the ion electrical mobility Zi, and the electric field E also add to the final charge of the particles.
Typical diffusion chargers provide below 100 elementary charges per particle at one micrometer of particle size (e.g., Liu and Pui Citation1977; Park, An, and Hwang Citation2007; Rostedt, Marjamäki, and Keskinen Citation2009). With field chargers, higher charge numbers for the particle size have been achieved (Hewitt Citation1957; Unger, Boulaud, and Borra Citation2004), with over 400 charges per particle in the Hewitt’s oscillating square field-type charger. The new charger presented in is designed in a way that the electric field in the charging region is enhanced by the same voltage that causes the corona discharge itself. The design obviates the need of an oscillating field, therefore simplifying the charger and the equipment requirements.
Figure 1. A schematic cross-section of the developed charger and a simulation of the electric field strength around the inner tube. Dimensions of the inner and outer tubes are 2.0 mm and 13 mm (ID), respectively. Aerosol flows through the inner tube through the corona discharge, leading to an electric field of the order 105–106 Vm−1 in the charging region.
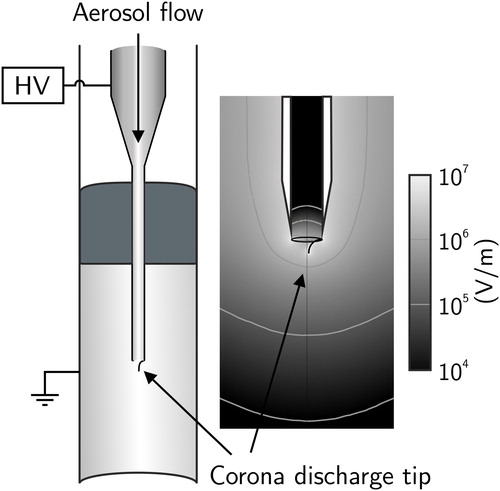
The corona discharge takes place at the end of a short wire (d = 0.2 mm), located at the tip of the inner tube. In the prototype the wire, made of stainless steel, is spot-welded into the middle part of the inner tube and brought toward the tip inside heat-shrink tubing. The length of the wire is 2 mm from the exit of the inner tube. Since the whole inner tube is at high potential, the field applied to particles inside it is small due to symmetry. Large atmospheric particles also typically have low electrical mobility (Fuchs Citation1963), leading to low electrical losses inside the tube. The electric field strength in the charging region was calculated using a finite element analysis software (COMSOL Multiphysics® 5.3.1, Comsol Inc.), and was found to be of the order of 105–106 Vm−1, as seen from . The charger is used with a 2 lpm flow rate and a constant voltage of 5.10 kV, which corresponds to an electric current of about 20 µA. The inner diameters of the inner and outer tubes are 2.0 mm and 13.0 mm, respectively.
2.2. Charger performance measurements
The charge distribution and the geometric and arithmetic mean values of the charging state were measured as a function of particle size. To generate a well-defined monodisperse aerosol at the size range of 0.5–5 µm, the single charged aerosol reference (SCAR) system (Yli-Ojanperä et al. Citation2010) was used. In SCAR, small (approx. 10 nm) silver particles are singly charged, classified with a nano-DMA and grown with diethylhexyl sebacate (DEHS). The DEHS particles are then classified into a monodisperse aerosol with a differential mobility analyzer (DMA) designed to classify especially large (up to 5.3 µm) particles (Tampere Long DMA, Järvinen, Keskinen, and Yli-Ojanperä Citation2018). The particles leaving the DMA are thus monodisperse and carrying a single negative elementary charge.
After the generation, the aerosol was charged with a positive charge using the presented charger and then analyzed using setups presented in . As studied before (e.g., A. Järvinen et al. Citation2014; Qi et al. Citation2009), the small initial charge is not expected to affect of the charger performance. The carrier gas in the charger efficiency measurements was dry air (RH < 10%, T 295 K), with a slightly increased (80 − 82%) nitrogen concentration due to the silver particle generation. A particle counter (CPC II, model 3756, TSI, Shoreview, MN, USA) was placed after the charger in parallel to the alternative measurement setups as a reference to monitor concentration stability and to normalize the measurement points.
Figure 2. The characterization setups of the charger and the EDB. SCAR provides singly charged aerosol, which is classified into a monodisperse aerosol with the tampere long DMA. The monodisperse aerosol is then charged and directed into one of the three alternative measurement branches, which are used one at a time.
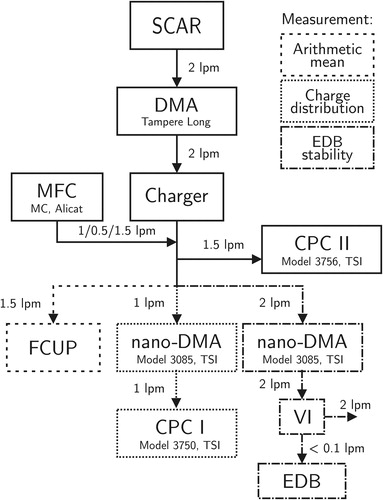
The charge distribution measurement setup is presented in the middle branch of . The charged aerosol was classified by another DMA (nano-DMA, model 3085, TSI Inc., Shoreview, MN, USA [Chen et al. Citation1998]). After the nano-DMA, the aerosol enters a condensation particle counter (CPC I, model 3750, TSI), from which one can define the charge distribution density function shape using the particle concentration as a function of the nano-DMA voltage (for further information see the online supplementary information [SI], Chapter 1).
The arithmetic mean charge was measured using a Faraday cup electrometer (FCUP) and a CPC (CPC II), as shown in . With the FCUP, a total electric current I carried by an aerosol can be measured (see, e.g., Dhaniyala et al. Citation2011). If the number concentration of particles N and flow rate Q trough the FCUP are also known, one can calculate the arithmetic mean of elementary charges n per particle:
(3)
(3)
Identical transportation lines and flows into the CPC and the FCUP were used to minimize asymmetric particle losses and the concentration values were corrected by the detection efficiency of the particle counter. The right measurement branch in was used in the EDB stability characterization, presented in the next chapter.
2.3. Electrodynamic balance
After the charger, the particles are introduced into the EDB chamber. The functional part of the EDB is the double-ring electrode configuration presented by Heinisch et al. (Citation2009). Several authors have studied the principles of the balance analytically (e.g., Davis Citation1985; Frickel, Shaffer, and Stamatoff Citation1978; Hartung and Avedisian Citation1992) in a sophisticated manner. The force equation considering a particle in an electric field is derived from Newton’s second law:
(4)
(4)
in which the first term
is the Stokesian drag force,
gravity,
electrical force due to the electrical field and
consists of possible external forces, caused by convective forces or radiation pressure, for example. When assuming that the particle stays in the Stokes regime while oscillating and that the external forces are negligible, expanding EquationEquation (4)
(4)
(4) at the symmetry axis (noted as z-axis) leads to
(5)
(5)
In earlier work (e.g., Davis Citation2011), EquationEquation (5)(5)
(5) has been expressed using dimensionless variables
and
where z is the distance of the particle from the focus spot,
is the distance between the DC electrodes (here
4 mm) and
is the angular frequency of the AC-voltage. The equation thus simplifies into the dimensionless form:
(6)
(6)
in which the drag parameter
and the AC-field strength parameter
define the stability and the DC offset parameter
defines the oscillation amplitude if the DC-voltage is not correctly set to balance external forces (Davis Citation2011). Other terms in EquationEquations (5)
(5)
(5) and Equation(6)
(6)
(6) are
which is the dynamic viscosity of the carrier gas,
is the diameter of the particle, m its mass, q its electric charge and
is the slip correction factor.
and
are the (amplitude) AC- and DC-voltages and
is the DC-voltage needed to balance the particle at the focus spot. In EquationEquation (6)
(6)
(6) , the DC-component of the electric field (DC-field) is defined as independent with respect to z. The assumption is reasonable in the case of highly charged droplets and droplet residuals, since they interact strongly with the AC-field and thus drift efficiently into the close proximity of the focus spot.
Setting the offset parameter to and solving EquationEquation (6)
(6)
(6) as a function of the stability parameters, earlier studies have presented multiple instability regions similar to the ones solved and presented in (e.g., Davis Citation2011; Davis Citation1985; Frickel, Shaffer, and Stamatoff Citation1978; Hartung and Avedisian Citation1992). In these unstable regions, the AC-field causes a highly charged particle to oscillate violently and escape from the trap. Using measured values of particle charges achieved with the charger presented above and simulated values of geometric constants for the EDB (both presented later in Section 3), stability parameters for a few particle diameters were calculated and plotted in the same figure () as cross markers. AC-voltage amplitude and frequency used in the calculations were 1000 V and 100 Hz, respectively.
Figure 3. Calculated stability areas of a particle in an EDB using the dimensionless stability parameters presented in EquationEquation (6)(6)
(6) . Particles with charging states achieved with the charger presented in the previous chapter should be well in the stable area of the chart with an amplitude AC-voltage of 1 kV and an AC-frequency of 100 Hz.
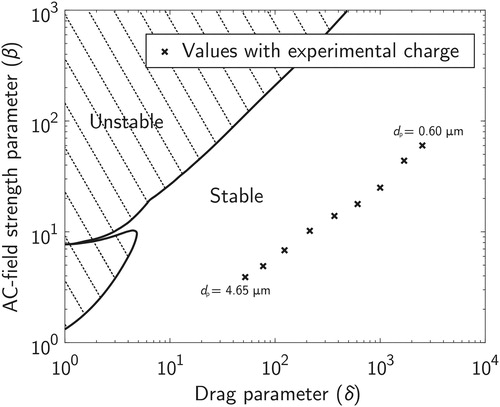
It can be seen from that the parameter values calculated for all of the particles under consideration fall into the stable region of the chart. However, experiments show that submicron particles charged with a corona-based charger neither stably trap into the focus spot nor oscillate violently, but instead slowly drift away from the trap. The phenomena was also noted by Aardahl et al. (Citation1997), who studied the convective forces causing the instability.
In our study it was noticed that it is also the DC-field that leads to unsuccessful balancing: with a low charge the DC-field needs to be greater to cancel out the effect of gravity and on the other hand the interaction with the balancing AC-field becomes weaker. Thus, the spatial inhomogeneity of can not be neglected from the stability consideration as was made in EquationEquation (6)
(6)
(6) .
The instability caused by the DC-field was studied both numerically and experimentally. Numerical methods include simulations of the electric field components in the EDB, which were then applied to particle trajectory simulations by solving the differential EquationEquation (5)(5)
(5) numerically (ode45 solver, Matlab R2017b, The MathWorks) with a multitude of different parameter values. Ultimately, an equation for the minimum amplitude of the AC-voltage required for successful trapping was derived from the trajectory simulations. The simulations are presented in more detail in the SI, Chapter 2.
As will be presented later in Section 3, the threshold AC-voltage equation was found to be a function of the particle electrical mobility and the initial position and of geometrical constants of the EDB. The equation was verified experimentally with multiple different combinations of particle electrical mobilities, diameters and initial positions. The measurement setup of the threshold voltage is presented in the right branch of : a nano-DMA was used to classify the charged monodisperse DEHS aerosol as a function of its electrical mobility, independent of the particle size. The measurements were conducted by choosing a certain particle electrical mobility with the nano-DMA, trapping a particle with that mobility and manually finding the right DC-voltage needed to keep the particle in the focus spot. After that, the particle was deviated to a known, pre-defined distance from the focus by temporarily increasing the DC-voltage. Once the midpoint of the oscillation of the particle was on that distance, the DC-voltage was set back to the balance value and a threshold AC-voltage needed to drift the particle toward the focus spot could be defined. Measurements were made with multiple electrical mobilities, 4 different particle diameters (2, 3, 4, and 5 µm) and from 2 different initial particle positions (0.5 mm and 1.0 mm) with an AC-frequency of 100 Hz. A virtual impactor with a cutpoint of approximately 1 µm was used as a flow splitter in front of the EDB, due to the flow difference between the EDB ( < 0.1 lpm) and the charger (
2 lpm).
2.4. EDB-LIBS analysis
The measurement principle is presented in : The aerosol under analysis is charged and then driven to the EDB chamber through a virtual impactor (VI). The VI operating at a major flow of 2 lpm ensures an approximately constant flow through the charger, since the flow rate through the EDB chamber is small (QEDB < 0.1 lpm) or zero, depending on the phase of the analysis. It also minimizes the particle losses caused by the flow difference between the charger and the chamber, for particles larger than its cutpoint (approx. dp>1 µm).
Figure 4. A schematic figure of the EDB-LIBS measurement principle (a) and of the used optical chamber (b). An aerosol enters the charger with a 2 lpm flow rate, which is also the major flow of the virtual impactor. The minor flow of the virtual impactor continues to the EDB chamber with a flow rate below 0.1 lpm.
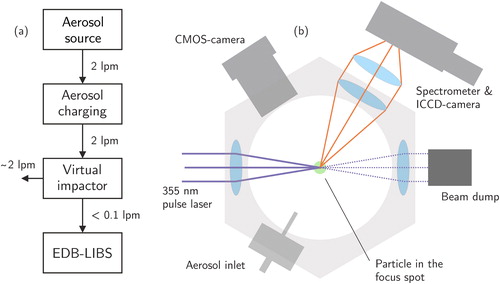
The chamber itself, presented by Järvinen et al. (Citation2014), includes optical windows located on every side of the chamber and in the top and bottom, allowing optical access through the middle electrodes. Schematic figure of the chamber is shown in . The trapping volume is illuminated from the bottom window with a 532 nm CW laser (CW532-005, Roithner Lasertechnik GmbH, Vienna, Austria). Outer electrodes are set on ground potential and the inner ones include both AC- and DC-components of the balancing voltage, as presented by Heinisch et al. (Citation2009). The aerosol flow is introduced into the chamber with an inlet from one of the side windows and directed through the upper electrode, therefore through the trapping volume. When the aerosol is flowing through the chamber, the flow is stopped and, if successful, a particle is trapped in the electric field. If multiple particles are trapped, they can be driven outside by temporarily unbalancing the DC-voltage. Usually the DC-voltage needs to be adjusted separately for each particle to drive it to the exact focus spot. When the particle, monitored with a CMOS-camera (DCC1545M, Thorlabs, Inc., Newton, NJ, USA), is within the focal volume of the pulse laser, it is manually triggered and a plasma emission spectrum can be collected by the spectrometer connected to an ICCD-camera (DH340T-18U-E3, Andor Technology Plc., Belfast, UK).
Two experiments were conducted using the same aerosol source with different generation methods. The used test sample was kaolinite mineral dust (CAS Number 1318-74-7, Sigma-Aldrich Corp., St. Louis, MO, USA), which consists of aluminum, silicon, oxygen and hydrogen. The first generation method was a wet generation method using a piezo-electric droplet dispenser as in Järvinen et al. (Citation2014). The second method was a dry generation method using a simple glass vial attached to a magnetic stirrer, which produced a polydisperse aerosol in the size range of 1–10 µm. When using the powder generation method, the aerosol was first pre-charged with an inverse charge compared to the actual charger to prevent the analyzed particles being charged due to the generating system itself. Multiple spectra from both samples were analyzed with constant EDB and emission detection parameters, which are listed in Table S3, including the used components. The optical components are described in more detail by Järvinen et al. (Citation2014).
3. Results
3.1. Achieved charging states
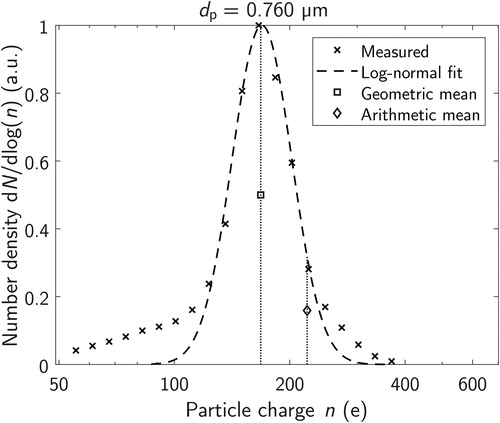
As in earlier studies (e.g., Järvinen et al. Citation2017; Kaminski et al. Citation2012) the charge distribution was found to closely follow a log-normal distribution. Therefore, the geometric mean was selected as a suitable indicator for the charging efficiency, rather than arithmetic mean. The geometric mean values were defined from the log-normal fit functions for each measured particle size. shows an example of the measured charge distribution for 0.760 µm particles, the lognormal fit, and both of the mean charge values
Figure 5. An example charge distribution measurement at the particle size of 0.760 µm, including the mean values and a log-normal fit to the measurement points.
Both of the mean values can be found from (Table S1) and from for all of the measured particle sizes. The geometric standard deviation of the log-normal fit function is also included in the Table S1. Additionally, a power function was fitted to the geometric mean results:
(7)
(7)
Figure 6. A comparison between the characterized charger, theoretical equations and selected previously presented aerosol chargers. Literature results are the arithmetic mean values of the chargers under consideration.
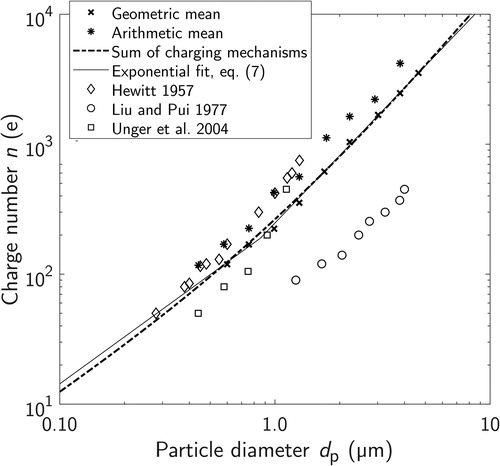
When comparing EquationEquation (7)(7)
(7) to the geometric mean values, mean absolute percentage error of about 3.9% and root-mean-square deviation of 34 were calculated.
The geometric mean value results were compared to computational charging states using EquationEquations (1)(1)
(1) and Equation(2)
(2)
(2) . From the geometrical (charging zone diameter D = 13 mm, charging zone length x = 10 mm) and experimental (flow rate Q = 2 lpm, corona discharge current I = 20 µA) parameters used in the measurements, an Nt product was approximated as 1.5
This was then applied to EquationEquations (1)
(1)
(1) and Equation(2)
(2)
(2) , which were furthermore fitted with the geometric mean values of the measurement. The best fit (using the linear least-squares fit method) for the electric field strength E with the chosen Nt product value was 7.7
which is in good agreement with the field simulations presented in . When comparing the fit function with the experimental results, mean absolute percentage error and root-mean-square deviation of about 5.2% and 34 were calculated, respectively. A comparison to charging states of earlier studies of Hewitt (Citation1957), Liu and Pui (Citation1977) and Unger, Boulaud, and Borra (Citation2004), is presented in , including the fit functions presented above.
During the charging state measurements, the electrical losses were estimated to be approximately 50%. Such losses are typical in this type of a charger, since the high final charge number—and thus high electrical mobility—is reached using an intense electric field, which also strongly drives the charged particles toward the grounded outer cylinder of the charger.
Altogether, the charger works efficiently on its purpose: to reach a high charging state for large particles with a simple design. The reached arithmetic mean charge values are comparable to values reported by Hewitt (Citation1957). The field simulations conducted during the charger design were in good agreement with the theoretically estimated (EquationEquations (1)(1)
(1) and Equation(2)
(2)
(2) ) charge values. In the next subsection, the power function (EquationEquation (7))
(7)
(7) was used when studying the electrodynamic balance with achievable charging states.
3.2. Electrodynamic trapping limits
The simulation results for the electric fields and the particle trajectories are presented in more detail in the SI. The main result of the simulations is a threshold AC-voltage :
(8)
(8)
which is the voltage required for a stable particle trajectory in the EDB. In EquationEquation (8)(8)
(8) , Z is the electrical mobility and
the initial position of the particle at the positive z-axis, g is the standard acceleration due to gravity and C0, C1 and C2 are geometrical constants of the EDB electrode configuration, defined in Equations (S7) and (S8). EquationEquation (8)
(8)
(8) was verified with 10,000 particle trajectory simulations using the measured charge distribution and random but realistically ranging other parameters, also presented in more detail in the SI.
Interestingly, it turns out that the AC-field frequency or the particle density do not affect the stability. The independencies may be due to the lack of strong interaction between the AC-field and the charged particle, leading to relatively slow speeds and accelerations in the oscillation: the particle is constantly moving at the thermal velocity in the AC-field, independent of the frequency or particle mass.
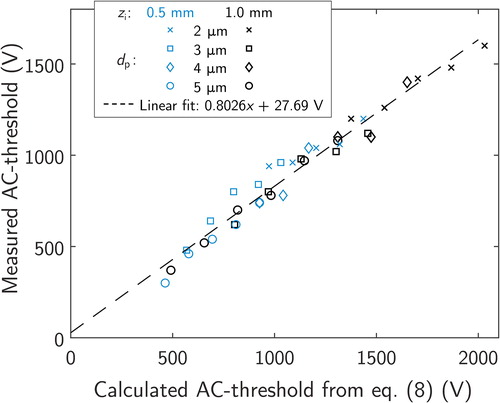
The experimentally defined AC-voltages required for a stable particle trajectory are plotted as a function of the calculated threshold AC-voltages in . A linear function was fitted to the results, leading to a slope of 0.8026 and a constant term of 27.69 V. Since the used geometrical constants were defined with numerical simulations, the slope differs from unity, but the small constant term combined with error values of 6.63% (mean absolute percentage error) and 61.0 (root-mean square deviation) lead to a conclusion that the experimental results with a constant AC-frequency are in a good agreement with the results from particle trajectory simulations. However, the AC-frequency slightly affected the threshold voltage with a relation of about which was not predicted by the simulations.
Figure 7. Measured threshold voltages with different electrical mobilities, sizes and initial positions as a function of the calculated threshold value from EquationEquation (8)(8)
(8) .
With the equation for the threshold voltage one can predict whether there is a realistic chance of stably trapping a particle with a known electrical mobility and initial position. Straightforwardly, the minimum charge number needed to trap a spherical particle can be calculated as a function of particle diameter. However, one must assume the initial position of the particle to calculate the threshold. EquationEquation (8)(8)
(8) predicts that when the particle is driven to the exact focus spot, the AC-voltage needed to keep the balance should approach zero. This is obviously not the case due to external forces and unidealities in the real-world electrode configuration. Instead, even if the particle seems to be at the exact focus spot, it might slowly drift away from it if the AC-voltage is too small. The physical process behind the phenomena might be that the external forces or unideal field shape deviate the particle from the focus, drifting it to a region where the focusing AC-field can no longer compete with the growing DC-field.
It was experimentally estimated that the threshold amplitude AC-voltage required to stabilize the particle in the focus spot is equal to the voltage value required to drift the particle toward the focus spot from an initial distance of = 0.7 mm. This initial position was used together with EquationEquation (8)
(8)
(8) to estimate the minimum charge number needed for a stable balance as a function of particle size. The results are shown in for AC amplitude voltages of 1, 2 and 4 kV.
Figure 8. Threshold charge numbers required for successful balancing of a particle as a function of particle size with different (1, 2, and 4 kV) amplitude AC-voltages. The figure includes the measured geometric and arithmetic mean values and the Rayleigh limit charge, which is considered as the maximum charge for liquid particles. The 4 kV value was experimentally estimated to be the maximum safe operating amplitude.
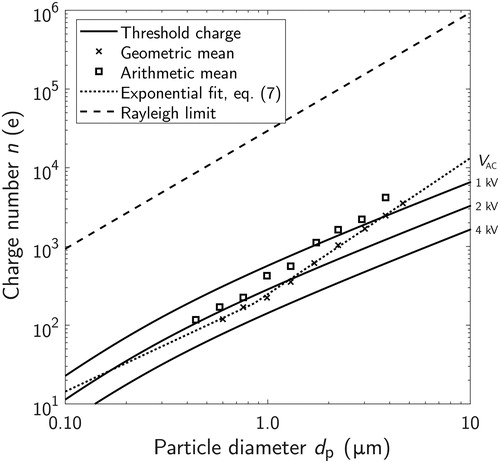
It can be seen from that for particles with a charge value defined in EquationEquation (7)(7)
(7) , the minimum particle size that can be stably balanced with
1 kV is about 3.5 µm in diameter and with
2 kV about 1.3 µm. The 4 kV amplitude AC-voltage was experimentally estimated to be the safe maximum operating amplitude that does not lead to an electric breakdown with the used EDB configuration. With the maximum amplitude, the achieved charging states should be enough to overcome the trapping limit due to the DC-field. As already mentioned, external forces such as the convective airflow may also disturb the trapping procedure as the particle size gets smaller (e.g., Aardahl et al. Citation1997).
The LIBS analysis does not necessarily require a fully established balance, but a particle slowly drifting through the focus spot is acceptable for successful analysis. Therefore, the analysis could be carried out for 1 µm particles (measured by an Aerodynamic Particle Sizer, APS 3320, TSI) using voltage amplifiers with a maximum output of 1 kV. Such analysis, however, requires active manipulation of the particle position by adjusting the DC-voltage. The LIBS analysis results from laboratory generated kaolinite aerosols procedure are presented in the next chapter.
3.3. Composition measurements
The averaged spectra from both generation methods (wet and dry generation), both divided with the background signal from air are shown in . The average full width at half-maximum (FWHM) value for the peaks was 0.17 nm, meaning that the splitting of the aluminum ground state could be easily detected.
Figure 9. The spectra from the laboratory study of dry generated (a) and wet generated (b) kaolinite particles. Both spectra consists of ca. 10 averaged particle hits and are divided with the background signal from ambient air.
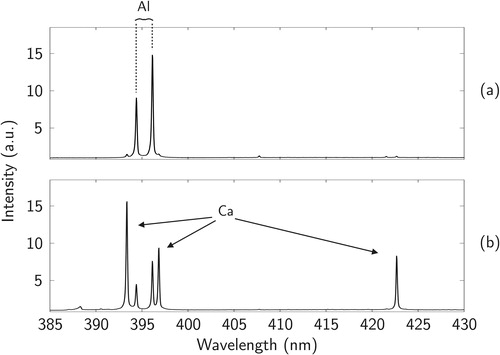
Residual particles from a wet generation source reach up to the Rayleigh limit charge (Järvinen et al. Citation2014), thus making the trapping efficient even for submicron particles. However, the initial droplet size is usually in the size range of tens of micrometers, (e.g., Berglund and Liu Citation1973; Järvinen and Toivonen Citation2016; Udey, Jones, and Farquar Citation2013), meaning that with a 1 µm residual particle the possible impurities in the carrier liquid condensate with a factor of 103–106 considering mass. Thus, when measuring from a droplet-generated source, the spectrum from “pure” droplet residuals has to be measured as a background reference, as in Saari et al. (Citation2016). If the particle contains only small amounts of the elements also present in the contamination source, it might be challenging to detect them from the background signal. When analyzing directly from airborne particles, impurities are not likely to be present, as can be seen from .
Effectively, a 100% hit rate (i.e., particle hits/amount of laser pulses) was achieved with the ambient sampling system for particles larger or equal to 1 µm in aerodynamic diameter. The analysis rate was about 1 particle/min at an ambient concentration range of 1–10 particles/cm3, which is of the same order with the timed ablation system presented by Maeng et al. (Citation2017) for the concentration range in question. In continuous-flow systems operating at low concentrations, long waiting times causing pulse laser instability and/or the limited operational cycle of the laser might cause decrease in the hit rate and thus in the analysis speed (Maeng et al. Citation2017; Manninen et al. Citation2008; Järvinen, Saarela, and Toivonen Citation2013). However, for larger (>500 particles/cm3) concentrations, such system provides more particle hits in time unit, compared to the EDB-LIBS. Automated operation of the EDB-LIBS could however lead to an arbitrarily low concentration limit and to faster analysis rate compared to the manual operation.
4. Conclusions
A novel technique capable of analyzing of single particles elemental composition from ambient air and low concentrations (1 ) was presented. It has great potential for any applications that require real-time single particle elemental characterization especially for low ambient concentrations. The method is based on electrodynamic balance (EDB) combined with laser-induced breakdown spectroscopy (LIBS). To accomplish ambient electrodynamic trapping of non-precharged particles, an aerosol charger was designed, prepared and characterized. With the known charge distribution, the performance of the EDB could be characterized using realistic charge values. A threshold value for the stable trapping of corona-charged particles was derived numerically and verified experimentally. Still, the main limiting factor of the trapping procedure is the charging state, which diminishes as a function of particle size. Therefore, the lower limit of the ambient EDB-LIBS analysis method is at 1 µm of particle diameter.
Based on the laboratory experiments, the background signal that was present in wet generation method diminished when sampling dry generated particles from ambient air. This phenomena was expected, since an evaporating droplet loses the majority of its mass in pure water, leaving the impurities condensing in the residual with a factor of around 103–106 in mass concentration. When measuring particles trapped directly from ambient air, this interference is virtually eliminated. This improves the sensitivity of the method significantly.
Ongoing and future work with the method consists of automation and finding ways to go further below 1 µm in particle size. Preliminary experimental results stand that amplifying the AC-voltage on the electrodes enables the trapping of sub-micrometer particles, but LIBS spectra from such particles are yet to be collected. Ongoing work also consists of condensation growing the particles before charging them to enhance the charging state closer to the Rayleigh limit. Automated timing of the trapping procedure might enhance the trapping efficiency further to arbitrary low concentrations, since the only limiting factor concentrationwise at the moment is the manual operation of the trapping. Once automated, the technique is to be prepared to a field-deployable instrument for ambient measurements.
Funding
This work was supported by the Arctic Academy Program “ARKTIKO” of Academy of Finland under grant No 286558, by the Maj and Tor Nessling Foundation, and by the Academy of Finland Flagship Program, Photonics Research and Innovation (PREIN), decision 320165.
Supplemental Material
Download PDF (4.4 MB)References
- Aardahl, C.L., R. Vehring, R. Weber, G. Schweiger, E.J. Davis, and A. Wiedensohler. 1997. Electrodynamic trapping of aerocolloidal particles: experimental and theoretical trapping limits. J. Colloid Interface Sci. 192 (1):228–37. doi:10.1006/jcis.1997.5023.
- Berglund, R.N., and B.Y.H. Liu. 1973. Generation of monodisperse aerosol standards. Environ. Sci. Technol. 7 (2):147–53. doi:10.1021/es60074a001.
- Calvo, A.I., C. Alves, A. Castro, V. Pont, A.M. Vicente, and R. Fraile. 2013. Research on aerosol sources and chemical composition: Past, current and emerging issues. Atmos. Res. 120:1–28. doi:10.1016/j.atmosres.2012.09.021.
- Charlson, R.J., J.H. Seinfeld, A. Nenes, M. Kulmala, A. Laaksonen, and M.C. Facchini. 2001. Reshaping the theory of cloud formation. Science 292 (5524):2025–6. doi:10.1126/science.1060096.
- Chen, D.R., D.Y.H. Pui, D. Hummes, H. Fissan, F.R. Quant, and G.J. Sem. 1998. Design and evaluation of a nanometer aerosol differential mobility analyzer (Nano-DMA). J. Aerosol Sci. 29 (5–6):497–509. doi:10.1016/S0021-8502(97)10018-0.
- Contreras, V., R. Valencia, J. Peralta, H. Sobral, M.A. Meneses-Nava, and H. Martinez. 2018. Chemical elemental analysis of single acoustic-levitated water droplets by laser-induced breakdown spectroscopy. Opt. Lett. 43 (10):2260–3. doi:10.1364/OL.43.002260.
- Davis, E.J. 2011. Electrodynamic levitation of particles. In Aerosol measurement: Principles, techniques, and applications, ed. P. Kulkarni, P.A. Baron, and K. Willeke, 3rd ed., 417–434. Hoboken, NJ: John Wiley & Sons.
- Davis, E.J. 1985. Electrodynamic balance stability characteristics and applications to the study of aerocolloidal particles. Langmuir. 1 (3):379–87. doi:10.1021/la00063a021.
- DeMott, P.J., A.J. Prenni, X. Liu, S.M. Kreidenweis, M.D. Petters, C.H. Twohy, M.S. Richardson, T. Eidhammer, and D.C. Rogers. 2010. Predicting global atmospheric ice nuclei distributions and their impacts on climate. Proc. Natl. Acad. Sci. USA. 107 (25):11217–22. doi:10.1073/pnas.0910818107.
- Dhaniyala, S., M. Fierz, J. Keskinen, and, M. Marjamäki. 2011. Instruments based on electrical detection of aerosols. In Aerosol measurement: Principles, techniques, and applications, ed. P. Kulkarni, P.A. Baron, and K. Willeke, 3rd ed., 393–416. Hoboken, NJ: John Wiley & Sons.
- Diwakar, P., P. Kulkarni, and M.E. Birch. 2012. New approach for near-real-time measurement of elemental composition of aerosol using laser-induced breakdown spectroscopy. Aerosol Sci. Technol. 46 (3):316–32. doi:10.1080/02786826.2011.625059.
- Essien, M., L.J. Radziemski, and J. Sneddon. 1988. Detection of cadmium, lead and zinc in aerosols by laser-induced breakdown spectrometry. J. Anal. Atom. Spectrom. 3 (7):985–8. doi:10.1039/ja9880300985.
- Fletcher, R.A., N.W.M. Ritchie, I.M. Anderson, and J.A. Small. 2011. Microscopy and microanalysis of individual collected particles. In Aerosol measurement: Principles, techniques, and applications, ed. P. Kulkarni, P.A. Baron, and K. Willeke, 3rd ed., 179–232. Hoboken, NJ: John Wiley & Sons.
- Fortes, F.J., A. Fernández-Bravo, and J. Laserna. 2014. Chemical characterization of single micro-and nano-particles by optical catapulting–optical trapping–laser-induced breakdown spectroscopy. Spectrochim. Acta Part B 100:78–85. doi:10.1016/j.sab.2014.08.023.
- Frickel, R.H., R.E. Shaffer, and J.B. Stamatoff. 1978. Chambers for the electrodynamic containment of charged aerosol particles: ARCSL-TR 77041. Army Armament Research and Development Command Aberdeen Proving Ground MD Chemical Systems Lab.
- Fuchs, N.A. 1963. On the stationary charge distribution on aerosol particles in a bipolar ionic atmosphere. Geofisica Pura Appl. 56 (1):185–93. doi:10.1007/BF01993343.
- Gallou, G., J.B. Sirven, C. Dutouquet, O. L. Bihan, and E. Frejafon. 2011. Aerosols analysis by LIBS for monitoring of air pollution by industrial sources. Aerosol Sci. Technol. 45 (8):918–26. doi:10.1080/02786826.2011.566899.
- Hahn, D.W., and M.M. Lunden. 2000. Detection and analysis of aerosol particles by laser-induced breakdown spectroscopy. Aerosol Sci. Technol. 33 (1–2):30–48. doi:10.1080/027868200410831.
- Hamzaoui, S., R. Khleifia, N. Jaïdane, and Z. Ben Lakhdar. 2011. Quantitative analysis of pathological nails using laser-induced breakdown spectroscopy (LIBS) technique. Lasers Med. Sci. 26 (1):79–83. doi:10.1007/s10103-010-0821-x.
- Hartung, W.H., and C.T. Avedisian. 1992. On the electrodynamic balance. Proc. Roy. Soc. Lond. Ser A: Math. Phys. Sci. 437 (1900):237–66.
- Heinisch, C., J.B. Wills, J.P. Reid, T. Tschudi, and C. Tropea. 2009. Temperature measurement of single evaporating water droplets in a nitrogen flow using spontaneous Raman scattering. Phys. Chem. Chem. Phys. 11 (42):9720–8. doi:10.1039/b908555f.
- Hewitt, G.W. 1957. The charging of small particles for electrostatic precipitation. Trans. AIEE, Part I: Commun. Electron. 76 (3):300–6. doi:10.1109/TCE.1957.6372672.
- Hinds, W.C. 1999. Aerosol technology: Properties, behavior, and measurement of airborne particles. 2nd ed. New York, NY: John Wiley & Sons.
- Hoose, C., and O. Möhler. 2012. Heterogeneous ice nucleation on atmospheric aerosols: A review of results from laboratory experiments. Atmos. Chem. Phys. 12 (20):9817–54. doi:10.5194/acp-12-9817-2012.
- Järvinen, A., M. Aitomaa, A. Rostedt, J. Keskinen, and J. Yli-Ojanperä. 2014. Calibration of the new electrical low pressure impactor (ELPI+). J. Aerosol Sci. 69:150–9. doi:10.1016/j.jaerosci.2013.12.006.
- Järvinen, A., P. Heikkilä, J. Keskinen, and J. Yli-Ojanperä. 2017. Particle charge-size distribution measurement using a differential mobility analyzer and an electrical low pressure impactor. Aerosol Sci. Technol. 51 (1):20–9. doi:10.1080/02786826.2016.1256469.
- Järvinen, A., J. Keskinen, and J. Yli-Ojanperä. 2018. Extending the Faraday cup aerosol electrometer based calibration method up to 5 μm. Aerosol Sci. Technol. 52 (8):828–40. doi:10.1080/02786826.2018.1472742.
- Järvinen, S.T., J. Saarela, and J. Toivonen. 2013. Detection of zinc and lead in water using evaporative preconcentration and single-particle laser-induced breakdown spectroscopy. Spectrochim. Acta Part B Atom. Spectrosc. 86:55–9. doi:10.1016/j.sab.2013.04.010.
- Järvinen, S.T., S. Saari, J. Keskinen, and J. Toivonen. 2014. Detection of Ni, Pb and Zn in water using electrodynamic single-particle levitation and laser-induced breakdown spectroscopy. Spectrochim. Acta Part B 99:9–14. doi:10.1016/j.sab.2014.06.007.
- Järvinen, S.T., and J. Toivonen. 2016. Analysis of single mass-regulated particles in precisely controlled trap using laser-induced breakdown spectroscopy. Opt. Expr. 24 (2):1314–23. doi:10.1364/OE.24.001314.
- Kaminski, H., T.A.J. Kuhlbusch, H. Fissan, L. Ravi, H.G. Horn, H.S. Han, R. Caldow, and C. Asbach. 2012. Mathematical description of experimentally determined charge distributions of a unipolar diffusion charger. Aerosol Sci. Technol. 46 (6):708–16. doi:10.1080/02786826.2012.659360.
- Kim, G., K. Kim, H. Maeng, H. Lee, and K. Park. 2019. Development of aerosol-LIBS (laser induced breakdown spectroscopy) for real-time monitoring of process-induced particles. Aerosol Air Qual. Res. 19 (3):455–60. doi:10.4209/aaqr.2018.08.0312.
- Kim, K.H., E. Kabir, and S. Kabir. 2015. A review on the human health impact of airborne particulate matter. Environ. Int. 74:136–43. doi:10.1016/j.envint.2014.10.005.
- Knopf, D.A., P.A. Alpert, and B. Wang. 2018. The role of organic aerosol in atmospheric ice nucleation: A review. ACS Earth Space Chem. 2 (3):168–202. doi:10.1021/acsearthspacechem.7b00120.
- Laserna, J., J.M. Vadillo, and P. Purohit. 2018. Laser-induced breakdown spectroscopy (LIBS): Fast, effective, and agile leading edge analytical technology. Appl. Spectrosc. 72 (1_suppl):35–50. [Mismatch] doi:10.1177/0003702818791926.
- Laskin, A., D.J. Gaspar, W. Wang, S.W. Hunt, J.P. Cowin, S.D. Colson, and B.J. Finlayson-Pitts. 2003. Reactions at interfaces as a source of sulfate formation in sea-salt particles. Science 301 (5631):340–4. doi:10.1126/science.1085374.
- Liu, B.Y.H., and D.Y.H. Pui. 1977. On unipolar diffusion charging of aerosols in the continuum regime. J. Colloid Interface Sci. 58 (1):142–9. doi:10.1016/0021-9797(77)90377-0.
- Maeng, H., H. Chae, H. Lee, G. Kim, H. Lee, K. Kim, J. Kwak, G. Cho, and K. Park. 2017. Development of laser-induced breakdown spectroscopy (LIBS) with timed ablation to improve detection efficiency. Aerosol Sci. Technol. 51 (9):1009–15. doi:10.1080/02786826.2017.1344352.
- Manninen, A., M. Putkiranta, A. Rostedt, J. Saarela, T. Laurila, M. Marjamäki, J. Keskinen, and R. Hernberg. 2008. Instrumentation for measuring fluorescence cross sections from airborne microsized particles. Appl. Opt. 47 (2):110–5. doi:10.1364/AO.47.000110.
- Murray, B. J., D. O'Sullivan, J. D. Atkinson, and M. E. Webb. 2012. Ice nucleation by particles immersed in supercooled cloud droplets. Chem. Soc. Rev. 41 (19):6519–54. doi:10.1039/c2cs35200a.
- Nash, D.G., T. Baer, and M. V. Johnston. 2006. Aerosol mass spectrometry: An introductory review. Int. J. Mass Spectrom. 258 (1–3):2–12. doi:10.1016/j.ijms.2006.09.017.
- Panne, U., R.E. Neuhauser, M. Theisen, H. Fink, and R. Niessner. 2001. Analysis of heavy metal aerosols on filters by laser-induced plasma spectroscopy. Spectrochim. Acta Part B 56 (6):839–50. doi:10.1016/S0584-8547(01)00209-9.
- Paramonov, M., S. van Dusseldorp, E. Gute, J.P.D. Abbatt, P. Heikkilä, J. Keskinen, X. Chen, K. Luoma, L. Heikkinen, and L. Hao. 2019. Condensation/immersion mode ice nucleating particles in a boreal environment. Atmos. Chem. Phys. Discuss. 2019:1–33.
- Park, D., M. An, and J. Hwang. 2007. Development and performance test of a unipolar diffusion charger for real-time measurements of submicron aerosol particles having a log-normal size distribution. J. Aerosol Sci. 38 (4):420–30. doi:10.1016/j.jaerosci.2007.01.003.
- Park, K., G. Cho, and J.H. Kwak. 2009. Development of an aerosol focusing-laser induced breakdown spectroscopy (aerosol focusing-LIBS) for determination of fine and ultrafine metal aerosols. Aerosol Sci. Technol. 43 (5):375–86. doi:10.1080/02786820802662947.
- Qi, C., C. Asbach, W.G. Shin, H. Fissan, and D.Y.H. Pui. 2009. The effect of particle pre-existing charge on unipolar charging and its implication on electrical aerosol measurements. Aerosol Sci. Technol. 43 (3):232–40. doi:10.1080/02786820802587912.
- Rai, N.K., and A.K. Rai. 2008. LIBS: An efficient approach for the determination of Cr in industrial wastewater. J. Hazard. Mater. 150 (3):835–8. doi:10.1016/j.jhazmat.2007.10.044.
- Rostedt, A., M. Marjamäki, and J. Keskinen. 2009. Modification of the ELPI to measure mean particle effective density in real-time. J. Aerosol Sci. 40 (9):823–31. doi:10.1016/j.jaerosci.2009.05.002.
- Saari, S., S. Järvinen, T. Reponen, J. Mensah-Attipoe, P. Pasanen, J. Toivonen, and J. Keskinen. 2016. Identification of single microbial particles using electro-dynamic balance assisted laser-induced breakdown and fluorescence spectroscopy. Aerosol Sci. Technol. 50 (2):126–32. doi:10.1080/02786826.2015.1134764.
- Schleicher, N.J., S. Norra, F. Chai, Y. Chen, S. Wang, K. Cen, Y. Yu, and D. Stüben. 2011. Temporal variability of trace metal mobility of urban particulate matter from Beijing: A contribution to health impact assessments of aerosols. Atmos. Environ. 45 (39):7248–65. doi:10.1016/j.atmosenv.2011.08.067.
- Tjärnhage, T., P. Gradmark, A. Larsson, A. Mohammed, L. Landström, E. Sagerfors, P. Jonsson, F. Kullander, and M. Andersson. 2013. Development of a laser-induced breakdown spectroscopy instrument for detection and classification of single-particle aerosols in real-time. Opt. Commun. 296:106–8. doi:10.1016/j.optcom.2013.01.044.
- Turpin, B.J., J.J. Huntzicker, and S. V. Hering. 1994. Investigation of organic aerosol sampling artifacts in the Los Angeles basin. Atmos. Environ. 28 (19):3061–71. doi:10.1016/1352-2310(94)00133-6.
- Udey, R.N., A.D. Jones, and G.R. Farquar. 2013. Aerosol and microparticle generation using a commercial inkjet printer. Aerosol Sci. Technol. 47 (4):361–72. doi:10.1080/02786826.2012.752790.
- Unger, L., D. Boulaud, and J.P. Borra. 2004. Unipolar field charging of particles by electrical discharge: Effect of particle shape. J. Aerosol Sci. 35 (8):965–79. doi:10.1016/j.jaerosci.2004.01.006.
- Vaniman, D.T., D.L. Bish, D.W. Ming, T.F. Bristow, R. V. Morris, D.F. Blake, S.J. Chipera, S.M. Morrison, A.H. Treiman, E.B. Rampe, MSL Science Team, et al. 2014. Mineralogy of a mudstone at Yellowknife Bay, Gale Crater, Mars. Science 343 (6169):1243480. doi:10.1126/science.1243480.
- Vehring, R., C.L. Aardahl, G. Schweiger, and E.J. Davis. 1998. The characterization of fine particles originating from an uncharged aerosol: Size dependence and detection limits for Raman analysis. J. Aerosol Sci. 29 (9):1045–61. doi:10.1016/S0021-8502(98)80002-5.
- Vergara-Temprado, J., A.K. Miltenberger, K. Furtado, D.P. Grosvenor, B.J. Shipway, A.A. Hill, J.M. Wilkinson, P.R. Field, B.J. Murray, and K.S. Carslaw. 2018. Strong control of Southern Ocean cloud reflectivity by ice-nucleating particles. Proc. Natl. Acad. Sci. USA. 115 (11):2687–92. doi:10.1073/pnas.1721627115.
- Xiong, G., S. Li, Y. Zhang, S.G. Buckley, and D.T. Stephen. 2016. Phase-selective laser-induced breakdown spectroscopy of metal-oxide nanoparticle aerosols with secondary resonant excitation during flame synthesis. J. Anal. Atom. Spectrom. 31 (2):482–91. doi:10.1039/C5JA00186B.
- Yli-Ojanperä, J., J.M. Mäkelä, M. Marjamäki, A. Rostedt, and J. Keskinen. 2010. Towards traceable particle number concentration standard: Single charged aerosol reference (SCAR). J. Aerosol Sci. 41 (8):719–28. doi:10.1016/j.jaerosci.2010.04.012.