
 ?Mathematical formulae have been encoded as MathML and are displayed in this HTML version using MathJax in order to improve their display. Uncheck the box to turn MathJax off. This feature requires Javascript. Click on a formula to zoom.
Abstract
Chinese cooking produces large numbers of particles that can cause both indoor and outdoor air quality problems. To reduce the extraction of particles to the outdoor air, this investigation studied capture efficiency of a rotating disk in an exhaust hood. The studies were performed experimentally in a wind tunnel and numerically by computational fluid dynamics (CFD) models with the Lagrangian method for tracking particle trajectories. The experimental data were used to identify the best turbulence model among the three tested in the CFD simulations. The results show that the capture efficiency increased with disk rotation speed and particle size but decreased with exhaust airflow rate. The CFD simulations provided detailed information about the mechanisms by which particles of different sizes were captured by the rotating disk. CFD was then used to explore two methods for improving the capture efficiency: adding more wires to the middle and outer zones of the disk, and using two layers of disks. Both methods can increase the capture efficiency of the rotating disk at an acceptable pressure loss.
Copyright © 2020 American Association for Aerosol Research
EDITOR:
1. Introduction
Particles generated during cooking are an important source of indoor and outdoor air pollution. The average number and mass concentration of PM2.5 in Chinese kitchens were found to increase by more than ten times during cooking in comparison with non-cooking hours (Gao et al. Citation2013; See and Balasubramanian Citation2006b). Epidemiological results demonstrated a significant link between negative health effects and exposure to particulate matter from cooking (Lu et al. Citation2019; Metayer et al. Citation2002; Pope III 2000; Sze-To et al. Citation2012; Wang et al. Citation2017). The range hoods used in present Chinese homes and restaurants discharge cooking fumes to the outdoor environment without a disposal process, resulting in severe haze (Zhu et al. Citation2014). Xiao et al. (Citation2018) investigated contaminant levels at a fume outlet outside a Chinese restaurant and found that the PM2.5 level increased by up to 15.9 times, and the PM10 level by 3.6 times, during cooking. Thus, to reduce outdoor air pollution, it is important to remove particle matter during cooking.
To effectively remove particle matter, one should understand the particle emission rate and size. Different cooking styles lead to different particle emission rates (Kang et al. Citation2019; See and Balasubramanian Citation2006a; See and Balasubramanian Citation2008). Cooking temperature and oil type are the primary factors in particle concentration and size distribution. Particle size increases with cooking temperature, and oil with a higher smoke temperature disperses fewer particles (Torkmahalleh et al. Citation2012). The particle size can vary from nanometers to tens of microns. Previous studies focused mainly on the number concentration of ultrafine particles (<0.1 µm) or PM 2.5 because they contribute to more than 90% of the number concentration (Li, Lin, and Jenq Citation1993). However, when the particle size is small, a high number concentration does not contribute greatly to the particle mass. On the other hand, a small number of larger particles can account for a high proportion of the particle mass (Welch and Kuehn Citation2003). However, particles with a diameter larger than 18 µm are too heavy to remain airborne and can easily drop out of the airstream (ASHRAE Standard 62.1 Citation2007). Thus, one should study particles with diameters between 2.5 and 18 µm for their impact on outdoor air pollution.
A range hood is typically employed to remove particulate matter from a kitchen. The hood performance depends on the filtering technology used, the exhaust airflow rate, aerodynamic design, conditions in the indoor space, etc. (Lunden, Delp, and Singer Citation2015; Rim et al. Citation2012; Singer et al. Citation2012). Capture efficiency is a frequent criterion for hood performance (Delp and Singer Citation2012). The most important part of a hood is its grease-removal system, which reduces the volume of grease in the exhaust airstream. The system may use a static steel mesh filter, a baffle filter, a cyclonic filter, or a rotating filter (Rajendran and Otzen Citation1990). The static mesh filter is used in the majority of hoods on the market. Grease particles impinge upon and are collected by the filter, while interstices permit clean air to pass through. The filter requires frequent maintenance to prevent clogging by particles entrained in the airstream. The baffle filter consists of a series of overlapping baffles that force the grease-laden exhaust air to change direction several times within the filter. The grease is removed from the air stream by centrifugal force. However, the baffle system has a very high pressure drop (Alexander and Salpietra Citation2012; Kwok and Robison Citation2011). The cyclonic filter also separates unwanted grease by centrifugal force. Fumes are typically injected tangentially into the cyclonic separator to form a circular flow. The centrifugal forces act on particles and force them toward the perimeter of the separation chamber where the grease is collected (Antoun Citation1999; Huber Citation2005). The efficiency of the mesh and baffle filters is lower than 10% when the particle size is smaller than 3 micron and 25% for 10 micron particles. The efficiency of the cyclonic filter can be 85% for 10 micron particles. However, all the above filters require repeated cleaning to avoid clogging. A rotating filter, meanwhile, can theoretically improve the efficiency with enhanced centrifugal force, since the rotating part increases the probability of collision between particles and filter media. The particles that collect on the filter accumulate to form large droplets and can be easily removed; thus, the filter has a self-cleaning ability.
There are two different rotating filters on the market: one with a fine net filter that has a bore diameter of less than 2 mm, and the other with radially twined wires. Li et al. (Citation2017) observed a high capture efficiency with the fine net filter when the rotating speed was high and the rotating mesh filter was dense. This device could create a very high pressure drop, although little information is available. Meanwhile, for filters with rotating radially twined wires, very few studies have been published. Because of the wires are placed sparsely, the capture efficiency with the rotating radially twined wires may not be very high, but the pressure drop would be low as well. Sun (Citation2009) found that the capture efficiency for 8 micron particles by a hood with this type of filter was only 20%. Therefore, a hood with rotating radially twined wires (hereafter a hood with a rotating filter disk) should be studied with the goal of improving its efficiency.
The objective of this investigation was to study the capture mechanism of a hood with a rotating filter disk. In this article, we will examine various parameters that could significantly affect the capture efficiency and pressure drop.
2. Methods
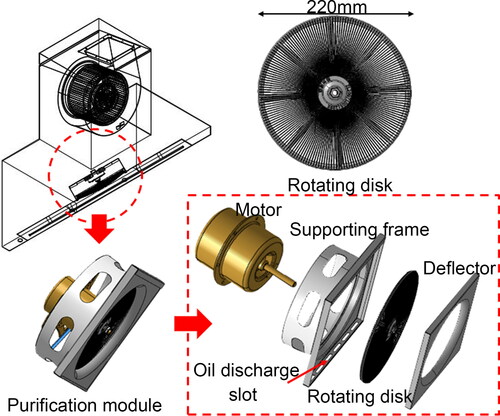
Our study focused on a range hood with a rotating filter disk. The rotating disk was a component of the purification module, which also included a deflector and a motor as shown in . The deflector was used to induce the airflow, and the motor rotated the disk. The rotating disk consisted of two layers of fine metal wires twined radially. The disk used for the present study consisted of 160 wires per layer and eight supporting bars between the two layers. When the disk rotated at a high speed, particles in the air stream from the cooking fumes would collide with and be captured by the wires. Because of the high rotation speed, the centrifugal force would move the captured particles or grease to the outer ends of the wires. The grease could then be collected along the perimeter of the supporting frame and removed easily without frequent maintenance.
Figure 1. The purification module in a kitchen exhaust hood.
The study of capture efficiency by a hood can be conducted through numerical simulations by computational fluid dynamics (CFD) or experimental measurements in a laboratory. The experimental measurements are reliable, but they are expensive and time-consuming, since it is not easy to change the hood structure. Meanwhile, the CFD simulations can produce informative results, but the model used may not be reliable. Thus, the optimal approach is to conduct limited experimental measurements to obtain data for validating the CFD model, and to use the CFD model for further analysis of the performance of the rotating disk.
2.1. Experimental setup
Our experiment was conducted in a large laboratory with dimensions of 10 m × 8 m × 5 m and stable thermo-fluid conditions. The room air temperature was controlled at 23 ± 1 °C and relative humidity at 42 ± 2%. Ventilation conditions were stable during the experiments (doors and windows were closed, and the mechanical ventilation through two vents on the ceiling was operational). shows a 4.8 m-long wind tunnel test rig that was used for the present study; it was placed in the center of the laboratory. The upstream and downstream sections were symmetrical, each with a duct area of 0.4 m × 0.4 m and a length of 0.8 m. The square ducts were connected to a nozzle or diffuser that was 0.4 m long and had a diameter of 0.23 m at the other end. The nozzle and diffuser were then linked by a 0.6 m-long round pipe as the test section. The purification module, as shown in , was inserted in the middle of the round pipe. All the connections were well sealed to prevent air leakage. At the end of the wind tunnel in the downstream region, a centrifugal fan was installed to extract air through the tunnel. The air velocity in the round duct section could be controlled at 0 to 5 m/s. The rotation speed of the disk could also be controlled by adjusting the electrical voltage.
Figure 2. (a) Wind tunnel test rig for the rotating disk. (b) Oil particle generator. (c) Velocity measurement points at Sections #1 and #2.
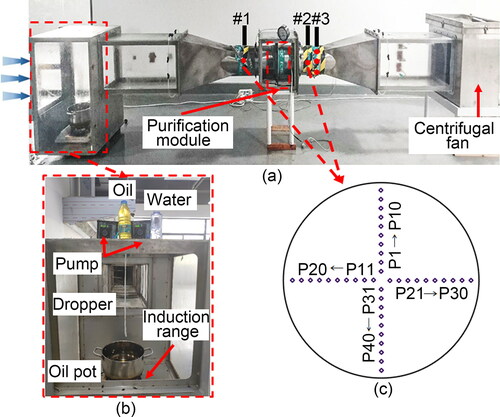
An oil droplet generator was placed in the upstream section of the wind tunnel as shown in . Oil droplets were generated with the use of a peristaltic pump connected to a bottle of water. The pump caused water to drip continuously into a stainless-steel pot filled with corn oil at a temperature between 270 and 280 °C. The oil temperature was monitored by an infrared thermal camera. The water flow rate was 0.025 ml/s. The stainless-steel pot was 25 cm in diameter and 14 cm in depth, and it was heated by an induction range with adjustable heating power. The pot initially contained 800 ml oil, and a second peristaltic pump connected to a bottle of oil was used to continually refill the pot and maintain a constant oil volume. The oil drip rate was 0.076 ml/s. lists the technical specifications of the instruments used in the experiment.
Table 1. Instrument specifications.
An aerosol spectrometer (Model Promo 3000 from Palas, Karlsruhe, baden-wurttemberg, Germany) was used for measuring particle size distribution and number concentration. The spectrometer had 128 size channels with four measuring ranges. The measurement was based on the light scattering effect and Mie dispersion theory. Since the Sauter diameter of particles was detected, the mass concentration can be calculated by the control unit as
(1)
(1)
where Cmi represents mass of particles within the size channel i, ni the measured number of particles within the channel i, xi arithmetic medium diameter in size channel i, ρ particle diameter, and Vm measuring volume. Vm is defined as
(2)
(2)
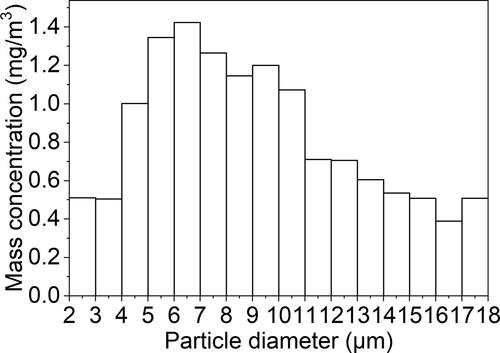
where u represents particle velocity, s optical cross-section area of the sensor and tmeas measurement duration (Koivisto et al. Citation2012; Song and Hu Citation2017). The size range in our experiment was from 2 to 105 microns, and the sampling frequency was 1 Hz. As shown in , the sampling point was at the center of Section #1, which was in the upstream section at a distance of 0.25 m from the rotating disk. shows the mean value of mass concentration and size distribution of the oil droplets from eight repeated measurements. The particle generator was stable, generating <8 micron particles with a standard deviation of <0.005, 8–12 micron particles with a standard deviation <0.01 and 12–18 micron particles with a standard deviation <0.015. The reason was that particle number larger than 12 micron was lower than 1 P/cm3, compared with 2 micron particles at 65 P/cm3. The extreme low concentration made random error higher. In addition, we believe that larger particles were more likely to be affected by the gravitational deposition effect, so the particles larger than 12 micron were excluded. The measured particles had a peak mass concentration at 6.5 microns. This study selected particles in the 3–11 micron range for evaluating the capture efficiency of the rotating disk.
Figure 3. Mean value of mass concentration and size distribution of the oil droplets from eight repeated measurements.
According to Chinese standard GB/T 17713-2011, the recommended minimum airflow rate for kitchen exhaust hoods is 600 m3/h. Meanwhile, IEC 2011 recommends a minimum airflow rate of 420 m3/h based on the odor reduction factor (Chen et al. Citation2018). Our research studied exhaust rates of 320, 450 and 600 m3/h, taking into account the significant fumes generated by Chinese cooking. The corresponding air velocities through the round pipe section were 2.16, 3.02 and 4.00 m/s, respectively, measured at Section #1. Since the rotating disk can influence the airflow distribution in the downstream region, the air velocity was also measured at Section #2, which was 0.25 m downstream from the disk. A hot-wire anemometer (Model 9545 from TSI, USA) was used for the air velocity measurements. There were a total of 40 measurement points for air velocity in each section, as shown in . Since the air velocity fluctuated significantly, it was measured for 10 min at each point with a measuring frequency of 1 Hz. All the data along each radius were averaged to obtain the area-averaged velocity. Disk rotation speeds of 800, 1500 and 2050 rpm were investigated.
The particle concentrations were measured at three different positions in Section #3, which was 0.35 m downstream from the disk. The measurement took 8 min at each position. The capture efficiency, CE, of the rotating disk was determined by
(3)
(3)
where Con represents the particle mass concentrations when the disk rotated at a specific speed, and Coff the particle mass concentrations when the disk did not rotate.
2.2. CFD model
CFD can predict turbulent flows by direct numerical simulation (DNS), large-eddy simulation (LES), and Reynolds-averaged Navier-Stokes (RANS) equation simulation with turbulence models (Ansys Citation2013). DNS resolves the whole spectrum of turbulent scales without any modeling, making it unfeasible for flow through a rotating disk because the required grid number would be too high and the computing time too long. Whereas small eddies are modeled, in LES large eddies are resolved directly Resolving only the large eddies allows the use of much coarser mesh and larger time steps in LES than in DNS. However, LES still requires significantly finer meshes than those customarily used for RANS calculations. As a result, the computational cost associated with LES is normally one or two orders of magnitude higher than that for steady RANS calculations in terms of computer memory and CPU time (Zhai et al. Citation2007). Therefore, LES was not affordable for this project.
RANS equations govern the transport of the averaged flow quantities over the whole range of the scales of turbulence being modeled. RANS equation modeling thus greatly reduces the required computational effort and resources, and was therefore selected for this study. In accordance with the modeling approach for Reynolds stresses, RANS turbulence models are further divided into eddy-viscosity models and Reynolds stress models.
Eddy-viscosity models employ the Boussinesq hypothesis to relate the Reynolds stresses to the mean velocity gradients:
(4)
(4)
The most popular eddy-viscosity models are the k–ε models. The advantage of this approach is the comparatively low cost associated with the computation of the turbulent viscosity, µt. In the case of the k–ε models, two additional transport equations (for turbulence kinetic energy, k, and turbulence dissipation rate, ε) are solved (Ansys, Citation2013). The µt is computed by combining k and ε as follows:
(5)
(5)
where Cµ is a constant. The disadvantage of the Boussinesq hypothesis as presented is that it assumes that µt is isotropic, which may not be true for our study. In contrast, Reynolds stress models do not use the isotropic eddy-viscosity hypothesis; they close the RANS equations by solving transport equations for the Reynolds stresses, together with an equation for the dissipation rate. Thus, seven additional transport equations are solved for three-dimensional flows. This study compared simulations using Reynolds stress model (Gibson and Launder Citation1978), the standard k–ε model (Launder and Spalding Citation1983) and re-normalization group (RNG) k–ε model (Yakhot and Orszag Citation1986) for the flow through the rotating disk. Note that not all the turbulent models should be tested. For example, realizable k–ε model would produce nonphysical turbulent viscosities and unreliable results when the computational domain contains rotating and stationary fluid zones (Ansys Citation2013). The content of rotating and stationary fluid will be discussed later with the corresponding experimental data. The best model could then be identified for further study.
This investigation used the Gambit 2.4.6 software program (GAMBIT 2 Citation2005) to create the mesh for the disk geometry. Since the diameter of the wires was very thin at 0.28 mm, the mesh had very fine grid distribution around the wires and a large grid number. By considering the periodic nature of the disk wires and supporting bar geometrically, this study created a mesh model for one-eighth of the disk and then used periodic boundary conditions to construct the whole purification module, as shown in . A grid-independence study with 3.42, 5.86 and 8.60 million cell grids found that the simulation should use at least 5.86 million tetrahedral cells. The grid-independence test was shown in . shows the grid around the wires, and the cell skewness was below 0.85. The mesh surrounding the wires and the supporting bar was very fine because of the high-velocity gradients in these regions.
Figure 4. (a) Purification module used for simulations. (b) Grid-independence test. (c) Grid distribution of the vertical section in the module.
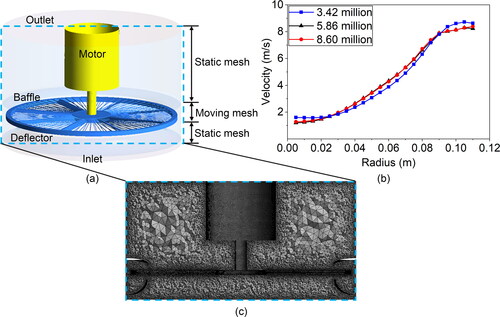
To simulate the rotating disk, this study used the multiple reference frame model and the sliding mesh method (Ansys Citation2013). The multiple reference frame model is a simple steady-state calculation method that reduces computational expense. The sliding mesh method was then used to solve the flow field as well as particle distribution since this method can deliver a truly time-dependent solution (Ashraf Ali et al. Citation2013). The multiple reference frame model used a rotating frame for the region containing the wires and support bar, while a stationary frame was applied to the nonmoving part as shown in . The flow in the rotating region was solved using the rotating framework, and the results served as the boundary conditions for the stationary region. At the same time, the solution from the stationary region was used as the boundary conditions for the rotating region. In a similar manner to that of the multiple reference frame model, the sliding mesh method divided the geometry into a rotating part and a stationary part. However, the mesh in the rotating region physically moved during the transient solution. After each time step, i.e., after each motion of the rotating mesh, the RANS and the mass continuity equations were solved iteratively (Appa, Deglon, and Meyer Citation2013; Hörmann, Suzzi, and Khinast Citation2011).
This investigation used a coupled algorithm to solve the pressure-velocity coupling, which can accelerate convergence; the PRESTO! scheme to discretize the pressure, considering the problem of swirl flow with a high pressure gradient; and the second-order upwind scheme to discretize the momentum equation. The inlet to the purification module was set as the velocity inlet, and the outlet as the pressure outlet. The numerical solving process was iterative until a converged solution was obtained. After 14,000 iterations, the mass continuity residual was lower than 1% of the mass flow rate through the rotating disk.
This study used the Eulerian–Lagrangian approach for solving particle motion with one-way coupling, which means that the particle phase had no impact on the airflow. Particles were injected into the flow domain through the inlet as shown in . Particle-to-particle interactions were neglected because the volume fraction of particles was low. When the particles entered the flow, their trajectories were governed by the particle momentum equation obtained directly from Newton’s second law (Zamankhan et al. Citation2006):
(6)
(6)
where v is the air velocity, vp the particle velocity, ρ the fluid density and is the density of the particle. The first term on the right-hand side of EquationEquation (6)
(6)
(6) represents the drag force, and the second term the buoyancy force. The drag force can be calculated by
(7)
(7)
where μ is the molecular viscosity of the fluid and
is particle diameter. The drag coefficient, CD, for smooth particles is
where
and
are constants that apply over several ranges of Re given by Morsi and Alexander (Citation1972). Re is the relative Reynolds number, which is defined as
(8)
(8)
The discrete random walk model was employed to model the turbulent dispersion of particles by integrating the trajectory equations for individual particles, using the instantaneous fluid velocity, along the particle path during the integration. The fluctuating velocity components are Gaussian distributed random values and are kept constant over an interval of time given by the characteristic lifetime of the eddies. The interaction of a particle with a succession of discrete stylized fluid-phase turbulent eddies was simulated. As soon as a particle hit a solid surface, it was considered trapped because of the high viscidity of oil fumes. The simulations were performed for particle diameters ranging from 3 to 11 microns. The particle emission number was determined by the grid number of the injection surface, which was 3156. By controlling the emission time, we released 9468 and 94,680 particles, respectively, and we found that the number of particles had no effect on the capture efficiency analysis. The capture efficiency was that the number of particles captured by the solid surface over the total number of particles entered the inlet.
This investigation calculated the time step size from the minimum mesh size divided by the highest speed of airflow in the domain. The time step size was 0.3 mm (around the wires)/27.4 m/s (around the tip of the wires), which equals 0.011 ms. We compared the results with three different time steps, 0.005, 0.01 and 0.02 ms, and found 0.01 ms to be sufficiently good. Approximately, 1500 steps were needed for the particles to either pass through or be trapped by the disk. A typical simulation took roughly two days of computing time on a workstation with 48 GB memory, a 64-bit operating system, a CPU with 12 cores and 24 threads and a 2.4 GHz processor.
3. Results
3.1. Validation of the CFD model
This investigation obtained nine sets of data on particle capture efficiency from the wind tunnel, for three air velocities and three disk rotation speeds; the data were then used for validating the CFD model. We selected the case with airflow rate of 10 m3/min (or 4.0 m/s mean axial air velocity), which corresponds to one of the common flow rates of hoods on the market. The rotation speed of the disk was 2050 rpm. shows the air velocity profiles measured at Section #2. The data reveal an asymmetrical velocity profile, which was due to the slight asymmetry of the disk installation in the wind tunnel. The results show that the greater the distance from the center in the radial direction, the higher the air velocity was. As displayed in red circle, the data were averaged for comparison with the CFD results in .
Figure 5. (a) Velocity measured in the wind tunnel at Section #2. (b) Comparison of the air velocity profiles predicted by the three turbulence models with the experimental data at Section #2. (c) Comparison of experimental and simulated capture efficiency versus particle diameter.
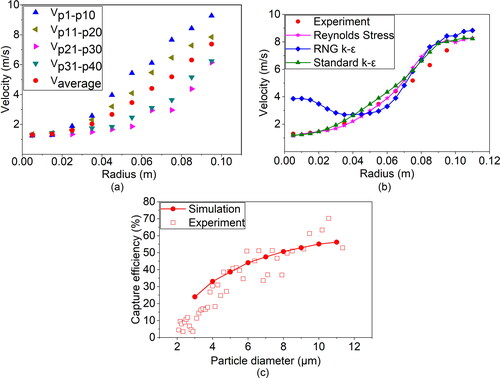
Because of the complex flow feature studied, this investigation used three popular turbulence models to simulate the airflow and compared the results. As shown in , the RNG k–ε model performed very poorly in predicting the air velocity distribution in the core region. The standard k–ε and RSM models yielded very similar results that were in reasonable agreement with the experimental data, although the RSM model seemed to perform slightly better. The RSM model provided the most accurate prediction within a radius of 0.07 m. In the far outer annular region, without experimental data, the RSM model would predict better air velocity if the experimental data could be extrapolated. Therefore, this study used the RSM model for further investigation.
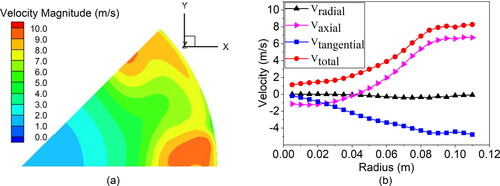
shows the velocity distribution calculated by CFD at Section #2. As with the measured data, the air velocity was lowest in the core region and increased with the radius. In the annular region, the air velocity was not uniform along the tangential direction, because of the supporting bar. By averaging the air velocity in the tangential direction, we obtained the radial, tangential, and axial air velocity components, as depicted in . The radial velocity was generally small, while the tangential velocity increased with the radius. As a result of the swirl effect, the flow in the core region was reversed, and thus the axial velocity was negative. In the annular region, where the flow was moving downstream, the axial velocity was positive.
Figure 6. (a) Computed air velocity distribution at Section #2 in the downstream region and (b) computed air velocity components in the radial direction.
compares the simulated capture efficiency with the measured data for different particle sizes. For larger sizes, the difference between the simulated and measured capture efficiency was higher. Many factors could have contributed to the discrepancy. For example, asymmetry in installation of the disk could lead to experimental error. The CFD simulations used many approximations that could also have contributed to the discrepancy. When large particles passed the rotating disk, the high-speed swirl effect could have caused them to collide with each other and coagulate to larger particles, and thus the capture efficiency in the experiment could exceed the simulated one. In contrast, small particles were less likely to coagulate.
The above comparison between the CFD results and experimental data confirmed that CFD with the RSM model could predict the air velocity distribution and particle capture efficiency in the test rig with acceptable accuracy. Therefore, we considered the CFD model validated, and it was used for further analysis in this investigation.
3.2. Mechanism of particle capture by a rotating disk
There are three basic mechanisms that lead to the capture of particles in a rotating disk medium. These are interception, inertial impaction, and Brownian diffusion. Brownian diffusion is only important for small particles (about 200 nm or less). Interception is important when the size of the particle and disk diameter are comparable. Inertial impaction becomes considerable when the particle’s momentum is not negligible. Within the size range of the particles analyzed, only inertial impaction (Rubenstein and Koehl Citation1977) was considered. Particles tended to follow the streamlines until the fluid was diverted and accelerated as it passed around the moving wires. Because of their own inertia, the particles would then deviate from the streamlines and collide with the wires. The deposition intensity by inertial impact for a static filter (Fuchs and Davies Citation1964) can be written as:
(9)
(9)
where ρp is the density of particles, ρm fluid density, Vo air velocity, df the diameter of the wires and dp particle diameter. The equation indicates that a small increase in particle diameter would lead to a large increase in the intensity of inertial impaction.
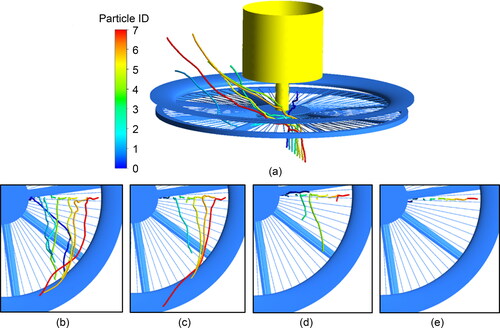
In order to better understand the mechanism of particle capture by a rotating disk, this study used the validated CFD model to calculate particle trajectories through the disk. shows the trajectories calculated for particles with different diameters (5, 10, 15, and 20 µm). The particles were injected at eight positions that were equally spaced along the radius on the inlet surface, namely, from r = 0.02 to 0.09 m, as shown in . The results illustrate the difficulty of capture by the wires when the particles were small. The capture efficiency increased with the particle size. As shown in , the number of particles captured by the wires of different diameters was 1, 4, 5, and 8, respectively. The results indicate that particles with a diameter of 20 µm or larger would be completely captured. Particles that have passed through the disk would rotate and move toward the outside layer because of the centrifugal force effect. The initial particle trajectory at r = 0.02 m was quite different from the others, since the area around the motor was under negative pressure. In addition, the particle injected at r = 0.09 m moved faster than the others, since the deflector accelerated its speed.
Figure 7. Trajectories of particles with different diameters: (a) 3 D view (b) 5 µm (c) 10 µm (d) 15 µm and (e) 20 µm.
3.3. Influencing parameters for capture efficiency
This investigation also studied key parameters that could influence capture efficiency, such as disk rotation speed, airflow velocity, and disk structure. The results are discussed below.
The rotation speed can significantly affect the capture efficiency of the disk. compares the computed and measured capture efficiency at three different rotation speeds (800, 1500, 2050 rpm) when the air velocity was 4.00 m/s. Particles with diameters of 5 µm and 10 µm were selected for this study. The results show that the capture efficiency increased with the rotation speed. When the rotation speed increased from 800 rpm to 2050 rpm, the capture efficiency increased by 23.6% in the simulation and 19.3% in the experiment for 10 µm particles. The reason for the increase is that with a higher rotation speed, the wires swept a greater area per unit of time and were more likely to collide with particles.
Figure 8. Particle capture efficiency vs. (a) disk rotation speeds when the airflow velocity was 4.00 m/s. (b) airflow velocity when the disk rotated at 2050 r/min. (c) disk components.
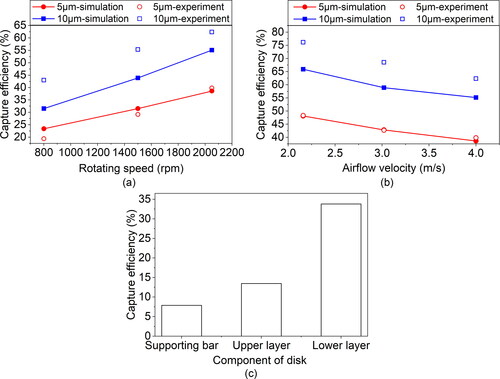
displays the capture efficiency of the rotating disk at different flow velocities (2.16, 3.02, and 4.00 m/s). The capture efficiency increased when the air velocity decreased. At a low air velocity, particles entrained in the flow moved slowly in the axial direction, which allowed more contact time with the wires and thus a higher possibility of capture. When the air velocity decreased from 4 m/s to 2.16 m/s, the capture efficiency increased by around 10% for the two particle sizes. The results from both show good agreement between the computed and measured capture efficiency for the 5 micron particle but not for the 10 micron particles.
Next, this study used the CFD results to quantify the capture of particles by different parts of the rotating disk. displays the efficiency of capture by different parts for 10 µm particles. The results indicate that the supporting bar, upper layer wires and lower layer wires caught 7.9% 13.5% and 33.8% of the particles, respectively. The lower layer wires caught more particles than the upper layer wires because there was a higher concentration of particles in the lower air region. The supporting bar had a small area that was concentrically distributed. The bar was not intentionally designed for capturing particles.
4. Improvement methods
Taking into account the capture mechanism and parameter analysis, we proposed several ways to enhance the performance of the rotating disk design. One idea for enhancing the disk performance was to increase the possibility of collision between particles and the wires. The first method was to use a larger number of wires. Although the wires were twined densely near the center of the disk, the wires in the outer region were relatively sparse. Adding more wires in this region can increase the likelihood of collision. We divided the wire zone into three sections as shown in , doubling the number of wires in the middle zone and quadrupling the number in the outer zone. At a 2050 rpm rotation speed and 4 m/s air velocity, and with the use of 10 µm particles in our CFD simulations, the capture efficiency would increase from 55.1% in the original disk to 75.9% if more wires were added to the lower layer, as shown in . Meanwhile, the pressure drop through the disk would also increase moderately, from 54.0 Pa in the original disk to 66.1 Pa. If more wires were added to both layers of the disk, the capture efficiency and pressure drop would further increase, as illustrated in Table 3. The approach seems to be advantageous.
Figure 9. Improvement methods: (a) adding more wires and (b) using a double disk.
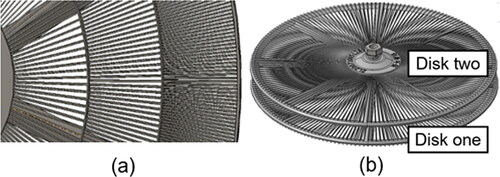
The second method was the addition of another rotating disk above the original one, as shown in . Two disks rotating in the same direction and in opposite directions, respectively, were simulated. shows that the capture efficiency would increase from 55.1% for the original disk to 71.1% if two disks rotated in the same direction. However, the pressure drop through the disks would increase from 54.0 Pa in the original disk to 90.4 Pa. If two disks rotated in opposite directions, the capture efficiency would increase further to 84.1%, and the pressure drop would rise to 100.0 pa. The reason for this greater increase was that when the two disks rotated in opposite directions, compared with rotation in the same direction, the relative velocity of the particles and the wires of the upper disk (“Disk two” in ) would increase as particles passed through the upper disk. This would enhance the possibility of collision between particles and wires. The method of two disks rotating in opposite directions achieved 5% higher capture efficiency than two denser layers, but it resulted in a much higher pressure drop. As the flagship device of cyclonic filter from Jeven company and Halton company, the capture efficiency arrives at 90% at the cost of 120 pa pressure drop or even higher (Natalia Citation2012), which proved that our improvements of rotating disk effective and practical.
Table 2. Improvement in capture efficiency by adding more wires to the rotating disk.
5. Conclusions
This investigation used experimental measurements and CFD simulations to study the capture efficiency of a rotating disk in a kitchen hood. The study led to the following conclusions:
Among the three turbulence models tested, the Reynolds stress model yielded the best agreement with the measured air velocity distribution in a duct with the rotating disk. The agreement in predicting capture efficiency was better for small particles than for large particles. The standard k–ε model may also be used, whereas the RNG k–ε model did not perform well for the complex flow.
The results indicate that larger particles were more likely to be captured because of their greater inertial effect and higher likelihood of colliding with the disk wires. The capture efficiency increased with rotation speed but decreased with increasing airflow rate. The lower layer of wires was more capable of capturing particles than the upper layer because of higher particle concentration in the lower layer region.
This investigation proposed two methods to improve the disk design. Adding more wires to the middle and outer regions of a rotating disk would increase the capture efficiency with a moderate increase in pressure drop through the disk. The addition of a second disk above the original one, to form a double-disk system, would increase the capture efficiency with a higher pressure drop through the disk.
Acknowledgment
We would like to thank Jiahua Wang from Fotile Co., Ltd., who invested considerable time in helping with the experiment.
Additional information
Funding
References
- Alexander, G. D., and J. A. Salpietra. 2012. Grease removal apparatus, systems and methods. US Patent 8,277,530, filed April 27, 2009, and issued October 2, 2012.
- Ansys. 2013. Ansys Fluent 15.0 theory guide. Canonsburg, PA: Ansys Inc.
- Antoun, G. S. 1999. Cyclonic filter assembly. US Patent 5,879,545, filed May 5, 1997, and issued March 9, 1999.
- Appa, H., D. A. Deglon, and C. J. Meyer. 2013. Numerical modelling of hydrodynamics and gas dispersion in an autoclave. Hydrometallurgy 131–132:67–75. doi:https://doi.org/10.1016/j.hydromet.2012.10.006.
- ASHRAE Standard 62.1. 2007. Ventilation for acceptable indoor air quality. Atlanta, GA: American Society of Heating, Refrigerating, and Air Conditioning Engineers.
- Ashraf Ali, B., G. Janiga, E. Temmel, A. Seidel-Morgenstern, and D. Thévenin. 2013. Numerical analysis of hydrodynamics and crystal motion in a batch crystallizer. J. Cryst. Growth 372:219–29. doi:https://doi.org/10.1016/j.jcrysgro.2013.01.041.
- Chen, W., J. Li, C. Wang, X. Dai, and J. Liu. 2018. 2D-PIV measurement of range hood-driven flow in a domestic kitchen. Energy Build. 177:64–76. doi:https://doi.org/10.1016/j.enbuild.2018.07.051.
- Delp, W. W., and B. C. Singer. 2012. Performance assessment of U.S. residential cooking exhaust hoods. Environ. Sci. Technol. 46 (11):6167–73. doi:https://doi.org/10.1021/es3001079.
- Fuchs, N. A., and C. N. Davies. 1964. Aerosol mechanics. (Book Reviews: The Mechanics of Aerosols). Science 146:1033–4.
- GAMBIT 2. 2005. User’s Manual to GAMBIT 2. Canonsburg, PA: Fluent Inc.
- Gao, J., C. Cao, Q. Xiao, B. Xu, X. Zhou, and X. Zhang. 2013. Determination of dynamic intake fraction of cooking-generated particles in the kitchen. Build. Environ. 65:146–53. doi:https://doi.org/10.1016/j.buildenv.2013.04.006.
- GB/T 17713-2011 range hood, 2011.
- Gibson, M., and B. Launder. 1978. Ground effects on pressure fluctuations in the atmospheric boundary layer. J. Fluid Mech. 86:491–511. doi:https://doi.org/10.1017/S0022112078001251.
- Hörmann, T., D. Suzzi, and J. G. Khinast. 2011. Mixing and dissolution processes of pharmaceutical bulk materials in stirred tanks: Experimental and numerical investigations. Ind. Eng. Chem. Res. 50 (21):12011–25. doi:https://doi.org/10.1021/ie2002523.
- Huber, K. L. 2005. Cyclonic air filter with exit baffle. US Patent 6,890,375, filed February 20, 2003, and issued May 10, 2005.
- Kang, K., H. Kim, D. D. Kim, Y. G. Lee, and T. Kim. 2019. Characteristics of cooking-generated PM10 and PM2.5 in residential buildings with different cooking and ventilation types. Sci. Total Environ. 668:56–66. doi:https://doi.org/10.1016/j.scitotenv.2019.02.316.
- Koivisto, A. J., M. Yu, K. Hämeri, and M. Seipenbusch. 2012. Size resolved particle emission rates from an evolving indoor aerosol system. J. Aerosol Sci. 47:58–69. doi:https://doi.org/10.1016/j.jaerosci.2011.12.007.
- Kwok, K. C., and R. Robison. 2011. Impact filter with grease trap. US Patent 7,947,123, filed November 8, 2007, and issued May 24, 2011.
- Launder, B. E., and D. B. Spalding. 1983. The numerical computation of turbulent flows. In Numerical prediction of flow, heat transfer, turbulence and combustion, eds. S. V. Patankar, A. Pollard, A. K. Singhal and S. Pratap Vanka, Elmsford, New York: Pergamon Press, Ltd. 96–116.
- Li, W., S. Li, J. Gao, Y. Cao, and Y. Chen. 2017. Grease separation in cooking fume by using a dynamic rotary filter. Chinese J. Environ. Eng. 11:2926–32.
- Li, C. S., W. H. Lin, and F. Jenq. 1993. Size distributions of submicrometer aerosols from cooking. Environ. Int. 19 (2):147–54. doi:https://doi.org/10.1016/0160-4120(93)90365-O.
- Lu, F., B. Shen, P. Yuan, S. Li, Y. Sun, and X. Mei. 2019. The emission of PM2.5 in respiratory zone from Chinese family cooking and its health effect. Sci. Total Environ. 654:671–7. doi:https://doi.org/10.1016/j.scitotenv.2018.10.397.
- Lunden, M. M., W. W. Delp, and B. C. Singer. 2015. Capture efficiency of cooking-related fine and ultrafine particles by residential exhaust hoods. Indoor Air 25 (1):45–58. doi:https://doi.org/10.1111/ina.12118.
- Metayer, C., Z. Wang, R. A. Kleinerman, L. Wang, A. V. Brenner, H. Cui, J. Cao, and J. H. Lubin. 2002. Cooking oil fumes and risk of lung cancer in women in rural Gansu, China. Lung Cancer 35 (2):111–7. doi:https://doi.org/10.1016/S0169-5002(01)00412-3.
- Morsi, S. A., and A. J. Alexander. 1972. An investigation of particle trajectories in two-phase flow systems. J. Fluid Mech. 55 (2):193–208. doi:https://doi.org/10.1017/S0022112072001806.
- Natalia, S. 2012. Problem of grease and its solutions in commercial kitchens. Master’s thesis, Mikkeli University of Applied Sciences.
- Pope III C. A. 2000. What do epidemiologic findings tell us about health effects of environmental aerosols? J. Aerosol Med. 13 (4):335–54. doi:https://doi.org/10.1089/jam.2000.13.335.
- Rajendran, N., and K. G. Otzen. 1990. Baffle type hood and duct filters for commercial use. US Patent 4,944,782, filed February 6, 1989, and issued July 31, 1990.
- Rim, D., L. Wallace, S. Nabinger, and A. Persily. 2012. Reduction of exposure to ultrafine particles by kitchen exhaust hoods: The effects of exhaust flow rates, particle size, and burner position. Sci. Total Environ. 432:350–6. doi:https://doi.org/10.1016/j.scitotenv.2012.06.015.
- Rubenstein, D. I., and M. A. R. Koehl. 1977. The mechanisms of filter feeding: Some theoretical considerations. Am. Nat. 111 (981):981–94. doi:https://doi.org/10.1086/283227.
- See, S. W., and R. Balasubramanian. 2006a. Physical characteristics of ultrafine particles emitted from different gas cooking methods. Aerosol Air Qual. Res. 6 (1):82–92. doi:https://doi.org/10.4209/aaqr.2006.03.0007.
- See, S. W., and R. Balasubramanian. 2006b. Risk assessment of exposure to indoor aerosols associated with Chinese cooking. Environ. Res. 102 (2):197–204. doi:https://doi.org/10.1016/j.envres.2005.12.013.
- See, S. W., and R. Balasubramanian. 2008. Chemical characteristics of fine particles emitted from different gas cooking methods. Aerosol Air Qual. 42 (39):8852–62. doi:https://doi.org/10.1016/j.atmosenv.2008.09.011.
- Singer, B. C., W. W. Delp, P. N. Price, and M. G. Apte. 2012. Performance of installed cooking exhaust devices. Indoor Air 22 (3):224–34. doi:https://doi.org/10.1111/j.1600-0668.2011.00756.x.
- Song, J., and X. Hu. 2017. A mathematical model to calculate the separation efficiency of streamlined plate gas-liquid separator. Sep. Purif. Technol. 178:242–52. doi:https://doi.org/10.1016/j.seppur.2017.01.044.
- Sun, D. 2009. Research on purification of dynamic net-disk purifier and design of control system. Master’s thesis, Wu Han University of Technology.
- Sze-To, G. N., C. L. Wu, C. Y. Chao, M. P. Wan, and T. C. Chan. 2012. Exposure and cancer risk toward cooking-generated ultrafine and coarse particles in Hong Kong homes. HVAC &R Res. 18 (1–2):204–16.
- Torkmahalleh, M. A., I. Goldasteh, Y. Zhao, N. M. Udochu, A. Rossner, P. K. Hopke, and A. R. Ferro. 2012. PM2.5 and ultrafine particles emitted during heating of commercial cooking oils. Indoor Air 22 (6):483–91. doi:https://doi.org/10.1111/j.1600-0668.2012.00783.x.
- Wang, L., Z. Xiang, S. Stevanovic, Z. Ristovski, F. Salimi, J. Gao, H. Wang, and L. Li. 2017. Role of Chinese cooking emissions on ambient air quality and human health. Sci. Total Environ. 589:173–81. doi:https://doi.org/10.1016/j.scitotenv.2017.02.124.
- Welch, A., and T. Kuehn. 2003. Development of a draft method of test for determining grease removal efficiencies. Final Report ASHRAE 1151-RP, American Society of Heating, Refrigerating, and Air Conditioning Engineers, Atlanta, GA.
- Xiao, D., S. Deng, J. Zhang, B. Liu, and D. Yuan. 2018. Effects of cooking oil fume on ambient air quality. Chinese J. Environ. Eng. 36:434–45.
- Yakhot, V., and S. A. Orszag. 1986. Renormalization group analysis of turbulence. I. Basic theory. J. Sci. Comput. 1 (1):3–51. doi:https://doi.org/10.1007/BF01061452.
- Zamankhan, P., G. Ahmadi, Z. Wang, P. K. Hopke, Y. S. Cheng, W. C. Su, and D. Leonard. 2006. Airflow and deposition of nano-particles in a human nasal cavity. Aerosol Sci. Technol. 40 (6):463–76. doi:https://doi.org/10.1080/02786820600660903.
- Zhai, Z. J., Z. Zhang, W. Zhang, and Q. Y. Chen. 2007. Evaluation of various turbulence models in predicting airflow and turbulence in enclosed environments by CFD: Part 1—Summary of prevalent turbulence models. HVAC&R Res. 13 (6):853–70. doi:https://doi.org/10.1080/10789669.2007.10391459.
- Zhu, C., M. Li, Y. Miao, N. Fan, and J. Li. 2014. Analysis of characters of particulate emissions generated from urban cooking fume. Green Build. 5:57–61.