
 ?Mathematical formulae have been encoded as MathML and are displayed in this HTML version using MathJax in order to improve their display. Uncheck the box to turn MathJax off. This feature requires Javascript. Click on a formula to zoom.
Abstract
A parallel plate differential mobility analyzer (DMA) having 100 independent current collectors is calibrated to relate the axial distances Ln between the inlet slit and the detector position to the particle mobility Z at given voltage difference V and sheath gas flow rate Q. Calibrating species are tetraheptylammonium bromide clusters (THABr) and polyethylene glycol (PEG35k, 5 nm in diameter), generated by a bipolar electrospray source, and purified in a cylindrical DMA. Gaussian fitting of the raw discrete mobility spectra in the form of ion current In versus collector position Ln, In(Ln), yield the mean value Lo of the collector position maximizing the signal for a given ion. The many (Z,V,Lo) triads obtained at given Q from many different DMA voltages and standard mobilities collapse into a single 1/(ZiVj) vs Lo curve when slight adjustments are made to the Zi. For different flow rates, Q/(ZiVj) vs. Lo curves collapse also, as long as the peaks are moderately narrow. However, for sufficiently small Q/Z, the THABr cluster peaks become broad, and the curves Q/(ZiVj) vs. Lo cease to collapse precisely. In contrast, the data for PEG show that this behavior is not a low-Q (Reynolds number) effect from the growth of the two lateral boundary layers, but is rather due to the broad and non-Gaussian peak shapes obtained at low Q or high Z. The calibration is accordingly unaffected by the Reynolds number. This simplicity was unexpected, given the three-dimensional flow in this DMA with growing lateral boundary layers.
Copyright © 2020 American Association for Aerosol Research
EDITOR:
1. Introduction
We have recently reported the development of a parallel plate differential mobility analyzer (DMA) having 100 independent collectors on the second electrode, each connected to an operational amplifier that reads continuously the collected current (Perez-Lorenzo, Amo-Gonzalez, and Fernandez de la Mora Citation2019). This multi-channel DMA (M-DMA) hence produces full high resolution spectra in real time. The M-DMA was based on a commercial instrument (SEADM’s parallel plate DMA P5) whose lower electrode was made completely flat, and could be substituted by an electronic circuit board containing the 100 collector strips separated from each other by insulating strips. The metallic collector strips are 35 µm high laying over an insulating layer, which produces 201 insulator-conductor steps along the lower M-DMA electrode. Given that the M-DMA operates at Reynolds numbers (Re) often in excess of 100,000, a risk existed that the flow would become turbulent. Fortunately no indications of flow instability were detected even at the largest flow rate achieved (>1000 L/min). This favorable feature is likely connected to the small height of these steps (having a modest local Re), and is further associated with the stabilizing effect of the slightly convergent geometry of the DMA channel. Parallel plate DMAs have reached an outstanding performance level, with resolving powers in excess of 100 (Amo-González and Pérez Citation2018), and high transmissions, even of high mobility ions (Rus et al. Citation2010, Javaheri et al. Citation2008). They are also easily connected in tandem with minimal losses (Amo-González and Fernandez de la Mora Citation2017; Zamora et al. Citation2018; Amo-González et al. Citation2018; Amo-González et al. Citation2019). However, the flow is neither axisymmetric nor strictly planar, so the relation between the mobility Z, the DMA length L, the voltage difference V and the flow rate of sheath gas Q may not conform to the familiar Knutson-Whitby (1975) form
(1)
(1)
One potential reason for the lack of two-dimensionality is that the side walls have growing boundary layers, which would normally result in a downstream acceleration of the flow in the center region of the channel, equivalent to an axial evolution of the flow rate per unit channel lateral width W. This effect has a dependence on Re, hence on Q, whence the geometric constant K might perhaps have a Reynolds number dependence, even in a DMA of constant cross section A. The situation is further complicated in the M-DMA prototype used here, because its slowly converging section implies an axially shrinking area A(x). Accordingly, one could expect that the geometric constant K would depend slightly not only on L, but perhaps also on Q: ZVL/Q = K(Q,L). For a conventional parallel plate DMA with a single outlet slit, these circumstances have posed no serious challenge, since K would at most depend on the single variable Q. K can accordingly be readily determined by a single calibration at given Q by use of an ion standard of known mobility. In our multidetector instrument the need to calibrate 100 different detectors at each flow rate becomes less trivial. Practical use of this instrument in precise mobility studies at high resolution therefore calls for a detailed calibration study such the one undertaken here. The dependence Z(L) we report is also of interest in planar DMAs with a conventional outlet slit. Furthermore, the effect of growing lateral boundary layers has never been previously studied in planar DMAs because they are relatively irrelevant at the high Reynolds numbers at which they are operated. Since such viscous effects gain importance at decreasing Q, our findings are also of interest to planar DMAs having an outlet slit.
The instrument described here is by no means the first DMA of its kind. DMAs having multiple detectors have been developed commercially, including the Fast Aerosol Size Spectrometers from Cambustion (DMS500 model) and TSI (3091 model). Both are widely used to capture particle size distributions produced in relatively fast transients, for instance in automobile exhaust emissions. Both instruments operate at modest flow rates, with no published data available on conditions under which turbulent transition might arise. They are accordingly not ideally fitted for high resolution nanoparticle studies. None of these prior instruments takes advantage of the relatively inexpensive electronic fabrication techniques used here, specifically developed for planar geometries. While planar fabrication methods would readily produce M-DMAs with 500 collectors, their development by conventional methods in the more common cylindrical geometry would be quite challenging.
2. Experimental
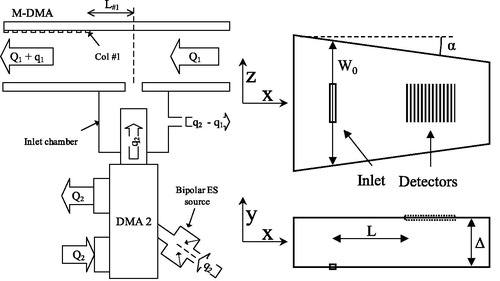
A sketch of the experimental apparatus is given in . We used a tandem DMA system configured to transmit positive particles from a bipolar electrospray (ES) source capable of yielding primarily singly charged ions of both polarities (Fernandez de la Mora and Barrios Citation2017). The inner diameters (ID) of the positive and negative silica capillary emitters used were 150 µm and 100 µm, respectively. Both were pulled under a flame producing emitting tip diameters down to 20–30 µm. All efforts to maintain a consistent experimental environment were made. The recirculation pumps for both DMAs were kept at constant revolutions throughout each experiment. The recirculating flow in both closed circuits included a cooler upstream the pump, which maintained fixed temperatures close to room temperature. The M-DMA had a cooler placed downstream of the pump and set at room temperature. DMA2 had its cooler set below room temperature just before the pump, such that the gas exiting the pump would be close to room temperature. The temperature was monitored just before entering both DMAs. The sample flow rate into each DMA was kept constant throughout each experiment. The positive and negative electrospray currents were kept constant. The DMAs were given ample time to reach an equilibrium temperature before starting an experiment. Temperature was not directly controlled, but was monitored for the room and the DMA exterior/interior. Temperature changes that took place exceptionally in some experiments will be explicitly mentioned when necessary. Samples were changed daily to avoid electrolytic degradation.
Figure 1. Left: Sketch of the experimental apparatus. Right: Detail of the channel geometry.
Samples: Tetraheptylammonium bromide (THABr; Sigma Aldrich) was sprayed in a methanol solution (Baker, 20 mM), with the same solution used in the positive and the negative spray. Poly(ethylene glycol) 35,000 (PEG35k, from Fluka) was sprayed in methanol in the positive mode at 10 µM concentration, with 50 mM of ammonium acetate. Ammonium acetate came from a 5 M aqueous solution (Sigma Aldrich) and was added to reduce the initial size of the sprayed drops. When generating PEG35k particles, the negative spray used the same buffer as the positive spray, though without addition of PEG35k. This then resulted mainly in small solvated acetate anions that effectively reduced the charge of the originally multiply charged PEG cations, without appreciably modifying their size distribution.
DMA circuits: The cylindrical DMA (referred to as DMA2, although placed upstream in the tandem DMA system) is a half-mini DMA including a circularizer ring to make the entering sample flow highly axisymmetric (Fernandez de la Mora Citation2017). It was run in closed loop with fixed sample flow rate q2 in and out between 5.5 and 7.5 SL/min (), and sheath gas flow rate Q2. Its voltage V2 was selected to pass a single species into the parallel plate M-DMA. The voltages V2 selected in each case are collected in the V2 column in . The M-DMA takes a sample flow q1 reported in . This flow enters into a small chamber immediately upstream the inlet slit to the M-DMA through a tube with 1/8” inner diameter. This small choice of diameter was a considerable blunder, which resulted in a jet dynamic pressure 16 times greater than if the tube ID had been twice as large. The penetration of this jet through the slit of the M-DMA led to an asymmetric and broadened peak shape, especially at modest values of the sheath gas flow rate. Unfortunately this detail escaped our attention until the study was completed. In order to moderate the loss of resolving power associated with the non-uniform penetration of this jet through the central region of the inlet slit, q1 is generally considerably smaller than q2. In some cases q1 was null (the ions being drawn into the M-DMA by its internal electric field penetrating through the slit), though we cannot preclude some periodic flow ingestion due to a possible unsteadiness of the flow at the inlet slit interface between the incoming jet and the sheath gas flow. The balance of flows q2-q1 is removed from the closed circuit through an open port in the small chamber preceding the inlet slit of the M-DMA. In future work, besides using a wider aerosol jet, there are alternative strategies to decrease the sample flow rate through DMA2 while maintaining sufficient transmission for tandem DMA measurements. One consideration is that the losses are not primarily in the connection between both DMAs. They are more serious in the region upstream of the first classification, where space charge and recombination of oppositely charged particles play a larger role. It is therefore possible to use the split flow strategy of Chen and Pui (Citation1997) where the aerosol flow passing through the inlet slit of DMA2 is less than the aerosol flowing through the bipolar ES chamber, the balance going through the annular chamber preceding the inlet slit and leaving the DMA as waste sample.
Table 1. Characterization of the various experimental series collected.
In contrast to conventional DMA operation, the sample flow q1 entering through the inlet slit of the M-DMA is not drawn into a detector through an outlet slit. Rather, an identical flow rate is steadily removed from the closed sheath gas circuit through a second opening made considerably downstream from the M-DMA. Therefore, unlike DMA2, the sample flows in and out of the M-DMA are generally not matched, as the latter is always null, while the former was not null in the experiments with THABr clusters. This unconventional feature affects the calibration procedure because the DMA response does not depend only on Q1, but on a combination between Q1 and q1 which for cylindrical and two-dimensional DMAs not drawing a mobility-selected sample is Q1+q1/2 (Knutson and Whitby Citation1975). In our situation the slit does not occupy the whole 17 mm width of the DMA at the axial position of the inlet slit, but only 7 mm, whence the flow rate relevant to the calibration is Q1+17q1/14. In the most unfavorable case (experiment THAB150wchoke) the relative correction is 17q1/(14Q1) = (17/14)3.85/(280*0.653) = 2.56%. This shift is typically smaller than the ambiguity involved in the determination of Q. Therefore, in what follows, we will ignore this small correction and speak only of the sheath flow rate, Q1 or simply Q. This does not involve any unnecessary simplification of the real problem, as long as what we shall subsequently call Q is taken to mean Q1+17q1/14.
For given sheath gas flowrate Q1 in the M-DMA, we determine the range of V1 voltages (limited to 5 kV by our power supply) for which the species selected on DMA2 falls within the sensing area of the M-DMA. We then collect mobility spectra at a series of equally spaced V1 values within this range, as indicated in columns V1 Range and V1 step in . We capture 19 full spectra per second for a total acquisition time of 1 s (19 individual samples) at each V1 value, using home-made software. The operation is repeated with several clusters, as also indicated in .
Detectors: The axial distances L of the centers of the 100 detectors from the center of the inlet slit are specified in the fabrication drawings as follows:
(2a)
(2a)
(2b)
(2b)
(2c)
(2c)
with rounding errors of 1 µm. The real origin of the circuit may differ by ±50 µm from these values, primarily from imprecision in installing the collector on its seat on the M-DMA. This ambiguity affects all the detectors almost equally as a mounting translation. The initial step in L of 0.204 mm is fixed by the thicknesses of 0.153 mm and 0.051 mm for the insulator and the collector strips, respectively. The increasing step in L following the 24th collector is chosen such that the Ln values change by 1% between consecutive collectors. For n ≥ 24 the insulator width remains fixed at 0.152 mm, while the width of the collecting metallic strip increases with n. The opening of the inlet slit is w = 0.6 mm, wider than the distance between any pair of adjacent collectors. However, the value of the electric field E within the DMA is considerably larger than the value Eo outside, which narrows down the particle beam width within the DMA by a factor (Eo/E)1/2 (Vidal-de-Miguel et al. Citation2012), enabling resolving powers >100 in the DMA model having an outlet slit at L = 4 cm (Amo-González and Pérez Citation2018).
Voltage Calibration: In order to compare the actual voltage difference V1 across the electrodes of the M-DMA with the voltage assigned to it by the computer control, a calibrated multimeter was used directly for V1 < 500 Volt, and through a calibrated high voltage probe of 1000:1 at higher voltages. The overall error found was at most ±0.64%, and ±0.47% between 1.5 and 5 [kV] where the vast majority of experiments were performed. As a result, no voltage corrections were implemented in the data analysis.
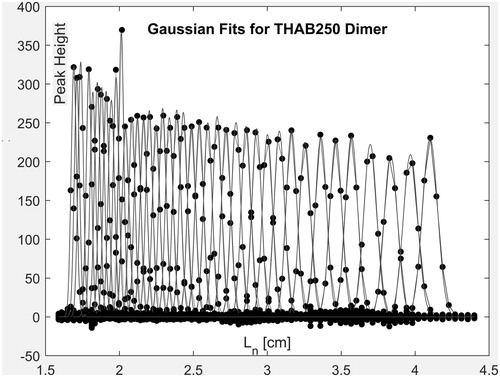
Detector sensitivity. shows the set of spectra obtained for the dimer ion of THABr at a given Q1, representing the current In (fA) collected in each detector versus the axial position Ln of the detector center (rather than the physically less relevant detector number n). The interpretation of the current In in terms of the ion concentration N is complicated by the discrete nature of the collectors. However, since all ions move normally to the collector at a uniform speed ZV/Δ, the collected current is
(3)
(3)
where Δ is the distance between the two DMA electrodes, e is the elementary charge, z the number of charges on an individual ion, N is the average ion concentration immediately above the detector, and An is the n-dependent area spanned by the detector plus one neighboring insulator. The axial dimensions of the detectors have been described following EquationEquation (2)
(2a)
(2a) . They occupy the full width W(x) of the channel (they even extend under the side insulator). From the I(L) data we determine the Lo values at each peak center via Gaussian fits. Strictly speaking the quantity that is theoretically represented by a Gaussian distribution is N ∼ In/An rather than In. However, the small (1%) variation in An between neighboring detectors results in minimal changes in the mean peak position whether the An correction is implemented or not. This analysis then results for a given flow rate in a set of (Z, V, Lo) triads. In the spectra of , each peak contains data points from 6 or more different collectors, which suffice to infer an accurate Lo via Gaussian fitting.
Figure 2. Raw mobility spectra obtained for the dimer ion for experiment THAB250 with a fixed value of Q/Qo = 1.92 and V1 values ranging from 2.2 kV to 5 kV, with voltage steps of 70 V. The continuous lines are Gaussian fits to the data, from which a mean value for L is obtained. The vertical coordinate is in fA.
The detector currents In are obtained from different amplifiers, whose gains are not identical. The main source of variation in sensitivity is the amplifier resistor Rn, for which the manufacturer gave 50 GΩ with a 30% error. In spectra taken at relatively low flow rate of sheath gas, mobility peaks are broad, spanning many detectors. Substantial spikes are seen in uncorrected spectra representing collector voltage versus collector position L. All the spectra presented accordingly represent the collected current based on the detector voltage times the measured amplification, where this spikiness is greatly reduced. The amplification was determined as follows: First we calibrate a single resistor (0.76 TΩ) with a high precision reference electrometer (Keysight B2987A), and employ it to calibrate all amplifiers. Using a known voltage source in series with the calibrated resistor, a known current (6570fA) is injected at each collector. The resulting change in amplifier voltage is then measured through the acquisition hardware and software used for the experiments. Laboratory temperature/humidity variations may affect the calibration as well as the feedback resistor (±1000 ppm/°C). The operational amplifier leakage current is also strongly temperature dependent (aside from the manufacturing tolerance). All in all, if the reference resistor would have a 0.5% change over the course of the tests, as well as another 0.5% for the feedback resistors (5 °C change), and if we take the operational amplifier leakage limits at 25 °C (±20fA LMP7721MA), then we obtain an ambiguity of about 1.5% in the amplification (0.9953).
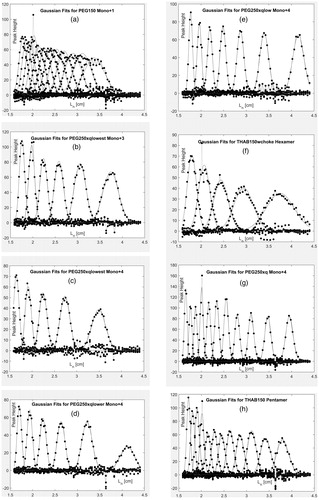
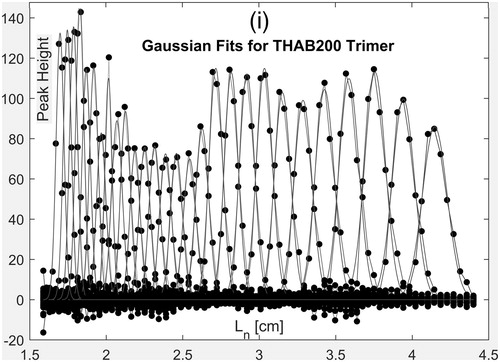
provides additional representative examples of corrected mobility spectra obtained at all flow rates investigated for some THABr clusters and PEG35k ions.
Figure 3. Selected corrected I(L) mobility spectra each collecting data for multiple voltages at fixed ion and gas flow rate. The vertical scale is in fA. The continuous curves are Gaussian best fits to the data.

3. Results
3.1. DMA calibration with THABr cluster standards
shows the (Z, V, Lo) points collected for singly charged tetraheptylammonium bromide cluster cations in the form Q/(QoZV) versus mean collector position Lo. The sheath gas flow rates used in this study are made dimensionless with the value Qo corresponding to experiment THAB150. The reason is that we do not have an accurate measurement method to determine Q, but can determine relative Q values with fair precision. There are as many of these cluster data series (fixed symbol in the figure) as voltages selected. The experimental voltages are included in for each cluster series, by providing the first and last voltage (column 3) and the uniform voltage jump used (column 4). For instance, for experiment THAB150, the dimer data are taken at voltages {1.2, 1.4, 1.6, 1.8, 2, 2.2, 2.4, 2.6} (kV). The various data series for different clusters should collapse on top of each other for each Q1, as long as the assigned Z values correspond precisely to the actual cluster mobilities. These mobilities were measured at ambient conditions in separate experiments with DMA2. Given the small voltage calibration errors involved, any slight departures of some of the data from a unique curve must be due to errors in the assigned Z. Some slight systematic departures are indeed found for some of the clusters, and are removed for all the cluster series by a slight shift in the nominal mobility. The nominal and adjusted mobilities used in generating are reported in .
Figure 4. Representation of the group Q/(QoVZ) (s/cm2) for singly charged tetraheptylammonium bromide cluster cations. Zn in the legend denotes the mobility of the nth cluster (). (a) Data for 8 clusters and multiple voltages at the reference flow rate Q = Qo (THAB150 experiment), all falling precisely on a single curve. The dashed line is a quadratic curve fit discussed in the theory section. (b) Collapse of data for experiments THAB150, THAB200, THAB250 and THAB450 when selecting Q/Qo ratios of {1, 1.49, 1.92 and 4.05} (colored symbols). Also included are the data for the smallest flow rate (Q/Qo = 0.634), which exhibit a clearly higher downward curvature than the other series.
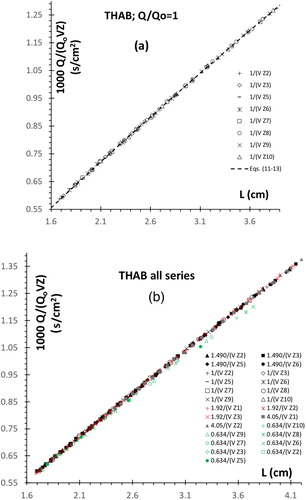
Table 2. Values of the adjusted mobilities Z (cm2/V/s) for the various THABr experiments compared to the nominal value of row 2. The last column reports the Q/Qo ratio collapsing at small L the various Qo/(QZV) vs. L curves.
is taken at the standard flow rate Q = Qo, whence in reality it is a plot of 1/(VZ) vs L. We note once more that the quantities Q and Qo referred to here for brevity as sheath gas flow rates are in reality the combination Q1+17q1/14 of entering sheath and aerosol flow rates. Operating at different flow rates of sheath gas yields curves 1/(ZV) vs. L similar to that shown in for the standard flow rate Qo, except that the vertical scale varies with Q. However, choosing the ratio Q/Qo (unknown here due to lack of accurate flow rate measurements) such that the Q/(QoZV) datum at a certain L coincides for the two flow rates, the two full curves (at all Lo values) fall precisely on top of each other as long as the flow rates are large enough for the peaks to be narrow. This is demonstrated in by comparing Q/(QoZV) data for experiments THAB150 with corresponding data for experiments THAB200, THAB250 and THAB450 (colored symbols) when selecting Q/Qo ratios of {1, 1.49, 1.92 and 4.05}. Like the data at the standard flow rate, these other data sets use, at each Q, their own slightly shifted optimal mobilities (), such as to collapse each into a single curve. The mobility of the dimer was kept as a common standard at all flow rates. Except for a considerable variation in the case of the trimer (Zmax/Zmin = 1.024), the adjusted mobilities established at the various flow rates are almost identical to each other. The exceptionally low adjusted value Z3 = 0.5115 cm2/V/s found in the trimer data for experiment THAB250 is attributable to the fact that the trimer spectra were recorded with a temperature of 25.7 °C in the M-DMA, while the corresponding dimer and monomer experiments were obtained at 22.7 °C.
Also included in are the data for the smallest flow rate (THAB150wchoke). With the choice Q/Qo = 0.634, these lower flow rate data are tangent at small L to all the other data, but exhibit a clearly higher downward curvature at larger L. As argued in the theory section, part of the slight downward curvature of all these curves is due to the convergence of the channel. An additional downward curvature would be expected as a result of growing boundary layers near the lateral insulating walls, which would create a downstream widening dead region equivalent to an extra channel area reduction. Because the thickness of this boundary layer decreases with the square root of the Reynolds number (∼Q−1/2), one would expect the negative curvature to increase at decreasing Q.
Another possible explanation for the anomaly of the THABr series at Q/Qo=0.634 would be that the assumption of a Gaussian peak shape in the variable L is not exact, not even in the limit q/Q→0. In variable voltage mobility spectra (with a fixed sampling slit position) the current versus voltage curve for mobile ions is only approximately Gaussian, the approximation losing accuracy when Q/Z diminishes and the peaks broaden (see of Rosell et al. Citation1996). In contrast, the theoretical peak shape in a parallel plate DMA of constant cross section is exactly Gaussian in spectra taken at fixed voltage and variable L. This prediction is not met here for any sufficiently broad peak obtained, as all are clearly non-Gaussian, with a right tail (towards larger L) broader than the left tail. Suspecting that this asymmetry might be due to the divergence of our DMA geometry, we have analyzed in the Theory section the effect of channel divergence on diffusive broadening. We find that the peak shape is then not exactly Gaussian, with a wider tail on the right than on the left. However, for our experimental conditions, the predicted asymmetry is far less than observed, even for the relatively wide peaks associated in with the lowest L datum for Q/Qo = 0.634 (FWHML = 13.8%). We are then forced to conclude that these tails are due to a flow nonideality.
Irrespective of the tail anomaly, the large peak width apparently associated with off-lying points in is primarily due to diffusion. In order to test if these anomalous data are due to boundary layer growth (at low Q) or to excessive peak width (irrespective of Q), we have carried out additional tests with the considerably less diffusive PEG35k particles.
3.2. DMA calibration with the PEG35k sample
As shown in the lighter regions of the two dimensional mobility spectrum of , the PEG sample used was fairly monodisperse, producing relatively narrow peaks even without DMA selection. In spite of the inherent polydispersity of this sample, because of its much smaller diffusivity, it produces narrower peaks than the (strictly monomobile) cluster standards at comparable and even lower flow rates. By adjusting the positions and currents of the positive and negative ES emitters we could produce four different PEG35k ions with charge states z = {1, 2, 3, 4}. Their nominal mobilities are collected in the second row of . They were determined with DMA2 by comparing under fixed flow conditions the PEG peak voltages VPEG with the voltages V2 and V3 at which the dimer and trimer ions of THABr appeared: ZPEGVPEG = Z2V2 = Z3V3. The mobilities inferred from the dimer and trimer standards differed among themselves by 0.37%, due to the slight difference between the ratio of THABr trimer to dimer taken as standard and the ratio obtained in the calibration experiments (i.e., slight disagreement between Z2V2 and Z3V3 for the nominal Z2 and Z3 and the measured V2 and V3). The nominal mobilities of PEG 35 K reported in are an average of all the measurements made with both cluster standards. While the nominal values given in are for the center of the full polydisperse distribution of PEG35k, in the calibration experiments of the M-DMA, the PEG calibration standard was selected with DMA2. If the selection voltage is not exactly the peak voltage for the distribution, the selected mobility may stray slightly away from the mean value recorded in the table. For this reason, we slightly shift the nominal mobilities to collapse all the data at given Q into a single curve. The procedure is very much as used before with the THABr cluster experiments: we only adjust Z for charge states 1, 3, 4, while keeping fixed the mobility of charge state 2. In all PEG experiments the maximal variation of adjusted mobilities across all the experiments was Zmax/Zmin = 1.0106 (triply charged PEG35k data).
Figure 5. Two-dimensional spectrum of PEG35k, plotting ion current (color scale) versus the spectral variables of the two DMAs. The three lighter regions correspond from right to left to charge states z = 2, 3, 4. The light line clearly visible going through these three PEG35k peaks is the locus of ions having the same mobility in both DMAs, and could be used for DMA calibration.
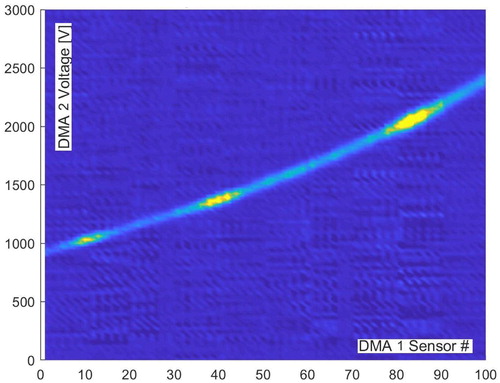
Table 3. Electrical mobilities Z (cm2/V/s) used to invert the various PEG35k experiments at different Q/Qo for variously charged PEG35k+z ions (z = +1 to +4).
compares Qo/(QZV) data for PEG in charge states z= {+2, +3, +4} (experiment PEG250xqlow, with Q/Qo = 0.336) with those of for THABr. While Q in the PEG35k experiment is lower than in the anomalous data found in at Q/Qo=0.634 THABr reference, these PEG35k data collapse quite well over the reference data representing the high Q asymptote. The PEG35k data obtained at Q/Qo of 0.6517 and 0.425 are equally indistinguishable from the other two included in . Accordingly, there is really no low flow rate (Reynolds number) anomaly at Q/Qo of either 0.634 or even 0.336. The anomaly seen at the lowest flow rate included in must then be due to the excessively wide non-Gaussian peaks forming under these conditions, which result in an inaccurate experimental value of Lo.
Figure 6. Comparison of the THABr reference data of (open symbols at Q/Qo=1) with Q/(QoVZ) data for PEG35k. Z + z in the legend denotes the mobility of a PEG ion having z elementary charges. (a) PEG35k at Q/Qo = 0.336 (black filled symbols) showing excellent collapse with the cluster data. (b) Comparison with reference data from of data for all PEG35k experiments when selecting Q/Qo ratios of {0.651, 0.425, 0.336, 0.289 and 0.2473} (colored symbols). The data for Q/Qo = 0.289 depart very slightly from the general trend, and those for Q/Qo = 0.2473 (large filled gray circles) more clearly.
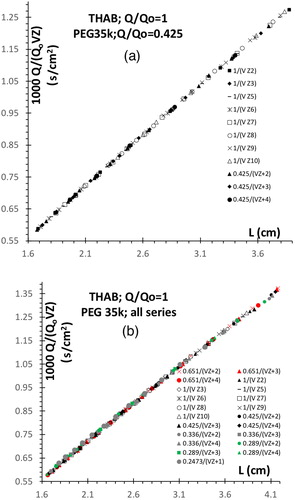
compares the reference data of to all available PEG35k data at decreasing flow rates: Q/Qo ratios of {0.651, 0.425, 0.336, 0.289 and 0.2473} (colored symbols). The data for Q/Qo = 0.289 depart very slightly from the general trend, and those for Q/Qo = 0.2473 (large filled gray circles) more clearly. These very slightly anomalous points are also associated with wide peaks, and, therefore, do not imply a low Re effect associated to lateral boundary layer growth. We therefore conclude that, even at the smallest flow rates studied, the calibration curve Q/(ZV) for this DMA is for all practical purposes independent of Reynolds number. We shall subsequently obtain an approximate value for Qo of 283.5 L/min, implying that the smallest and largest flow rates studied are 70.14 and 1150 L/min. This corresponds to channel Reynolds numbers of 4580 and 75,140.
4. Theoretical considerations
4.1. Converting the landing position L to a mobility Z
Let us consider a particle streamline starting at the plane of symmetry at the center of the entrance slit of a parallel plate DMA (, right), where the flow velocity (U, V, W) is dominated by the x component U, and the field (0, E, 0) is almost exactly uniform, directed in the y direction. There is no z dependence for the velocity field at the symmetry plane, while the velocity in the z direction is null. Accordingly the mean particle trajectory ignoring diffusion obeys the differential equation
(4)
(4)
Let’s make x and y dimensionless with the gap Δ between the two DMA electrodes, and U,V dimensionless with a characteristic velocity Uo to be later defined:
(5a–d)
(5a–d)
Then Equation(4)
(4)
(4) becomes
(6)
(6)
The initial condition is (ξ,η) = (0, 0), and the impact position ξ = L/Δ of the ion trajectory at η = 1 must now be a function of ZE/Uo, as well as the Reynolds number,
(7a)
(7a)
Equation(7a)
(7a)
(7a) may be rewritten as
(7b)
(7b)
We may define Re = UoΔ/ν. However, since Uo is not an experimentally known quantity but the flow rate of sheath gas Q is in principle measurable, we now define Uo = Q/(ΔWo), where Wo is a characteristic value of the DMA width in the z direction, say at the inlet slit. Therefore, defining the quantity Q’ such that Re = Q’/ν and the voltage difference V between the two DMA plates:
(8a–c)
(8a–c)
Equation(7b)
(7b)
(7b) becomes:
(9)
(9)
This result is the basis for the data analysis followed earlier.
The next level of possible simplification is to note that Re = Q’/ν will be typically fairly large (i.e., Re = 18,523 at Q = Qo = 283.5 L/min). Accordingly, the expected Re dependence would be slight, approximately reducing Equation(9)(9)
(9) to
(10)
(10)
Interestingly, we have found that this high Re limit applies well even when Re is only a few thousands.
4.2. A proxy value for Q
Short of measuring Q directly, we can establish a quantity Qa(Q) closely related to it. This proxy quantity we may introduce based on a model where the velocity field is strictly uniform in the y and z directions, while depending slightly on x, such that U(x)=Qa/A(x). Note that this is not claimed to be true. It is simply a device to define the proxy quantity Qa as follows. Making use of Equation(1)(1)
(1) , A(x)dx/Qa=dy/(ZE), and integrating from the inlet slit to y = Δ gives
(11)
(11)
It is clear that Q and Qa are not the same thing. In particular, for each of our experimental data sets Q is strictly constant for all (Z, V, Lo) triads, while Qa may in principle depend on L. Let us examine this dependence for our experiments.
For our DMA the channel height is constant, Δ = 1 cm, while its width W has a constant semi-angle of convergence α = 1.5° and takes the value Wo = 1.70 cm at the position of the inlet slit. W ceases to evolve exactly linearly past L = 37.4 mm, with a gradual curvature that eventually brings the convergence angle to zero. However, the insulator wall curvature is so small that a fit to the geometry in the region from L = 37.4 to the last detector is indistinguishable from a 1.5° angle. Therefore, over the whole length used for mobility analysis the area and its integral in Equation(11)(11)
(11) are:
(12)
(12)
(13)
(13)
Plotting the right hand side of Equation(11)(11)
(11) together with the experimental group Q/(QoZV) in while using the true value of α leads to imperfect agreement no matter what value of Q/Qo is chosen. However, the data agree qualitatively with Equation(11)
(11)
(11) and Equation(13)
(13)
(13) in being well fitted by a quadratic expression in L. The agreement is in fact excellent if we take α = 2.09°, Qo = 283.5 L/min, as shown by the dashed line included in . The effective angle found differs appreciably from the instrument’s half angle of 1.5°, not too surprisingly given that the model used for the velocity field has no rigorous basis.
In summary, by modifying slightly the definition Equation(11)(11)
(11) of Qa based on an artificial channel angle of 2.09° we obtain a proxy flow rate that is essentially independent of L under all the conditions tested for which the actual flow rate is constant. Unlike all other flow rates previously discussed, Qa is not an unknown or ambiguous quantity. It is precisely defined by Equation(11)
(11)
(11) and Equation(13)
(13)
(13) with α = 2.09°. For all practical purposes of providing a relation between L and Z, we may now ignore the actual flow rate Q and use Qa and Equation(11)
(11)
(11) instead. One still needs to determine Qa under given flow conditions to make use of Equation(11)
(11)
(11) . One may simply introduce a mobility standard under these flow conditions, and measure the position L where it lands. The right hand side of Equation(11)
(11)
(11) is then computable fixing Qa. As already noted its value is 283.5 L/min for the data of .
Let us now return to the actual flow rate Q and its relation to Qa. The two flows are in principle different. However, since there is a unique value of Qa associated to each Q, the two flow rates must be univocally related. We therefore expect that the two Reynolds numbers defined based on the two flow rates would be uniquely dependent on each other:
(14)
(14)
However, we can go beyond statement (14) to show that the two flow rates must in fact be directly proportional to each other. This is clear from the fact that the Qa/(ZV 283.5 L/min) and Q/(QoZV) as plotted in are exactly the same functions of L. Therefore, taking their ratio,
(15)
(15)
The flow rates Qa and Q are accordingly strictly proportional, with a still unknown proportionality constant that could be established by a single experiment.
In summary, the calibration of a DMA with many detectors requires not just one geometrical constant Q/(VZ) = K, but a function K(L). This function we have carefully determined experimentally for our planar DMA, and is fitted with excellent approximation by EquationEquations (11)(11)
(11) and Equation(13)
(13)
(13) . Given the function K(L), if the operating flow rate Q is not precisely known, the remaining task of relating Z to L at all L values is as simple as the mobility standard calibration often used with DMAs having only one detector (Ude and Fernández de la Mora Citation2005). This final task gives also the flow rate Qa, and will give the actual flow rate Q once the constant factor in Equation(15)
(15)
(15) is experimentally determined.
We should stress that the simplicity of the calibration procedure described for this DMA is a result of the finding that the function K(L) shows no Reynolds number dependence, even at the lowest flow rates used [Qa,min (L/min)=283.5*0.2474 = 70.14]. This feature is expected in axisymmetric or strictly two-dimensional instruments, but not so in a three dimensional device having lateral walls. Perhaps this simplifying feature will not be reproduced in other parallel plate DMAs in the absence of two special features of the instrument studied here, both of which reduce the width of the boundary layers. First, the flow is slightly accelerated, second, the DMA length Lmax/Δ = 4.4 is relatively short.
4.3. Diffusive broadening in slowly converging DMAs
The anomalous mobility tails observed would not be theoretically expected in a DMA with uniform cross sectional area A. In order to establish if these wide tails are due to the x-dependence of A(x), the online supplementary information Section analyzes the problem of diffusion broadening for slowly varying A(x). We conclude that a slightly asymmetric mobility distribution is expected at modest sheath gas flow rates, but its predicted magnitude is much smaller than that observed. The prominent tails found at moderate Q must accordingly be due to flow nonidealities.
5. Conclusions
Contrary to our expectations and to misleading initial symptoms, a single quadratic calibration curve Qa/(ZV) versus L is seen to accurately represent all our data independently of Reynolds number, enabling relating the particle mobility to the position of each collector strip. Apparent shifts from this general trend are observed at low flow rates in situations yielding wide peaks (FWHM > 10%). These shifts, however, are not due to an additional flow rate (Reynolds number) dependence of the Qa/(ZV) versus L curve, but to the excessive width of the transfer function for the small particles considered.
The present study suffers from two main limitations. One is the fact that an imperfect connection between the two DMAs has reduced the resolving power of the parallel plate DMA. Another shortcoming is that a single calibration constant required to connect the proxy flow rate Qa with the actual flow rate Q has not yet been measured. Notwithstanding the still missing Q/Qa factor, introducing a mobility standard at any unknown flow rate Q and determining its landing position Lo yields the needed Z(L) relation for this particular operational flow rate. Combined with the calibration information provided here (Qa/(ZV) versus L curve) for all 100 collectors, this single calibration is applicable to all the detectors, yet is as straightforward as the calibration previously applied to conventional DMAs having fixed outlet slit positions.
It is of interest to remark that the present study is the first where SEADM’s high resolution parallel plate DMA has been used to study particles as large as our PEG sample (5 nm in mobility diameter). displays spectra at the largest flow rate used for PEG (Q/Qo = 0.6517; Q∼120 L/min), demonstrating a resolution in excess of 25. The ion is quadruply charged, and lands at L = 4 cm (the position of the outlet slit in SEADM’s P5 DMA) when the applied voltage is 1.6 kV. At this flow rate, the singly charged ion would be classified at 6.4 kV.
Supplemental Material
Download ()Acknowledgments
Yale’s contributions to this study were funded by SEADM, directly as well as via the loan of a parallel plate DMA modification of their P5 model, suitable to interface with the multidetector collector electrode and electronics. We are thankful to Mr. Michele Genoni and Mr. Derek Kuldinow for their contributions to this study.
Conflict of interest
Following Yale rules Juan Fernandez de la Mora declares an interest in the companies SEADM and NanoEngineering Corporation commercializing the two DMAs used in this study.
Additional information
Funding
Related Research Data
References
- Amo-González, M., I. Carnicero, S. Pérez, R. Delgado, G. A. Eiceman, G. Fernández de la Mora, and J. Fernández de la Mora. 2018. Ion mobility spectrometer-fragmenter-ion mobility spectrometer analogue of a triple quadrupole for high-resolution ion analysis at atmospheric pressure. Anal. Chem. 90 (11):6885–92. doi:10.1021/acs.analchem.8b01086.
- Amo-González, M., and J. Fernandez de la Mora. 2017. Mobility peak tailing reduction in a differential mobility analyzer (DMA) coupled with a mass spectrometer and several ionization sources. J. Am. Soc. Mass Spectrom. 28 (8):1506–17. doi:10.1007/s13361-017-1630-2.
- Amo-González, M., and S. Pérez. 2018. Planar differential mobility analyzer with a resolving power of 110. Anal. Chem. 90 (11):6735–41. doi:10.1021/acs.analchem.8b00579.
- Amo-González, M., S. Pérez, R. Delgado, G. Arranz, and I. Carnicero. 2019. Tandem ion mobility spectrometry for the detection of traces of explosives in Cargo at concentrations of parts per quadrillion. Anal. Chem. 91 (21):14009–18. doi:10.1021/acs.analchem.9b03589.
- Chen, D. R., and D. Y. H. Pui. 1997. Numerical modeling of the performance of DMAs for nanometer aerosol measurement. J. Aerosol Sci. 28 (6):985–1004.
- Fernandez de la Mora, J. 2017. Expanded flow rate range of high-resolution nanoDMAs via improved sample flow injection at the aerosol inlet slit. J. Aerosol Sci. 113:265–75. doi:10.1016/j.jaerosci.2017.07.020.
- Fernandez de la Mora, J., and C. Barrios. 2017. A bipolar electrospray source of singly charged salt clusters of precisely controlled composition. Aerosol Sci. Technol. 51 (6):778–86.
- Javaheri, H., Y. Le Blanc, B. A. Thomson, J. Fernandez de la Mora, J. Rus, and J. A. Sillero-Sepúlveda. 2008. Evaluation of the analytical characteristic of a differential mobility analyzer coupled to a triple quadrupole system (DMA-MSMS). Poster 061, Presented at the 56th ASMS Conference, Denver, CO, June 1 − 5.
- Knutson, E. O., and K. T. Whitby. 1975. Aerosol classification by electric mobility: Apparatus, theory and applications. J. Aerosol Sci. 6 (6):443–51. doi:10.1016/0021-8502(75)90060-9.
- Perez-Lorenzo, L. J., M. Amo-Gonzalez, and J. Fernandez de la Mora. 2019. Multi-electrometer detector for real-time high-resolution measurements in planar differential mobility analyzers. Paper presented at the 37th AAAR Annual Conference, Portland, OR, October 16.
- Rosell, J., I. G. Loscertales, D. Bingham, and J. Fernández de la Mora. 1996. Sizing nanoparticles and ions with a short differential mobility analyzer. J. Aerosol Sci. 27 (5):695–719. doi:10.1016/0021-8502(96)00016-X.
- Rus, J., D. Moro, J. A. Sillero, J. Royuela, A. Casado, F. Estevez-Molinero, and J. Fernández de la Mora. 2010. IMS–MS studies based on coupling a differential mobility analyzer (DMA) to commercial API–MS systems. Int. J. Mass Spectrom. 298 (1-3):30–40. doi:10.1016/j.ijms.2010.05.008.
- Ude, S., and J. Fernández de la Mora. 2005. Molecular monodisperse mobility and mass standards from electrosprays of tetra-alkyl ammonium halides. J. Aerosol Sci. 36 (10):1224–37. doi:10.1016/j.jaerosci.2005.02.009.
- Vidal-de-Miguel, G., M. Macía, P. Pinacho, and J. Blanco. 2012. Low-sample flow secondary electrospray ionization: Improving vapor ionization efficiency. Anal. Chem. 84 (20):8475–9. doi:10.1021/ac3005378.
- Zamora, D., M. Amo-Gonzalez, M. Lanza, G. Fernandez de la Mora, and J. Fernandez de la Mora. 2018. Reaching a vapor sensitivity of 0.01 parts per quadrillion in the screening of large volume freight. Anal. Chem. 90 (4):2468–74. doi:10.1021/acs.analchem.7b00795.