
 ?Mathematical formulae have been encoded as MathML and are displayed in this HTML version using MathJax in order to improve their display. Uncheck the box to turn MathJax off. This feature requires Javascript. Click on a formula to zoom.
Abstract
Advances in aerosol science have often been driven by innovations in aerosol instrumentation. Our ability to make real-time, multi-dimensional measurements of particle properties can be attributed to the development of a few important techniques throughout the history of aerosol science. One measurement technology that can be considered the father of aerosol instruments is the portable Aitken counter (PAC). The development of the PAC resulted in the first extensive field measurements of concentrations of particles smaller than those detectable using light microscopes. Prior publications have looked at the historical development of techniques related to measurement of one aerosol property. Here, we extend those previous historical studies by revisiting the design of the PAC and establishing its performance relative to existing instruments. This study provides a reference to educators who start their instrumentation course with a historical note about Aitken Particle Counters or researchers interested in quantifying changes in air quality over the time periods consistent with climate change studies.
Copyright © 2020 American Association for Aerosol Research
EDITOR:
Introduction
In the 1800s, Europe experienced a major increase in emissions of particles and gaseous pollutants into the atmosphere from anthropogenic activities. This increase resulted in reports of respiratory impacts of black carbon particles in the general population as early as 1814 (Pearson Citation1814). In addition to the health effects, the detrimental role of air pollution was also reported in terms of discoloration of buildings and reduced visibility due to increased smog. One observation, Monet’s London Series from 1899 to 1905, shows large clouds of smog obstructing his views of London (Thornes Citation2008). With the observed increases in atmospheric smog came reports of particulate deposits in the lungs of the general public and livestock (Pearson Citation1814). These observations drove research interest in understanding the nature of both pollutants and biological particles and their impacts.
The initial work to understand the nature of airborne particles and their health effects was done by scientists interested in biological particles in air and their interaction with air pollution (Condy Citation1862). Several studies were conducted to determine the role of common dust in increasing the number and severity of epidemics such as cholera outbreaks (Cunningham Citation1873). Early efforts to quantify airborne particle concentrations were made by counting particles with an optical microscope after their collection on open substrates. These initial studies on airborne particles focused on characterizing particles by their shape, size, and smell. For this characterization, particles were collected by different mechanisms including filtration using cotton wool; deposition into water by shaking a sealed bottle with air and water; or holding a glass slide in open air after it was moistened with glycerin. The collected particles were then characterized by observation under a light microscope (Cunningham Citation1873). Because of the detection capabilities of a microscope, most studies provided only qualitative information about particles significantly larger than 1 µm in size and generally focused on biological particles.
The initial concentration measurement methods suffered from an inability to relate the count of particles back to a corresponding volume of sampled air. Concentration measurements were also considered inaccurate at the time because it was theorized that particles smaller than what was detectable by microscopy existed (Aitken Citation1888).
The first quantitative information about airborne particles was made possible with the invention of a series of dust counters by John Aitken. They represented the first condensation particle counters (CPCs). John Aitken, an engineer, meteorologist, and physicist, was born in Falkirk, Scotland on 18 September 1839. He worked in the shipbuilding industry as a marine engineer for five years until his ill health compelled him to quit this career. He then began to study phenomena in nature. His study of meteorology led to numerous discoveries and inventions in the areas of aerosol science and cloud physics including his invention of the portable Aitken counter (PAC). The Aitken dust counters are a series of three CPCs. The first was a tabletop dust counter that utilized heterogeneous nucleation to grow particles in order to be detected by the human eye (Podzimek Citation1989). This phenomenon was first discovered by Paul-Jean Coulier in 1875 and discovered independently by John Aitken in 1880 (Spurny Citation1998). The tabletop version was problematic because it was not sufficiently portable to make ambient air measurements across the country and around the world (Aitken Citation1890). To make ambient measurements, Aitken modified his dust counter and created a portable version, the PAC, that could fit into a carrying case that measured 32.8 cm long by 17.3 cm wide by 12.4 cm tall. He then further miniaturized the dust counter and created a pocket version, the pocket portable Aitken counter (PPAC), that fit in a case that measured 11.1 cm long by 7.0 cm wide by 3.4 cm tall (Aitken Citation1892). The Aitken dust counters revolutionized aerosol science by allowing measurement of concentrations of particles over a broad size range.
The design of the John Aitken’s dust counters was then modified by subsequent researchers to provide reliable, continuous measurements, improve the ease of operation, and reduce the minimum measurable particle size. Two popular instruments that resulted from the Aitken dust counters are the Scholz Counter (Scholz Citation1932) and the Pollak Counter (Nolan and Pollak Citation1946). The Scholz Counter, developed in 1931 and 1932, reduced leakage during expansion and was able to distinguish between charged and neutral particles. The Model 1957 Pollak Counter was improved upon the Aitken dust counters by using a photoelectric cell for counting particles allowing for easier, more reproducible measurements (McMurry Citation2000). Current day CPCs use the same measurement principle of Aitken’s dust counters but have pushed the lower detection limit of particles by using increased supersaturation and improved electronics to detect and record particles.
The invention of the PAC led to reports of particle concentrations throughout the world. While that data revolutionized our understanding of air quality and its impact, the exact performance characteristics of the PAC is not entirely known. Understanding the cut-point size and counting efficiency of the PAC is critical for any comparison of historical data with current day measurements. In addition to its value for research studies, the PAC is a valuable teaching tool. Many courses on aerosol instruments begin with a look back at early techniques, often starting with the PAC. Knowledge of the performance of the PAC will allow researchers and students to better relate design evolution to performance improvements over the years.
The PAC, invented in the 1880s, was used as an absolute standard for calibration of CPCs until the 1980s. As the activated droplets were counted manually, rather than using light scattering/extinction, the Aitken counter was considered an absolute standard. It was understood that the number of particles measured by condensation methods was dependent on particle size and chemical composition, but the repeatable nature of instrument made it an instrumentation standard.
In addition to historical interest, characterization of the Aitken counter is also important to understand climate forcing associated with aerosol particles. Climate forcing calculations requires a better understanding of aerosol effects from the early era of industrialization, and the rural measurements of Aitken, particularly along the coast of western Great Britain, provide some of the very few quantitative measurements available from this period. The present study demonstrates that Aitken counter’s measurements are not directly comparable to modern CPCs, and they have significant counting uncertainties. However, this article provides some guidance to relate the performance of this classical adiabatic expansion instrument to that of the continuous flow particle concentration instruments that are now commonly used for total particle number concentration measurements.
In this study, we evaluated the performance of the PAC using modern techniques of particle generation and detection and developed an interactive three-dimensional (3D) model of the instrument. We conducted this study using a PAC made available to Clarkson University through a generous donation from Mr. Bob Gussman of BGI, Inc.
Design
An exact 3D representation of the PAC was first modeled in a CAD software and a cross-section view was created as shown in . The PAC consists of two pipes, one that primarily acts as the barrel of a pump and the other that acts as the flow supply line. The two pipes are connected to a chamber, called the receiver.
Figure 1. Schematic view of the PAC.
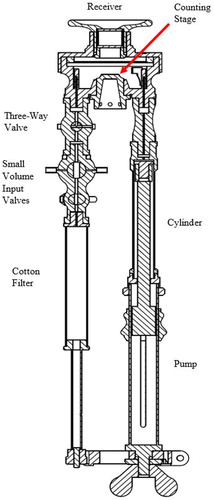
The receiver has a magnifying lens on the top that can be used to look through the chamber at the counting stage, a 1-cm2 glass slide on the lower face of the chamber. The counting stage is gridded into 1 mm2 squares that are used to count particles. On the right side of the receiver, there is a piston composed of the pump and cylinder. There is a scale on the pump that shows the amount of air, in cm3, that is being input to the piston and a ratio of the total volume of the instrument. The markings go up to 15 cm3 and include 1/5, 1/10, 1/20, and 1/50 of the total volume. This feature allows the particulate laden air to be diluted at different ratios with clean air that is already inside the instrument. It also allows for different volume expansion ratios. On the left side of the receiver, there is a three-way valve that can be connected to the receiver, outside air, or the cotton filter. The three-way valve can be configured in three different positions, as shown in .
Figure 2. Operating positions of the three-way valve (B).
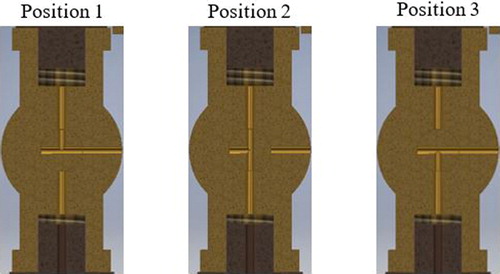
Figure 3. Autodesk Inventor model.
The small volume input valves are two valves that, when turned, permit the volume of ambient air inside the valve corresponding to 0.375 cm3 or 0.075 cm3 or 1/200 and 1/1000 of the total volume, respectively, to enter the counter. The small volume input valves provide two dilution ratios that are higher than the pump accurately allows. Below the small volume input valves, there is a cotton filter that can input filtered ambient air with no particles in it.
Operation
For particle concentration measurements, the instrument volume is filled with clean air to ensure that there are no particles in the receiver. To fill the instrument with clean air, the three-way valve is turned to Position 2 so that the chamber is connected to outside air through the cotton filter. As the piston is pulled down, air is drawn through the cotton filter and the filtered air fills the instrument. The three-way valve is then set to Position 1, and the piston is pushed upward expelling air out of the instrument. Repeating these steps multiple times will ensure that the counter is filled with clean air and is ready for particle concentration measurements.
To measure particle concentrations, the desired amount of ambient air is sampled by selecting different sample volumes in the piston pump. Since the chamber air is clean, the concentration of particles in the sample flow is diluted when mixed with the air already in the chamber. This dilution factor must be considered when the final concentrations are calculated. The three-way valve is set to Position 3 to ensure that no air is sampled or expelled through the valve. Then the piston is pulled down to a desired distance to bring in a volume equal to a fraction of the volume in the instrument; 1/5, 1/10, 1/20, or 1/50. As the piston is drawn down with all valves closed, a reduced pressure is created in the receiver. The low pressure in the receiver draws moisture from the dampened, paper lined walls of the receiver into the air until the air is saturated. When the three-way valve is opened to Position 1, the low pressure in the receiver draws in ambient air along with any particles that may be present. As the ambient air enters the low pressure region, it expands and is cooled. This supersaturates the air with water vapor that activates the airborne particles in the receiver. The activated droplets sediment out and collect on the counting stage. The particle concentrations can then be determined from the count of droplet numbers on the glass stage. The height of the chamber in the receiver is 1 cm and thus for a counting area of 1 cm2, the number of particles counted corresponds to a sample volume of 1 cm3. To determine the concentration of ambient particles, we need to consider the dilution. The number of drops is multiplied by the inverse of the dilution ratio (5, 10, 20, or 50, 200, 1000) to get a value in particles/cm3.
When the ambient concentration of particles is large, accurate measurement of particle concentrations requires drawing in a very small, precise volume of ambient air. This precise sample volume is drawn in using the small valves on the left pipe, the larger of the two allowing for a dilution ratio of 200 and 1000 for the smaller of the two. To start a measurement, the three-way valve must be in Position 2 to exclude outside air from the receiver and one of the small sample valves is turned so that ambient atmosphere is on both sides of the valve. This procedure fills the inside volume of the valve with ambient air. The other sample valve is turned to connect the three-way valve to the cotton filter and closes it to outside air. Next, the piston is pulled fully back to the 1/5 marking and the valve that is open to outside air is turned to input the volume of ambient air that was inside the valve. By turning this valve, it also opens the receiver to the cotton filter so that the pressure returns to atmospheric pressure with filtered air except for the ambient air that was input by turning the small volume input valve. The small volume input valves and cotton filter are only used for sampling air when the 200 or 1000 dilution ratios are used.
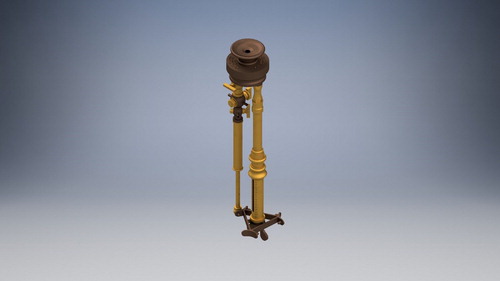
To visualize the instrument functioning, a virtual model was created on Autodesk Inventor (). This model provides a 3D view of the instrument and simulates the movement of its components similar to that of the real instrument. This model will help researchers and students learn about the instrument design features and its operational characteristics. A mesh of the model and a video of its operation are available for download from the link in the Supplementary Material.
Experiments
To characterize the PAC’s performance, we conducted several conventional tests on the unit available to us. The first test determined the filtration efficiency of the cotton filter in the sample flow pipe. This test was conducted by operating the instrument and sampling air through the cotton filter and recording the presence of any particles by nucleation in the receiver and settling as droplets onto the counting stage. In ten repeated tests, the maximum concentration was observed to be 20 cm–3, with the average concentration being 5.5 cm–3 showing that any particles that make it through the cotton filter do not have a significant impact on the overall measurement of the particulate concentration.
To measure the pressure expansion ratios, a pressure sensor was connected to the air inside the PAC through the outside air inlet on the instrument. Because the air inlet was only a hole in the three-way valve, an adapter was created to attach a tube to the outside air inlet on the instrument. To create an airtight seal, gasket material was put between the adapter and the air inlet with a hole stamped out in the middle allowing for air to pass from the inlet to the adapter. A short tube connected the inlet to a pressure sensor and the three-way valve was turned so that the receiver had a connection to the pressure sensor without any input air entering the receiver.
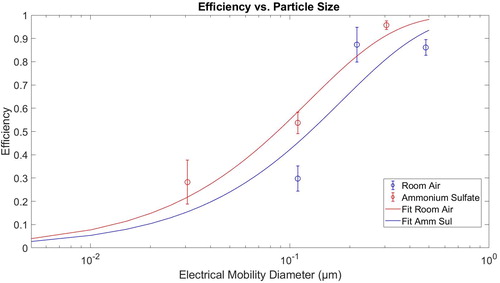
To test the accuracy and cut-point size of the instrument, ammonium sulfate particles were generated using an atomizer. As shown in , a regulator was connected to a compressed air source that went through a filter and diluted the ammonium sulfate particles.
Figure 4. Schematic of experimental setup.
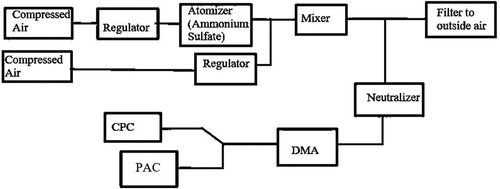
The particles were then passed through a DMA which was set to output particles of a selected size. The particle flow was then sent to the PAC or to a commercial CPC (Model 3781 CPC, TSI, Inc., St. Paul, MN, USA). Before each test trial, the regulator on the compressed air was adjusted until the particle concentration that was read by the CPC was stable. The regulator was also used to raise or lower the particle concentration depending on which dilution ratio the PAC was using. The concentrations were taken from the CPC and the PAC and compared for different particle sizes.
Because measurements from the PAC involve optically counting particles on the counting stage under a magnifying lens, a camera was used to reduce the human error as much as possible. shows pictures that were taken before a measurement (left) and after a measurement (right) using the PAC. It must be noted that when visually counted, the number of particles changed depending on eye angle to the instrument; however it is likely that an experienced operator, such as Aitken, would be able to minimize this error.
Figure 5. The counting stage before and after adjusting the images.
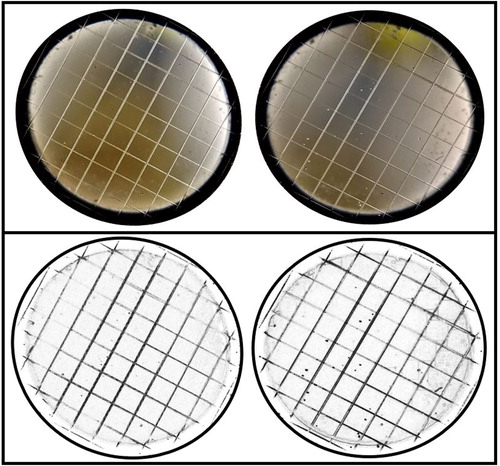
Differing amounts and angles of light through the counting stage made it difficult to differentiate between imperfections on the lenses used and droplets on the counting stage. For accurate counting, a picture was taken of the counting stage before and after expansion and the new features in the picture taken after expansion were assessed as droplets. As seen in , the before and after pictures were adjusted using ImageJ, image processing software developed by the National Institutes of Health and the Laboratory for Optical and Computational Instrumentation, to lower the brightness, subtract the background, and invert the image to make the droplets and blemishes on the glass show up better. Any dark spots that are on the after image and not the before image are classified as droplets on the counting stage.
Figure 6. PAC efficiency of ammonium sulfate and ambient particles.
Results
The initial characterization of the instrument was used to evaluate the expansion ratios and supersaturations possible in the measurement chambers. First, the volume expansion ratios were calculated from the CAD model by dividing the final volume by the initial volume for the four different expansion ratios. Next, the pressure expansion ratios were experimentally measured, in a random order three times for each mark on the piston. The measured pressure ratios were compared to calculated values assuming isentropic flow as detailed in . The measured expansion ratios are seen to be, in general around 5%–10% higher than the isentropic values. This difference suggests that the expansion process is likely polytropic, possibly because of heat transfer through the body of the PAC.
Table 1. Volume and pressure expansion ratios and expected supersaturations.
The pressure ratio values can be used for calculation of the expected temperature change in the measurement chamber. For the polytropic expansion process, the temperature change in the receiver can be calculated as
(1)
(1)
where n is polytropic expansion coefficient, and T1, T2, P1, and P2 are the temperature and pressure for the ambient and expanded conditions in the PAC, respectively. To estimate n, we consider the measured pressure and volume ratios, and determine the optimal value that best explains the polytropic relation between the variables. A median value of 1.25 best explained the measured data.
Using the estimated polytropic expansion ratio, the temperature drop in the chamber and the corresponding supersaturation in the chamber is calculated for different volume expansion ratios. The maximum supersaturation of 3.41% is expected at the highest expansion (1/5 dilution ratio). The critical supersaturation, based on the observed cut-size of 100 nm, was calculated to be 1.89% using kappa-Koehler theory. Current CPCs, including the TSI 3781, typically have supersaturations of about 200% (Hering et al. Citation2005), far greater than in the PAC. The 1/5 dilution ratio allows for the detection of the smallest particles using the highest supersaturation. Because the 1/200 and 1/1000 dilution ratios, controlled by the small volume valves, can use any of the four listed expansion ratios in the table, they would be able to detect the smallest diameter of the particles by drawing the piston all the way back to 1/5. If the number of droplets seen on the glass slide is high even with a 1/1000 dilution ratio, then the extent to which the piston is drawn back is reduced. This limitation reduces the number of droplets formed and increases the lower size limit of activation.
The efficiency of the PAC was tested multiple times for three different particle diameters, 30 nm, 110 nm, and 305 nm. The efficiency of the PAC is calculated from the ratio of the concentration of particles measured by the PAC to that obtained from measurements by the TSI CPC. The results of the average efficiency calculated from the repeated measurements are shown as a function of particle diameter in . The measurements show that the cut-point size is ∼100 nm.
The next test that was performed on the instrument was to determine the dependence of the cut-point size, the diameter of 50% counting efficiency, on particle composition. This test was performed using ambient room air, size selected using a DMA. Testing ambient room air is more akin to what John Aitken would have taken measurements on with the PAC. The three particle diameters used in this test were 110 nm, 220 nm, and 480 nm. The average efficiency values for these particle diameters are shown in . The cut-point size for the instrument with the ambient air was seen to be about 150 nm. Thus, the exact cut-size is somewhat composition dependent but is estimated to range from 100 to 150 nm.
Figure 7. Efficiency of PAC with different dilution ratios.
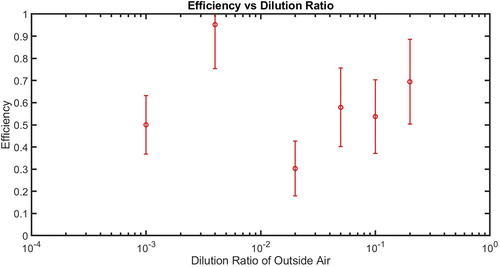
The PAC operation requires selection of a dilution ratio and this choice is dependent on the expected particle concentration. Ideally, the performance of the instrument would be independent of the choice of dilution ratio. To test instrument performance under different dilution ratios, we used DMA-generated 110 nm ammonium sulfate particles, corresponding to the cut-point size found in the previous experiment. The particle concentrations were measured by the TSI CPC and the PAC. The PAC was operated under different dilutions available in the instrument, 1/5 or 15 cm3 sample air, 1/10 or 7.5 cm3 sample air, 1/20 or 3.75 cm3 sample air, 1/50 or 1.5 cm3 sample air, 1/200 or 0.375 cm3 sample air, and 1/1000 or 0.075 cm3 sample air. The efficiency of the PAC under these different operations is shown in . The efficiencies were consistently about 50% for the low dilution ratios of 1/5, 1/10, and 1/20, while they varied widely for the high dilution ratios of 1/50, 1/200, and 1/1000. We, thus, believe that measurements with the PAC were more precise under conditions of low concentrations than high concentrations.
Conclusions
Testing of the PAC concluded that its cut-point size for particles of nonuniform compositions is around 150 nm. The PAC, thus, significantly undercounts airborne particle concentrations when compared to the measurements made by modern CPCs that have cut-point sizes between ∼2 and –10 nm. The PAC measurements are more comparable to that of a modern optical particle counter (OPC) than a modern CPC.
The accuracy of the measurements can also be estimated based on the dilution ratios used in the measurement. The 1/50, 1/200, and 1/1000 dilutions resulted in inconsistent measurements meaning that they may not provide reproducible concentrations. The primary approach to determining which dilutions provided the most accurate results was based on the particle concentrations. If the particle concentration is high, such as 35,000, then it can be assumed that either the 1/1000 or 1/200 marking was likely used to make the measurement. It is harder to identify what dilution was used with smaller measured concentrations that may be multiples of 5, 10, or 20. Thus, the accuracy is less certain in the range where the marking used may have been 1/50 or 1/20. In this range, it is not certain if the concentration is accurate or inaccurate.
The PAC was used to record particle concentrations all over the world. PAC measurements are uncertain and depend heavily on the dilution ratio and operator expertise. Thus, the PAC measurements are not directly comparable to modern CPCs because of the differences in accuracy and cut-point size.
Supplemental Material
Download MS Word (12.4 KB)Acknowledgments
Clarkson University would like to express its deep gratitude to Mr. Bob Gussman for the donation of his collection of historic aerosol instruments to Clarkson University and thereby, making this study possible.
References
- Aitken, J. 1888. On the number of dust particles in the atmosphere. Nature 37 (957):428–30. doi:10.1038/037428a0.
- Aitken, J. 1890. On improvements in the apparatus for counting the dust particles in the atmosphere. Proc. R. Soc. Edinb. 16:135–72. doi:10.1017/S0370164600006222.
- Aitken, J. 1892. On a simple pocket dust-counter. Proc. R. Soc. Edinb. 18:39–52. doi:10.1017/S0370164600007240.
- Condy, H. B. 1862. Air and water: Their impurities and purification. John W. Davies. http://books.google.com/books?id=U69cAAAAcAAJ
- Cunningham, D. D. 1873. Microscopic examinations of air. Calcutta, India: Superintendent of Government Printing. http://books.google.com/books?hl=en&lr=&id=71NaAAAAcAAJ&oi=fnd&pg=PA1&dq=microscopic+examination+of+the+air+cunningham&ots=wxpGhTr6kb&sig=UWGWoiXmt0y7cRPkmKxgY6lEF2E#v=onepage&q&f=false.
- Hering, S. V., M. R. Stolzenburg, F. R. Quant, D. R. Oberreit, and P. B. Keady. 2005. A laminar-flow, water-based-condensation particle counter (WCPC). Aerosol Sci. Technol. 39 (7):659–72. doi:10.1080/02786820500182123.
- McMurry, P. H. 2000. The history of condensation nucleus counters. Aerosol Sci. Technol. 33 (4):297–322. doi:10.1080/02786820050121512.
- Nolan, P. J., and L. W. Pollak. 1946. The calibration of a photoelectric nucleus counter. Proc. R. Irish Acad. A9:9–31.
- Pearson, G. 1814. On the coloring matter of the black bronchial glands, and of the black spots of the lungs. Med. Phys. J. 31 (180):128–36.
- Podzimek, J. 1989. John Aitken’s contribution to atmospheric and aerosol sciences – One hundred years of condensation nuclei counting. Bull. Am. Meteor. Soc. 70 (12):1538–45. doi:10.1175/1520-0477(1989)070<1538:JACTAA>2.0.CO;2.
- Scholz, J. 1932. Vereinfachter Bau eines Kernzlihlers. Meteor. Z. 49:381–8.
- Spurny, K. R. 1998. Methods of aerosol measurement before the 1960s. Aerosol Sci. Technol. 29 (4):329–49. doi:10.1080/02786829808965573.
- Thornes, J. E. 2008. Cultural climatology and the representation of sky, atmosphere, weather and climate in selected art works of Constable, Monet and Eliasson. Geoforum 39 (2):570–80. doi:10.1016/j.geoforum.2006.10.015.