
 ?Mathematical formulae have been encoded as MathML and are displayed in this HTML version using MathJax in order to improve their display. Uncheck the box to turn MathJax off. This feature requires Javascript. Click on a formula to zoom.
Abstract
The analysis of dust collected on the filters installed in the heating, ventilation, and air-conditioning (HVAC) systems, filter forensics, is a useful approach to explore concentration, size distribution, and composition of indoor particles. The extraction of dust from filters represents one of the biggest challenges to obtain accurate results from filter forensics. Although vacuuming is one of the most common dust extraction techniques, it is unclear how efficient it is and whether it provides a representative sample in terms of particle size. In this article, we used a high-capacity vacuum sampler to extract dust from 20 filters artificially loaded with well-characterized test dust as well as from 41 filters naturally loaded in residential HVAC systems. After all extractions, we recovered 0.1–5.5 g and 0.02–11.4 g of dust from the artificially and naturally loaded filters, respectively. These ranges were equivalent to 11.3–52.2% and 1.8–72.9% recovery efficiency, the ratio of dust recovered to the dust loaded in the filters. Multiple extractions were found to be an effective strategy to add to the recovery to enable filter forensics for the detection of multiple analytes. The recovered samples were slightly over-representative of particles greater than 10 µm. Therefore, caution should be taken when applying filter forensics for studying contaminants associated with smaller particles.
Copyright © 2020 American Association for Aerosol Research
EDITOR:
Introduction
The analysis of dust collected on the filters of heating, ventilation, and air-conditioning (HVAC) systems is referred to as filter forensics, a promising technique to explore indoor particles. Filter forensics has several benefits over other conventional particle exploration techniques such as airborne sampling and settled dust collection. When used in a fully recirculating distribution system and combined with the HVAC metadata (e.g., filter efficiency, runtime, and airflow rate), filter forensics provides a quantitative time- and space-integrated estimate of indoor particle characteristics due to a long-term passing of indoor air from the entire conditioned space through the filter (Stanley et al. Citation2008; Batterman et al. Citation2010; Haaland and Siegel Citation2017; Givehchi et al. Citation2019). Airborne sampling and settled dust are often not spatially and temporally representative of indoor particles. Airborne sampling is limited to the time and location of sampling. Settled dust age is unknown due to unknown frequency of cleaning, and it is not spatially representative if dust is collected from a single building zone. Efficient filters can also capture a high fraction of smaller particles (e.g., <10 µm) (e.g., Stephens and Siegel Citation2013; Azimi, Zhao, and Stephens Citation2014) which are underrepresented in other dust forms such as settled dust due to their low deposition rate on indoor surfaces (e.g., Thatcher and Layton Citation1995). Overall, because of the integration over time and space and likely less bias in terms of particle size, filter forensics may obtain a more accurate representation of indoor particles.
The extraction of dust from filters is an essential step of most filter forensics applications and represents a major challenge due to the unknown dust recovery efficiency from a filter. There are many different techniques reported for the extraction of dust from HVAC filters which could be either wet (i.e., in a liquid solvent) or dry and may include ultrasonication or mechanical means to increase the recovery of dust from the filter. These techniques are shaking and scraping (Noris, Siegel, and Kinney Citation2009), brushing (Ni et al. Citation2011; Besis et al. Citation2014), picking via tweezers (Tan et al. Citation2007a, Citation2007b; Li and Fu Citation2013), cut and elution (Stanley et al. Citation2008; Farnsworth et al. Citation2006; Maestre et al. Citation2018), swabbing (Maestre et al. Citation2018), and vacuuming (Kang, Cheung, and Wong Citation2010; Maestre et al. Citation2018). The recovery from HVAC filters was, however, identified in a few studies and for specific analytes only (e.g., bacterial, viral, and fungal communities) (Stanley et al. Citation2008; Farnsworth et al. Citation2006; Maestre et al. Citation2018). Maestre et al. (Citation2018) demonstrated that vacuuming extracted higher quantities of bacterial and fungal DNA from dust with more diversity and less variability than cutting/elution and swabbing. Despite the findings of Maestre et al. (Citation2018), it is unclear what amount of dust can be recovered and whether the recovered dust is representative of the dust captured by the filter in terms of particle size when vacuuming is applied. The recovery amount is important for compositional analysis, particularly if multiple analytes are targeted for filter forensics given the detection of each analyte requires a minimum amount of dust. Acquiring a more representative sample is also essential for accurate chemical analysis because the concentrations of many analytes such as trace metals or semi-volatile organic compounds (SVOCs) are not uniformly distributed across all particle sizes (e.g., Lewis et al. Citation1999; Rodes et al. Citation2001; Cao et al. Citation2012).
The purpose of this article is to explore vacuum extraction from both naturally and artificially loaded filters by addressing (i) the amount of dust vacuuming recovers from a filter and (ii) the representativeness of the recovered sample defined here as the similarity between the particle size distribution of the sample recovered and the dust captured in the filter. We first developed an extraction procedure using a high-suction flow vacuum sampler and applied it over different HVAC filters loaded with known amounts and types of test dust. We, then, evaluated the factors that influenced the amount of recovery, as well as the particle size distributions of the recovered dust. We also extended the extraction approach to naturally loaded filters installed in residential HVAC systems. The overall goal of this article was to provide insight into the capabilities and limitations of vacuuming and the best approach to extract dust. The broader goal of this article was to further enable filter forensics as an approach for exploring indoor particles.
Materials and methods
We extracted dust from two sets of filters: (i) filters artificially loaded with standardized test dust samples in the lab (Phase 1, n = 20) and (ii) filters naturally loaded with airborne particles in the recirculating HVAC systems of 20 single-family residences (Phase 2, n = 41). We measured the amount of recovery (g) by quantifying the mass of dust recovered from the filter as well as the recovery efficiency (%), the ratio of the dust mass recovered from the filter per total dust mass captured in the filter in both phases. We also verified the representativeness by comparing the particle size distributions of the dust captured in the filter and the dust recovered from the filter in Phase 1 only (due to the unknown particle size distribution of airborne particles on the naturally loaded filters in Phase 2). To explore the influence of filter efficiency on the amount of recovery and representativeness, we selected four types of filters distinguished with their nominal efficiency used in both phases (Figure S1 in the supplementary information [SI]). These nominal efficiencies were identified with the minimum efficiency reporting values (MERVs) from ANSI/ASHRAE Standard 52.2 (Citation2017) and were MERV 8 (both electret and non-electret media), MERV 11, and MERV 14. Table S1 outlines our full test matrix with all other variables including dust type, loading mass, and extraction cycles. We considered loading and extraction from MERV 11 filter tests as base cases (Cases #3 and 7 in ) as we performed replicates on these base cases to determine within-case variations in the amount of recovery and representativeness from one filter type.
Filter loading
In Phase 1, we artificially loaded the filters with one of the two commercially available test dust samples: ISO Fine and ASHRAE #2 (Powder Technology Incorporated, PTI, Arden Hills, MN, USA) referred to as ISO and ASHRAE in the rest of this article. Details regarding the composition and particle size distribution of both test dust samples are provided (SI, Figure S2, and Tables S2 and S3). We loaded the filters of this phase by evenly sprinkling the known amount of one of the test dust samples over the horizontally oriented filter (Figure S3) and then gently shook the filter to embed the dust in the filter. We then passed an artificial backflow across the filter from its downstream side using a commercial vacuum sampler (Dustream, Indoor Biotechnologies, Charlottesville, VA, USA) equipped with a filter insert (Figure S3). We measured the mass of dust captured in each filter (Md) by the differential weighing of the filter before and after loading using a balance with the weigh-below hook (Sartorius MSE3203S, Goettingen, Germany) and subtracting the two filter mass values. Across all filters, the mass of dust captured ranged from 0.6 to 14.8 g (median = 2.0 g). With a few tests in Phase 1, we loaded filters with larger masses (>13 g) to resemble heavy loadings (Cases #3 and 7 in Table S1). Additional information on filter loading is in the SI (Section Filter Loading and Figures S2–S4).
The natural loading of filters in Phase 2 took place as part of a bigger project studying filtration in 21 homes in Toronto, Canada (ASHRAE RP-1649, Li et al. Citation2019). The overall project had 84 filters from four three-month deployment periods in each house (one home had two filters). We considered 41 of all these filters for this article, while the rest were used for commercial filter efficiency testing. Similar to the artificially loaded filter cases, we measured the total mass of dust captured in the filter by differential weighing of the filter before and after deployment in the field using the same balance in Phase 1 (Sartorius MSE3203S). In general, we collected a large dust mass range (1.1–19.0 g, median = 3.9 g) with the naturally loaded filters. The mass of dust on the naturally loaded filters depended on indoor particle concentration, filtration airflow, system operation time, and filter efficiencies in these residences. Each filter (in either phase) was kept with loaded face oriented upward inside of a unique antistatic bag during all handling to avoid contamination before and after loading.
Extraction and dust recovery
We extracted dust from the filters of both phases using a high-suction vacuum sampler constructed with polyvinyl chloride (PVC) and metallic plumbing parts. The sampler plans were provided by Kevin Kennedy at Children’s Mercy Kansas City. A complete description of the sampler is in the SI (Figure S5). Compared to a commercially available vacuum sampler (Dustream, Indoor Biotechnologies, Charlottesville, VA, USA), our sampler had a flow rate almost three times greater (60–70 m3/h vs. 21–22 m3/h) due to its large size causing resuspension of more particles and retaining more dust recovered from the filters. The sampler was equipped with a dust sock (X-cell-100 Dust Collection Filter Sock, Allied Filter Fabrics, Hornsby, Australia) to collect the dust aimed for filter forensics as well as a nominal 1-mm sieve for the removal of larger particles/fibers to extend the capacity of the dust sock. The sampler was connected to a canister vacuum cleaner (Eureka, Model 3670, Parsippany, NJ, USA). To avoid cross-contamination, we used a clean set of sampler pieces (sieve, dust sock, flanged tailpiece, and other connections) for each filter (SI Section Dust Accessory Cleaning).
To extract dust, we placed the diagonal end of the flanged tailpiece (Figure S5) on the filter and vacuumed the filter by moving the tailpiece head along the filter pleats for the entire filter length. In each extraction cycle, we vacuumed filters until the dust sock got full enough to diminish suction flow (generally for less than five minutes). The duration of vacuuming in Phase 1 (artificially loaded filters) varied as we were still refining the extraction technique. Naturally loaded filters (Phase 2) were vacuumed for a fixed duration of 5 min to eliminate any variations caused by extraction duration. When the sieve was blocked, we cleared it using a brush or spatula for the cases of the artificially and naturally loaded filters, respectively. Upon completion of extraction, we disassembled the sampler and recovered any collected dust left in the dust sock and on the inner wall of the coupler by reversing the dust sock and tapping/shaking the coupler and storing the dust into a container in both phases (referred to as after-sieve dust). With the ASHRAE-loaded filters in Phase 1 and all the filters in Phase 2, we also recovered the dust captured by the sieve by picking dust via tweezers or gently shaking the sieve and stored it in a separate container (i.e., pre-sieve dust). The containers used to store the dust were Petri dishes in Phase 1 and amber vials in Phase 2. To overcome the limited retention capacity of the sampler, we often completed more extraction cycles for the same filter to increase dust recovery from a filter (Table S1). The number of extraction cycles in Phase 2 was generally higher because of the importance of this natural dust for future filter forensics analyses. We generally stored the dust recovered from different extractions of the same filter in the same storage containers, as we found a negligible influence of adding dust fractions from the same filter on the particle size distribution of the cumulatively added dust (Figure S6).
We measured the masses of after-sieve dust (Mas) and pre-sieve dust (Ms) by the differential weighing of the after-sieve and pre-sieve containers before and after the addition of dust using the Sartorius MSE225S microbalance. We then calculated the after-sieve and pre-sieve recovery efficiencies (ηas and ηs, respectively) by dividing Mas and Ms by the total mass of dust captured in the filter (Md), and calculated the overall dust recovery and recovery efficiency by adding Mas to Ms and ηas to ηs, respectively. As we performed multiple cycles over the same filters in many cases, we often reported a cumulative amount of recovery and recovery efficiency by summing Mas and Ms over all extraction cycles. We also completed additional analyses on the extraction mass closure, the ratio of overall dust recovered from the filters to the dust suctioned from the filters as well as dust gain processes and loss mechanisms during the extraction. These analyses are described in the SI (Section Extraction Processes: Dust Loss and Gain, Figures S7–S9).
Size distribution analysis
We analyzed the volumetric particle size distribution of our targeted samples using a Malvern Mastersizer 3000 (Malvern, United Kingdom), a laser diffraction particle sizer (LDPS) for a size range from 0.1 to 3500 µm for a total of 92 size channels (equivalent to 20 channels per decade). Our targeted samples were ISO and ASHRAE test dust as well as the recovered dust from all the artificially loaded filters (Phase 1). Masses of dust samples added to the LDPS were varying from test to test due to different recovery amount from each filter (see Results and Discussion: Phase 1). We first added 10–20 mL of distilled water to the recovered dust container and gently shook the container to encourage a homogeneous dispersion. We then introduced the initially dispersed samples to a Hydro EV cell in the LDPS. We performed the size distribution analysis based on five runs of the same dust sample and reported the mean of channel results as the outcome. Size distribution curves were calculated for refraction and absorption indices of 1.6 and 0.1 (–), respectively, and a density of 2.8 g/cm3 (the rationale for these values is in the SI Section Test Dust Samples) to ensure a close agreement between the ISO test dust measured and certified results provided by the ISO test dust manufacturer (Figure S2).
Statistical analysis
To test hypotheses about the influence of single parameters (e.g., filter type, extraction cycles, or test dust), we used the Wilcoxon signed-rank or rank-sum nonparametric tests for the paired or unpaired data, respectively, since the within-group data were not always normally or log-normally distributed (as assessed with a Shapiro-Wilk test). All the comparisons were performed with Bonferroni corrections owing to the use of the same dataset for multiple tests. We also examined the representativeness, the similarity of particle size distributions of the recovered and test dust samples using the two-sample Kolmogorov–Smirnov test. Statistical tests were all performed in Stata version 13.1.
Results and discussion
We recovered a wide range of dust mass in both phases after all extraction cycles over the same filters (Figure S10). We obtained an overall dust recovery of 0.1–5.5 g (median = 0.6 g) and 0.02–11.4 g (median = 1.0 g) from the artificially and naturally loaded filters (Phases 1 and 2), respectively, corresponding to an overall recovery efficiency of 11.3–52.2% (median = 27.7%) and 1.8–72.9% (median = 26.9%).
Phase 1: Dust recovery from the artificially loaded filters
illustrate the overall cumulative mass recovered and recovery efficiency after the first (black markers) and second (red markers) extraction cycles performed over the artificially loaded filters, shown in terms of filter type (marker shape), loading test dust (marker fill), and loading dust mass (marker size). The markers representing the two cycles over the same filter are linked via dashed lines. The majority of the dust was recovered by the after-sieve portions of the sampler (∼100% and 80.0%–98.7% after the extraction from the ISO- and ASHRAE-loaded filters, respectively). After the first extraction cycle, the overall mass recovery and recovery efficiency ranged from 0.1 to 1.7 g (median = 0.4 g) and 2.9%–44.6% (median = 21.2%) (n = 20), respectively. We observed a large variation both within and between the cases. With the MERV 11 filter base cases (Cases #3 and 7 in Table S1) where we performed replicates, we calculated a 60% (ISO test dust) and 73% (ASHRAE test dust) coefficient of variations (CV), the ratio of the standard deviation to mean, in the masses recovered. These numbers correspond to 47% and 55% CVs for recovery efficiency. The large variations among the replicates were dependant on the procedure details (e.g., extraction duration and the style we handled the sampler during the extraction) as we developed our approach. In some tests, we vacuumed the filter for less than five minutes until the dust sock became loaded and the flow dropped. The style of extraction also varied in terms of the spacing between the sampler tip and the filter as well as the amount of time spent in different areas of the filter. The resulting CVs were applied as a measure of the expected variation for the other cases. However, this variation is likely overestimated as the extraction procedure was still being refined during Phase 1. Also, it is much larger than the uncertainty that arises from the weighing procedure. We also observed variations between the cases (i.e., from the base case to the other cases). For instance, the recovery from the MERV 8 filter loaded with ISO (Case # 1 in Table S1) was lowest among all the cases (i.e., 0.1 g equal to 7.5% recovery efficiency). The existence of the cardboard screen on the filter resulted in an ineffective contact between the vacuum sampler and filter surface and a low recovery and led to a decision to remove the cardboard before the second extraction cycle, in this case, to recover more dust after the second cycle (). Similarly, we removed the cardboard and metal screens from all MERV 8 and MERV 14 filters in other cases (Cases # 4, 5, and 8 in Table S1) before extraction. Although artificial loading might not fully represent natural loading of filters due to the different loading mechanisms, the recovery efficiency results presented here provide insight on how much mass needs to accumulate on a filter (depending on the mass of dust needed for the specific analytes) before it can be used for filter forensics (Haaland and Siegel Citation2017). The range reported here is also consistent with the use of other recovery efficiencies assumed for other quantitative filter forensics investigations (Mahdavi and Siegel Citation2018; Givehchi et al. Citation2019).
Figure 1. Overall cumulative mass recovered (a) and recovery efficiency (b) from the artificially loaded filters in terms of test dust and filter type. Dashed lines connect first (black) and second (red) cycle of extraction over the same filter. Larger size markers denote heavily loaded filters (>4 g).
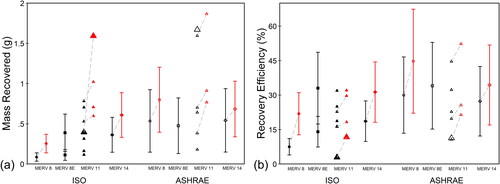
Among all the varying parameters, the number of extraction cycles led to a significant increase in the cumulative mass recovery as well as the cumulative recovery efficiency (p < .01, signed-rank test). We found the cumulative overall mass recovered increased from 0.1–1.6 g (median = 0.5 g) to 0.3–1.9 g (median = 0.8 g) after the second cycle (n = 11). Among these filters, only one was heavily loaded and the rest were loaded with <4 g of dust indicating that performing the second extraction cycle is useful even over lightly to moderately loaded filters. Figure S11 illustrates the only example in Phase 1 where we did seven extraction cycles over one of our heavily loaded filters (13.6 g of ISO test dust) and still recovered a substantial mass of dust after all cycles (5.5. g equivalent to 40.2% recovery efficiency). The recovery of dust takes place faster at the beginning of each cycle of extraction. However, once the dust sock gets filled, the suction flow rate drops due to the elevated pressure drop. It is often more effective to empty and clean/replace the dust sock after it is filled with 1.5–2.0 g of dust. Except for the cycle number, most of the other varying parameters (e.g., dust mass captured in the filter, filter type, and test dust) were uninfluential on the recovery data in Phase 1. We found no influence by dust mass captured in the filter on the recovery efficiency. The influence of dust mass in the filter on the recovery amount was complex depending on the extraction cycle numbers due to wide variation in both dust mass and recovery amount (Figure S12). Although we found no correlation between the recovery and filter type in Phase 1, extraction from MERV 8E and MERV 11 filters was more convenient due to no cardboard/metal support screens on the filter upstream side and no need for cutting the screens.
Phase 1: Sample representativeness
illustrates the volume size distribution of the test and recovered dust samples by the after-sieve parts in Phase 1 for the base cases (i.e., MERV 11 filters where we performed replicates). The same illustrations for other filter types (MERVs 8, 8E, and 14) are in Figure S13. The error bars in and S13 represent the minimum and maximum of the channel volumes among the five runs of the same sample if there was no replicate filter (i.e., n = 1), and the maximum and minimum among all runs of all the replicates otherwise (n > 1). With most of the cases, the recovered dust contained more particles >10 µm than the original test dust. The Kolmogorov–Smirnov statistical test revealed the particle size of the test and recovered dust samples came from different distributions (p < .01). A smaller recovery of particles <10 µm could be due to a lower detachment of these particles from the filter media or particle cake, or due to a decreased chance of capture by the sampler once detached. Previous studies reported that the binding forces between smaller particles and rough surfaces are stronger when compared to larger particles (e.g., Boor, Siegel, and Novoselac Citation2013). The underrepresentation of particles <10 µm highlights one of the challenges of extraction by vacuum samplers and may also be explained with the loss of smaller particles by passing through the dust sock or the agglomeration of smaller particles together inside the dust sock. A potential solution to this challenge could be the separation of >10 µm particles using a sonic sieve or similar technique and then analyzing each fraction separately. Future work is required to verify whether this bias is important for chemical and biological analyses, and will likely depend on the particle sizes associated with the analyte of interest.
Figure 2. Particle size distribution of ISO and ASHRAE test dust and the recovered dust from MERV 11 filters (i.e., base cases). n refers to the number of analyzed samples.
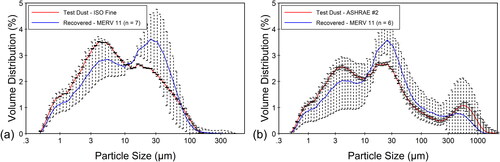
The extent of the underrepresentation of particles <10 µm in the recovered sample varied from sample to sample in both the base case replicates (MERV 11) and between cases ( and S13). One of the main factors causing variation was the different masses of dust captured in the filter. With the base cases, we found there is, in general, closer proximity between the size distribution curves of the test and recovered dust, particularly for sizes <10 µm when the filter was loaded with more test dust (Figure S14). We also found the recovery from the MERV 8 filter loaded with ISO test dust (Case #1 in Table S1) leads to one of the biggest underrepresentation of particles <10 µm (Figure S13a) which might have been caused by the lack of effective contact between the sampler and the filter surface due to the presence of the cardboard support screen. This suggests that removing filter screens is important to obtain both a higher amount of dust and a more representative sample of dust. These representativeness results we presented here are specific to volume distributions. We found a negligible deviation between the count-based size distributions of the recovered and test dust samples (Figure S15) although caution should be taken with count-based size distribution finding due to the LDPS conversion assumptions including constant density and equal shape of all particles. The representativeness results were also presented for the after-sieve fraction since the pre-sieve fraction recovered in Phase 1 was negligible (Figure S16).
To further explore the representativeness of recovered samples, we also performed modal analysis on the test dust samples as well as dust recovered from the filters as described in the SI Section Modal Analysis. This modal analysis was established based on fitting the size distributions of the test and recovered dust by multiple log-normal modes (i.e., Figure S17). After the analyses, we found that lack of a representation of the recovered sample was due to change in the magnitude, geometric mean (GM), and geometric standard deviation (GSD) of the modes constituting the test dust samples (Figures S18–S20). A smaller magnitude of the mode with a GM <10 µm was obvious for all the recovered samples when compared to their test dust suggesting loss of dust in this range during the extraction (Figure S21). A slight displacement of the GMs for some larger modes (>100 µm in the case of recovery from ASHRAE-loaded filters) could be because of the removal of some larger particles in this mode by the sieve (Figures S18 and S19). This displacement could also be explained by the large variations in the amount of the cotton linters from sample to sample or loss of linters during the circulation of the dispersed sample inside the LDPS when it is analyzed for the size distribution. It is often normal to see more variations with >100 µm particles in any sample introduced to the LDPS due to gravitational settling and circulation losses in the LDPS dispersion flow. The change in the GM of some of the modes in the recovered sample might have been due to the agglomeration of particles in this mode contributing to a larger mode. A comprehensive discussion of modal analysis is in the SI (Modal Analysis Section).
Phase 2: Natural loading – dust recovery
There was a methodological difference between the two phases of this article. In Phase 2, we fixed the extraction duration of 5 min per each cycle to minimize variations arising from this factor. Despite this difference, we found a large variation with the amount of recovery and recovery efficiency both within and between cases, even with the refined extraction technique. illustrates the overall cumulative recovery amount and efficiency in terms of filter type and cycle numbers (denoted by colors) for the first three cycles. The box plots of after-sieve and pre-sieve recovery and recovery efficiencies are illustrated in Figure S22. The same data point-by-point is also shown in Figure S23 for the entire number of cycles. After the first extraction cycle, we recovered an overall 0.02–3.3 g (median = 0.5 g), 0.04–1.4 (median = 0.5 g), 0.06–0.8 g (median = 0.4 g), and 0.04–1.1 g (median = 0.2 g) of dust from the MERV 8, 8E, 11, and 14 filters, respectively. These ranges corresponded to 1.8%–22.6% (median = 11.7%), 3.5%–35.3% (median = 13.9%), 2.0%–18.6% (median = 6.4%), and 0.8%–12.0% (median = 7.8%) overall recovery efficiency. Using these ranges, we calculated CVs of 124%, 73%, 66%, and 115% in the overall dust recovery and 63%, 60%, 81%, and 62% in the overall recovery efficiency for the four filter types, respectively. These CVs were generally equal to or greater than the CVs we calculated in Phase 1. These large variations in Phase 2 are likely due to different compositional and physical properties of different natural dust samples including their size distribution, morphology, and inter-particulate adhesion when compared to standardized test dust samples. Another common finding between the two phases was the significant influence of the extraction cycle number on the cumulative mass recovered and recovery efficiency when we compared the results of the first extraction cycle to the later cycles (p < .01, rank-sum test). The overall cumulative mass recovered were 0.04–3.3 g (median = 0.5 g), 0.1–5.7 g (median = 0.9 g), and 0.1–7.7 (median = 1.1 g) after the first, second, and third extraction cycles over the filters that went through at least three extraction cycles (n = 38). A substantial loss of particles during extraction was another common finding between the two phases, as we found the extraction mass closure, the ratio of the overall dust recovered per the dust vacuumed from the filter, was less than the unity (Figure S9). The loss of dust could have taken place by <10 µm particles passing through the dust sock and/or dust resuspension from the filters or the dust sock and sampler during filter or sampler handling. Detailed information on the extraction mass closure is in the SI (Figure S9).
Figure 3. Cumulative overall mass recovered and recovery efficiency from the naturally loaded filters. Colors denote cycle number (black: cycle 1, red: cycle 2, and blue: cycle 3). n represents the number of filters that are included in each box.
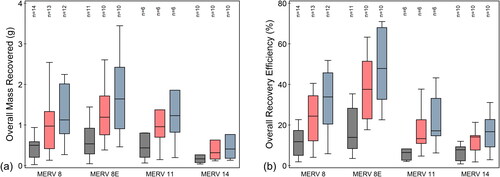
In addition to the similarities between the findings of the two phases, we found two major differences between the results of the two phases. First, the amount we recovered from the sieve was much greater (0.001–7.3 g, median = 0.4 g) in Phase 2 when compared to Phase 1 (∼0 g for ISO and 0.01–0.3 g, median = 0.06 g for ASHRAE). The next big difference was that the type of filters could significantly influence the recovery efficiency from naturally loaded filters (p < .01). The cumulative recovery efficiency from MERV 14 was significantly lower (3.4%–40.8%, median = 16.7%) compared to that from MERV 8E (3.5%– 72.9%, median = 47.9%) (p < .01, rank-sum) (Figure S10). The non-cumulative amounts of recovery and recovery efficiencies (from separate cycles) from MERV 14 filters were also significantly less compared to what we measured from the rest of the filters (p < .01, rank-sum test). These findings highlight the complexity of extraction from MERV 14 filters not only due to a requirement to remove the metal screens but also due to tighter filter pleats making the contact between the filter surface and sampler tip more difficult (Figure S1). These results suggest highly efficient filters may not be preferable for filter forensics applications, particularly if low mass loadings are anticipated.
Implications of recovery and representativeness
A key question in the application of filer forensics is the minimum mass of dust required to detect an analyte leading to a decision about the number of extraction cycles over a filter. The answer depends on the analyte type, its concentration in the dust (f: often reported as µg analyte/g dust), and the method detection limit (MDL) for the analysis approach (reported in µg of the analyte). EquationEquation (1)(1)
(1) combines the last two factors and determines the minimum mass (Mmin) required for the detection of an analyte. A lower minimum required mass which is an asset for filter forensics can be obtained by lower MDLs and/or higher analyte concentrations.
(1)
(1)
To estimate the minimum dust mass required in EquationEquation (1)(1)
(1) , we reviewed the literature to find MDL and f values for some of the common filter forensics chemical analytes including trace metals such as lead (Pb), cadmium (Cd), arsenic (As), chromium (Cr), and SVOCs such as polycyclic aromatic hydrocarbons (PAHs), polybrominated diphenyl ethers (PBDEs), polychlorinated biphenyls (PCBs), and phthalates summarized in . For each f and MDL, we found data under the two low and high scenarios. The variation of MDL mainly depends on how much a technique is capable to detect an analyte with smaller masses, while the variation in f is mainly due to the presence and extent of different contaminant sources indoors (Noris, Siegel, and Kinney Citation2009; Kang, Cheung, and Wong Citation2010; Kang et al. Citation2012; Bi et al. Citation2018). We initially searched for data among the filter dust studies; however, due to limited filter dust articles studying the above analytes (Haaland and Siegel Citation2017), we also searched data among settled dust studies (SI Concentration and MDL Data Section). Afterward, we estimated the minimum dust masses required for the detection of the analytes listed in under three scenarios. The minimum required mass under the worst-case scenario was calculated from EquationEquation (1)
(1)
(1) using high MDL and low dust concentration values. The medium-case scenario was calculated with low values for both concentration and MDL. The best-case scenario was calculated with high concentration and low MDL values. As seen in , under all scenarios, some analytes such as PCBs and arsenic required higher minimum dust masses, while other analytes such as phthalates and PBDEs required much less mass. In a case when a group of analytes is analyzed in one sample (such as trace metals or congeners of the same SVOC), the minimum mass should be determined by the element/component that requires the highest minimum mass (e.g., arsenic among trace metals in ). The presence or absence of a determinant element such as arsenic could, therefore, impact the minimum mass required for analysis.
Table 1. Minimum dust mass required in terms of analytes, their MDL, and concentrations.
We calculated a big variation between the required masses under the worst, medium, and best cases (). After comparing the minimum masses estimated in with the recovery amounts presented in , S22, and S23 (Phase 2), we estimated the detection rates of our samples, the number of samples with a mass above that required for the detection, for each analyte under all the best-, worst-, and medium-case scenarios (Figure S24). Under the best-case scenario, we would have a 100% detection rate for all the analytes in even after one extraction cycle. Under the worst-case scenario (i.e., high MDL and low concentration), some analytes such as PAHs, PBDEs, and phthalates still had a 100% detection rate even after one extraction cycle. For some other analytes such as trace metals, however, six extraction cycles (the maximum number we performed in Phase 2) did not provide a mass adequate for a high detection rate. Given arsenic was a determinant element among the trace metals (requiring the highest minimum mass), the absence of arsenic from the list of trace metals highly increased the detection rate of trace metals (from <5% to >50%). Moving from the worst- to medium-case scenario could also enormously increase the detection rates (>95% after two extraction cycles, see Figure S24) due to employing a technique that benefited from a low MDL and lower dust masses required (despite experiencing low concentrations). Overall, multiple extractions can be unnecessary (i.e., one extraction suffices) for some analytes (e.g., PAHs, PBDEs, phthalates) but still inadequate for some other analytes (e.g., trace metals with the presence of determinant elements such as As) or for multiple targeted analytes. Also, because the fractionation of dust required for multiple analyses could lead to dust loss due to handling, more extractions can ensure making up any dust loss during fractionation. Note that these findings are limited to the data we looked up in the literature and also to a limited number of analytes. Filter forensics has a wide application with biological and other analytes (Haaland and Siegel Citation2017), and the same approach presented here could be used to decide the number of extraction cycles over a filter.
The findings of representativeness in this study should be carefully interpreted as they are limited to artificially loaded filters. In artificial loading, dust is loaded by gravitational settling and the loading process takes place in a very short time. In natural loading, dust is loaded by a variety of mechanisms forming a dust cake on the filter fibers over the service life of a filter (typically months). The physical and chemical properties of natural dust may also be different from those of test dust. Other limitations of artificial loadings should also be acknowledged. These include the potential loss of particles being suspended into the ambient environment during loading or passing through the filter and not being captured inside the backflow filter insert. In some of the experiments we performed in Phase 1, there was a small fraction of dust from the sprinkled amount that was lost in the loading procedure not being captured in the filter nor the backflow filter insert (MERV 8E filters). In some other tests, however, this lost fraction was close to zero (MERV 14 filters). The outcome of representativeness for both cases with and without lost masses during loading was similar, which suggests the underrepresentation of recovered samples is due to the extraction of dust from the filter and not filter loading. Nevertheless, whether or not the dust captured in the filter is biased compared to the dust loaded in the filters is not fully known that may limit the representativeness investigations with artificially loaded filters. Given the underrepresentation of the recovered samples was evident for the fraction <10 µm, the representativeness is less of concern if there is a greater fraction of dust above 10 µm or an analyte associated with larger particles or uniformly distributed across all particle sizes. With most of the SVOC analytes, however, there is enrichment on small particles (Lewis et al. Citation1999; Cao et al. Citation2012). Because of this, the improvement of dust recovery below 10 µm should be a goal of future efforts. This improvement can be performed by either sieving the fraction >10 µm and/or combination of extractions such as wet sieving with in-line ultrasonication of filter media to detach more dust particles <10 µm when compared to dry vacuum extraction (Rasmussen et al. Citation2018).
Conclusion
The use of a high-suction vacuum sampler is promising to extract adequate dust for multiple filter forensics analyses. Overall, we recovered 0.1–11.4 g of dust from filters artificially loaded with standardized test dust or naturally loaded in residential HVAC systems. The samples recovered from the artificially loaded filters were slightly overrepresented for particles >10 µm, potentially due to loss of smaller particles, agglomeration of smaller particles, or preferential recovery of larger particles from filter surfaces. The selection of filter type was a key factor to increase recovery from the naturally loaded filters as the MERV 14 filters used in this investigation had the lowest recovery amounts and recovery efficiency when compared to other filter types. Multiple cycle extraction was usually effective at increasing dust recovery enabling filter forensics for the detection of multiple analytes or analyses requiring a high amount of dust due to low concentration and high MDL. Overall, despite the utility of a high-suction vacuum sampler approach for dust recovery, understanding its weaknesses may help identify biases or challenges for specific analytes.
Supplemental Material
Download Zip (5.3 MB)Acknowledgments
Yuchao Wan prepared the dust socks used to collect samples in Phase 2 of this study.
Disclosure statement
The authors declare no conflict of interest.
Additional information
Funding
Related Research Data
References
- Abb, M., J. V. Breuer, C. Zeitz, and W. Lorenz. 2010. Analysis of pesticides and PCBs in waste wood and house dust. Chemosphere 81 (4):488–493. doi:10.1016/j.chemosphere.2010.07.042.
- Al-Momani, I. F. 2007. Trace elements in street and household dusts in Amman. Soil Sediment. Contam. 16 (5):485–96. doi:10.1080/15320380701490184.
- ANSI/ASHRAE Standard 52.2. 2017. Method of testing general ventilation air-cleaning devices for removal efficiency by particle size.
- Azimi, P., D. Zhao, and B. Stephens. 2014. Estimates of HVAC filtration efficiency for fine and ultrafine particles of outdoor origin. Atmos. Environ. 98:337–346. doi:10.1016/j.atmosenv.2014.09.007.
- Batterman, S., C. Godwin, S. Chernyak, C. Jia, and S. Charles. 2010. Brominated flame retardants in offices in Michigan, USA. Environ. Int. 36 (6):548–556. doi:10.1016/j.envint.2010.04.008.
- Besis, A., A. Katsoyiannis, E. Botsaropoulou, and C. Samara. 2014. Concentrations of polybrominated diphenyl ethers (PBDEs) in central air-conditioner filter dust and relevance of non-dietary exposure in occupational indoor environments in Greece. Environ. Pollut. 188:64–70. doi:10.1016/j.envpol.2014.01.021.
- Bi, C., J. P. Maestre, H. Li, G. Zhang, R. Givehchi, A. Mahdavi, K. A. Kinney, J. Siegel, S. D. Horner, and Y. Xu. 2018. Phthalates and organophosphates in settled dust and HVAC filter dust of US low-income homes: Association with season, building characteristics, and childhood asthma. Environ. Int. 121 (Pt 1):916–930. doi:10.1016/j.envint.2018.09.013.
- Boor, B. E., J. A. Siegel, and A. Novoselac. 2013. Monolayer and multilayer particle deposits on hard surfaces: Literature review and implications for particle resuspension in the indoor environment. Aerosol Sci. Technol. 47 (8):831–847. doi:10.1080/02786826.2013.794928.
- Cao, Z.-G., G. Yu, Y.-S. Chen, Q.-M. Cao, H. Fiedler, S.-B. Deng, J. Huang, and B. Wang. 2012. Particle size: A missing factor in risk assessment of human exposure to toxic chemicals in settled indoor dust. Environ. Int. 49:24–30. doi:10.1016/j.envint.2012.08.010.
- Chou, H.-M., C.-C. Kao, K. P. Chuang, C. Lin, C.-G. Shy, R.-F. Chen, C.-C. Tsai, C.-Y. Chuang, Y.-C. Cheng, C.-C. Chen, et al. 2016. Levels of polybrominated diphenyl ethers in air-conditioner filter dust used to assess health risks in clinic and electronic plant employees. Aerosol Air Qual. Res. 16 (1):184–194. doi:10.4209/aaqr.2015.09.0541.
- DellaValle, C. T., D. C. Wheeler, N. C. Deziel, A. J. De Roos, J. R. Cerhan, W. Cozen, R. K. Severson, A. R. Flory, S. J. Locke, J. S. Colt, et al. 2013. Environmental determinants of polychlorinated biphenyl concentrations in residential carpet dust. Environ. Sci. Technol. 47 (18):10405–10414. doi:10.1021/es401447w.
- Farnsworth, J. E., S. M. Goyal, S. W. Kim, T. H. Kuehn, P. C. Raynor, M. A. Ramakrishnan, S. Anantharaman, and W. Tang. 2006. Development of a method for bacteria and virus recovery from heating, ventilation, and air conditioning (HVAC) filters. J. Environ. Monit. 8 (10):1006–1013. doi:10.1039/b606132j.
- Givehchi, R., J. P. Maestre, C. Bi, D. Wylie, Y. Xu, K. A. Kinney, and J. A. Siegel. 2019. Quantitative filter forensics with residential HVAC filters to assess indoor concentrations. Indoor Air. 29 (3):390–402. doi:10.1111/ina.12536.
- Haaland, D., and J. A. Siegel. 2017. Quantitative filter forensics for indoor particle sampling. Indoor Air. 27 (2):364–376. doi:10.1111/ina.12319.
- Kang, Y., K. C. Cheung, and M. H. Wong. 2010. Polycyclic aromatic hydrocarbons (PAHs) in different indoor dusts and their potential cytotoxicity based on two human cell lines. Environ. Int. 36 (6):542–547. doi:10.1016/j.envint.2010.04.006.
- Kang, Y., Y. B. Man, K. C. Cheung, and M. H. Wong. 2012. Risk assessment of human exposure to bioaccessible phthalate esters via indoor dust around the pearl river delta. Environ. Sci. Technol. 46 (15):8422–8430. doi:10.1021/es300379v.
- Kang, Y., Y. Yin, Y. Man, L. Li, Q. Zhang, L. Zeng, J. Luo, and M. H. Wong. 2013. Bioaccessibility of polychlorinated biphenyls in workplace dust and its implication for risk assessment. Chemosphere 93 (6):924–930. doi:10.1016/j.chemosphere.2013.05.057.
- Krol, S., J. Namiesnik, and B. Zabiegala. 2014. Occurrence and levels of polybrominated diphenyl ethers (PBDEs) in house dust and hair samples from Northern Poland; an assessment of human exposure. Chemosphere 110:91–96. doi:10.1016/j.chemosphere.2014.02.014..
- Kurt-Karakus, P. B. 2012. Determination of heavy metals in indoor dust from Istanbul, Turkey: Estimation of the health risk. Environ. Int. 50:47–55. doi:10.1016/j.envint.2012.09.011.
- Lewis, R. G., C. R. Fortune, R. D. Willis, D. E. Camann, and J. T. Antley. 1999. Distribution of pesticides and polycyclic aromatic hydrocarbons in house dust as a function of particle size. Environ. Health Perspect. 107 (9):721–726. doi:10.1289/ehp.99107721.
- Li, K., and S. Fu. 2013. Polybrominated diphenyl ethers (PBDEs) in house dust in Beijing, China. Bull. Environ. Contam. Toxicol. 91 (4):382–385. doi:10.1007/s00128-013-1086-4.
- Li, T., M. Alavy, Y. Zhang, and J. A. Siegel. 2019. IAQ and energy implications of high efficiency filters in residential buildings. ASHRAE Research Project 1649-RP.
- Maertens, R. M., X. Yang, J. Zhu, R. W. Gagne, G. R. Douglas, and P. A. White. 2008. Mutagenic and carcinogenic hazards of settled house dust I: Polycyclic aromatic hydrocarbon content and excess lifetime cancer risk from preschool exposure. Environ. Sci. Technol. 42 (5):1747–1753. doi:10.1021/es702449c.
- Maestre, J. P., W. Jennings, D. Wylie, S. D. Horner, J. Siegel, and K. A. Kinney. 2018. Filter forensics: Microbiota recovery from residential HVAC filters. Microbiome 6 (1):22. doi:10.1186/s40168-018-0407-6.
- Mahdavi, A., and J. A. Siegel. 2018. Extraction of dust collected in HVAC filters. Proceedings of the 15th International Conference on Indoor Air and Climate, Philadelphia, PA, USA. Paper 800, July 22–27.
- Ni, H.-G., S.-P. Cao, W.-J. Chang, and H. Zeng. 2011. Incidence of polybrominated diphenyl ethers in central air conditioner filter dust from a new office building. Environ. Pollut. 159 (7):1957–1962. doi:10.1016/j.envpol.2010.12.007.
- Noris, F., J. A. Siegel, and K. A. Kinney. 2009. Biological and metal contaminants in HVAC filter dust. ASHRAE Trans. 115:484–491.
- Rasmussen, P. E., C. Levesque, M. Chenier, H. D. Gardner, H. Jones-Otazo, and S. Petrovic. 2013. Canadian house dust study: Population-based concentrations, loads and loading rates of arsenic, cadmium, chromium, copper, nickel, lead, and zinc inside urban homes. Sci. Total Environ. 443:520–529. doi:10.1016/j.scitotenv.2012.11.003.
- Rasmussen, P. E., C. Levesque, M. Chenier, and H. D. Gardner. 2018. Contribution of metals in resuspended dust to indoor and personal inhalation exposures: Relationships between PM10 and settled dust. Build. Environ. 143:513–522. doi:10.1016/j.buildenv.2018.07.044.
- Rodes, C. E., J. R. Newsome, R. W. Vanderpool, J. T. Antley, and R. G. Lewis. 2001. Experimental methodologies and preliminary transfer factor data for estimation of dermal exposures to particles. J. Expo. Anal. Environ. Epidemiol. 11 (2):123–139. doi:10.1038/sj.jea.7500150.
- Siddique, N., A. Majid, and M. Tufail. 2011. Elemental analysis of dust trapped in air conditioner filters for the assessment of Lahore city’s air quality. J. Radioanal. Nucl. Chem. 290 (3):691–699. doi:10.1007/s10967-011-1350-1.
- Stanley, N. J., T. H. Kuehn, S. W. Kim, P. C. Raynor, S. Anantharaman, M. A. Ramakrishnan, and S. M. Goyal. 2008. Background culturable bacteria aerosol in two large public buildings using HVAC filters as long term, passive, high-volume air samplers. J. Environ. Monit. 10 (4):474–481. doi:10.1039/b719316e.
- Stephens, B., and J. A. Siegel. 2013. Ultrafine particle removal by residential heating, ventilating, and air-conditioning filters. Indoor Air. 23 (6):488–497. doi:10.1111/ina.12045.
- Tan, J., S. M. Cheng, A. Loganath, Y. S. Chong, and J. P. Obbard. 2007a. Selected organochlorine pesticide and polychlorinated biphenyl residues in house dust in Singapore. Chemosphere 68 (9):1675–1682. doi:10.1016/j.chemosphere.2007.03.051.
- Tan, J., S. M. Cheng, A. Loganath, Y. S. Chong, and J. P. Obbard. 2007b. Polybrominated diphenyl ethers in house dust in Singapore. Chemosphere 66 (6):985–992. doi:10.1016/j.chemosphere.2006.07.052.
- Thatcher, T. L., and D. W. Layton. 1995. Deposition, resuspension, and penetration of particles within a residence. Atmos. Environ. 29 (13):1487–1497. doi:10.1016/1352-2310(95)00016-R.
- Whitehead, T., C. Metayer, R. B. Gunier, M. H. Ward, M. G. Nishioka, P. Buffler, and S. M. Rappaport. 2011. Determinants of polycyclic aromatic hydrocarbon levels in house dust. J. Expo. Sci. Environ. Epidemiol. 21 (2):123–132. doi:10.1038/jes.2009.68.
- Xu, Y., Y. Liang, J. R. Urquidi, and J. A. Siegel. 2015. Semi-volatile organic compounds in heating, ventilation, and air-conditioning filter dust in retail stores. Indoor Air. 25 (1):79–92. doi:10.1111/ina.12123.
- Yang, Q., H. Chen, and B. Li. 2015a. Source identification and health risk assessment of metals in indoor dust in the vicinity of phosphorus mining, Guizhou Province, China. Arch. Environ. Contam. Toxicol. 68 (1):20–30. doi:10.1007/s00244-014-0064-0.
- Yang, Z.-Z., Y.-F. Li, and J. Fan. 2015b. Polycyclic aromatic hydrocarbons in deposited bedroom dust collected from Xinxiang, a fast developing city in North China. Environ. Monit. Assess. 187 (1):4150. doi:10.1007/s10661-014-4150-6.