
 ?Mathematical formulae have been encoded as MathML and are displayed in this HTML version using MathJax in order to improve their display. Uncheck the box to turn MathJax off. This feature requires Javascript. Click on a formula to zoom.
Abstract
Mineral dust aerosol is present throughout the atmosphere, though the climate impact of this aerosol type is still not well known. One of many factors that contributes to this uncertainty is how water uptake alters the physical and optical character of the aerosol. A sensitive optical technique, cavity ring down spectroscopy, was used to quantify changes in the extinction cross-section with increasing relative humidity for montmorillonite, Na-rich montmorillonite, and illite aerosol. An iterative approach for converting the measured optical extinction enhancement to physical growth factor over increasing relative humidity was employed to quantify the effect of changing both size and refractive index. The method demonstrates an important application of previously retrieved effective refractive indices allowing for the determination of average particle size for the non-spherical particles from simple Mie theory calculations. The changed refractive index and particle size were used to show how these properties combine and interact to alter the distribution between scattering and absorption for the aerosol. The water uptake shifted the calculated single scattering albedo of the aerosol species more toward scattering when both optical and size changes were accounted for, as opposed to just size; limitations on these calculations are discussed. These findings demonstrate the necessity of understanding the effect of optical properties and size together, especially as many climate models do not account for water uptake properties of clay aerosol.
Copyright © 2020 American Association for Aerosol Research
Keywords:
Introduction
Mineral dust aerosol is abundantly available throughout the atmosphere, even though it is most commonly emitted from localized desert regions, due to its high emission rates and long distance transport (Alizadeh-Choobari, Sturman, and Zawar-Reza Citation2014). This type of aerosol is generated through the wind erosion of soils, making the initial mineralogical composition similar to that of the soil at its source (Goudie and Middleton Citation2001). Consequently, the relative abundance of certain minerals within the aerosol is often used to trace the source region as well as transport pathways (Schuster et al. Citation2012, Journet, Balkanski, and Harrison Citation2014, Wang et al. Citation2017). Examples of common mineral dust components include calcite, chlorite, corundum, dolomite, feldspar, gypsum, halite, hematite, illite, kaolinite, magnesite, montmorillonite, mica, opal, palygorskite, and quartz (Usher, Michel, and Grassian Citation2003). Among these quartz, feldspar, and carbonates make up most of the coarse mode particles, while smaller accumulation mode particles are dominated by clays and micas (Usher, Michel, and Grassian Citation2003). The size dependent composition and atmospheric persistence result in mineral dust aerosol becoming enriched in clays and micas during transport in the atmosphere, thereby making the impact of these species more far-reaching (Usher, Michel, and Grassian Citation2003). Further, it has been estimated that illite and montmorillonite clays have the highest and third highest atmospheric loadings, about 4.2 and 2.8 Tg/year respectively, of the various mineral dust components (Scanza et al. Citation2015, Tang, Cziczo, and Grassian Citation2016).
The long-range transport of atmospheric mineral dust means that the aerosol can encounter a variety of environmental conditions. In general, the interaction of an aerosol with sunlight dictates the direct climate effects of that aerosol, and the environment it encounters adds a layer of complexity and can alter those interactions (IPCC Citation2013, Tang, Cziczo, and Grassian Citation2016). How the aerosol interacts with a specific wavelength of light can be described by the complex refractive index (RI) that is typically defined as n + ki, where n represents how fast light travels through a sample, while a k greater than zero indicates light is absorbed by the sample. An aerosol that predominantly scatters light will have a cooling effect, while an aerosol with a larger fraction of absorption relative to its overall extinction will warm (IPCC 2013). Many aerosol species, including certain clay components of mineral dust, are known to take up water when passing through an increased relative humidity (RH) environment (Tang, Cziczo, and Grassian Citation2016). This water uptake can alter how the aerosol interacts with incoming radiation by changing the size, RI, shape, phase, and structure of the particles. The combination of mineral dust aerosol having a larger fraction of accumulation mode clays over their atmospheric residence time and the likelihood that these particles will experience greater RH upon leaving the source region, make the study of the changing optical properties of these accumulation mode clays particularly important.
The extent to which an aerosol takes up water at increasing RH can be measured in terms of mass increase, physical particle growth, or optical extinction (or scattering) enhancement. Mass increase measurements are typically conducted on aerosol after deposition onto a substrate or of thin films of the material, which may not replicate atmospheric processes as the material and humidity will interact with the underlying surface (Tang, Cziczo, and Grassian Citation2016). Although, some of these measurements have also been made on single particles levitated in an electrodynamic balance (Lee, Ling, and Chan Citation2008). Conversely, both the physical growth and extinction enhancement can be measured for a collection of aerosol particles. The extinction enhancement (or the ratio of the humidified to the dry aerosol extinction cross-sections) generally increases with decreasing particle size, while the physical growth is not dependent on particle size (Tang Citation1996, Garland et al. Citation2007). However, physical growth measurements with tandem differential mobility analyzers are generally not sensitive enough to measure the small diameter increases common for clay aerosol (Tang, Cziczo, and Grassian Citation2016). Measuring extinction enhancement allows for the use of techniques that are more sensitive to small changes in the aerosol, though it is further complicated by a changing RI, (Tang, Cziczo, and Grassian Citation2016, Flores et al. Citation2012) which shifts closer to that of water as the humidity and particle size increase. The changing n and k values together can either boost or dampen the observed extinction enhancement and can alter the ratio between scattering and absorption, thereby changing the climate effects of the aerosol.
Cavity ring-down spectroscopy (CRDS) is a tool often employed to study the optical properties of gases and aerosol (Atkinson Citation2003, Attwood and Greenslade Citation2011, Attwood and Greenslade Citation2012, Baynard et al. Citation2007, Freedman et al. Citation2009, Lang-Yona et al. Citation2010, Sappey et al. Citation1998, Morang, Galpin, and Greenslade Citation2018, Garland et al. Citation2007). CRDS provides data in terms of ring-down time (τ), which is a measure of the characteristic 1/e folding time for the exponential decay of light intensity from a high finesse optical cavity. When the ring-down time is known with and without aerosol present, the light extinction of the aerosol sample can be determined. Additionally, a set-up with two sample cells, as was used here, allows tandem extinction measurements of a sample, before and after encountering an environmental change, to be made (Garland et al. Citation2007, Attwood and Greenslade Citation2011). Measuring extinction for the same aerosol sample before and after an environmental change allows for a direct comparison and the quantification of the optical effect caused by that environmental factor.
This work details an iterative approach to converting extinction enhancement to physical particle growth measured over increasing RH for montmorillonite, Na-rich montmorillonite, and illite. This method uses sensitive optical techniques with previously retrieved optical constants for the clays that incorporate particle non-sphericity, as these effective refractive index values were retrieved by fitting a spherical model to measured optical data. Additionally, we are accounting for changes in the previously retrieved effective RI that occur as more water mixes into the clay particles and alters the observed enhancement. The single scattering albedo changes induced by the water uptake and changing RI and limitations for these are also investigated.
Experimental
Extinction enhancement
Montmorillonite (STx-1b), Na-rich montmorillonite (SWy-2), and illite (IMt-1) were obtained from the Source Clays Repository. Both montmorillonites arrived in powdered form and were used as received, while the larger pieces of illite were ground to a powder with a ceramic mortar and pestle before the aerosol could be generated. The powder clay samples each appear different visually as seen in Figure S1. The optical and physical properties of these clays have been studied previously and their chemical compositions are known (Grim Citation1962, Cases et al. Citation1992, Hudson et al. Citation2008, Veghte and Freedman Citation2014, Morang, Galpin, and Greenslade Citation2018).
The full experimental scheme for the measurement of extinction enhancement from water uptake can be seen in . Beginning on the left of the figure, aerosol is dry-generated from a side-arm flask attached to a wrist action shaker (Burrell model 75) as previously described by Morang, Galpin, and Greenslade (Citation2018). The polydisperse aerosol is directed to the bottom of an upright 15 L glass cylinder followed by a cascade impactor (PIXE stages 3 and 2), both of which help remove large (>1000 nm) particles that can clog the size-selection system. The aerosol then passes through the differential mobility analyzer (DMA, TSI 3081) where a single mobility diameter (Dmobility) was selected for optical interrogation. The DMA manufacturer suggested 10:1 sheath to sample flow rates were utilized for all samples.
Figure 1. Experimental scheme for measurement of extinction enhancement with water uptake where the aerosol flow path is indicated by arrowed black lines.
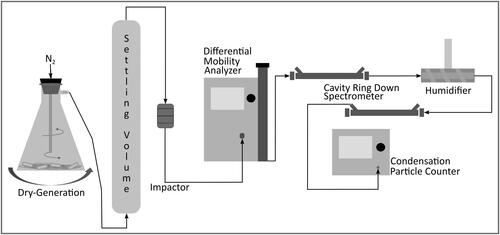
Optical measurements were made with a custom built CRDS that consists of two sample cells operating at a wavelength of 532 nm, which allows for a direct comparison of the same aerosol before and after humidification. The optical layout and other specific details of the instrument design and function have been described previously (Attwood and Greenslade Citation2011). The DMA size-selected aerosol was passed through the dry CRDS sample cell (RH < 5%), a permeable membrane humidifier, the wet CRDS sample cell (RH > 15%), and finally into a condensation particle counter (CPC, TSI 3775) for particle concentration quantification. The CRDS and CPC measurements were used to calculate the extinction cross-section (σext) of both the dry and wet aerosol as:
(1)
(1)
where RL is the ratio of the mirror-to-mirror separation distance to the sample length within the sample cell, c is the speed of light, Nc is the aerosol number concentration within the sample cell, and τ and τ0 are the ring-down times with and without sample present. Nc is corrected from the CPC measured number concentration for the small purge dilution, which is less than 2% of the total flow, at each end of the CRDS sample cell. This small dilution is necessary to keep the mirrors clean and maintain reflectivity throughout an experiment. The output τ data was averaged over 50 values, which equates to about 70 to 80 s, for each calculated σext and the RH measured in the center of the sample cells was averaged over the corresponding time frame. The τ0 for the system used here is approximately 110.0 ± 0.8 μs.
The wet and dry extinction cross-sections were then used to determine the relative humidity dependent extinction enhancement factors (fRHext) as:
(2)
(2)
where σext,dry and σext,wet are the extinction cross-sections of the aerosol before and after humidification, respectively. The fRHext was measured at three different mobility diameters for each of the clay samples: 200, 425, and 600 nm for montmorillonite; 200, 350, and 425 nm for Na-rich montmorillonite; and 200, 300, and 425 nm for illite. It is important to note that these samples are not spherical and there are a relatively large portion of multiply charged particles in the size-selected aerosol flow. As such, the dry mobility diameters are converted to ensemble-mean optical particle diameters using effective refractive indices previously retrieved for each clay (Morang, Galpin, and Greenslade Citation2018). This approach is further described and discussed below. The humidity was continuously ramped from approximately 20% to 90% over thirty minutes for each trial; trials were done in triplicate for each size and clay studied, and experimentally determined fRHext were averaged across the three trials.
The measured fRHext curves were then fitted by a two-parameter model that, in a review by Titos et al. (Citation2016), was determined to provide good fits for non-deliquescent aerosol:
(3)
(3)
where a and b are the fit parameters, determined through a chi-squared minimization.
Converting to physical growth factor
The magnitude of fRHext is dependent on the initial particle size, while the physical growth factor (GF) is not. Further, the complexity of light-particle interactions makes converting between fRHext and GF difficult, especially as the RI of the material will change as more water condenses on and/or mixes with the clay. This leads to the need for an iterative approach to calculating GF from extinction enhancement. To start the process, the modeled fRHext values from the curve fits were multiplied by the measured σext,dry, to calculate theoretical σext,wet at 5% RH intervals between 20% and 90%. The dry and wet σext were then compared with Mie theory predictions, using the effective refractive index of the pure clay (RIc) retrieved with extinction-only by Morang, Galpin, and Greenslade (Citation2018) (1.55(3)+0.15(6)i for montmorillonite, 1.60(2)+0.00(4)i for Na-rich montmorillonite, and 1.27(4)+0.31(7)i for illite), to determine the optical particle diameters (Dopt). The effective refractive index values used here (RIc) account for the non-sphericity of the dry aerosols, as they were determined by fitting Mie theory to the measured optical extinction as a function of size for each of the clays (Morang, Galpin, and Greenslade Citation2018). A modeling study by Zarzana, Cappa, and Tolbert (Citation2014) indicated that the addition of absorption measurements can improve retrievals when fitting Mie theory to experimental data. Further, work by Saleh et al. (Citation2016) using numerical experiments to calculate the errors in radiative transfer model using Mie theory for determination of direct radiative effect (DRE) of organic aerosol (OA) yielded significant errors when a complex morphology retrieval was used to obtain OA absorptivity while the errors in DRE largely canceled out when Mie theory was consistently applied across all calculations. Thus, the effective RIc retrieved with Mie theory and a spherical assumption is used in these conversions and the Mie theory based calculations of single scattering albedo as described below.
It is useful to note that the effective RI values used here are not equivalent to the bulk or intrinsic optical constants reported for the clays; in general, the effective RI values have larger k values and variable n value compared to those reported in the literature (Egan and Hilgeman Citation1979, Arakawa et al. Citation1997, Morang, Galpin, and Greenslade Citation2018, Utry et al. Citation2017, Friedrich, Steudel, and Weidler Citation2008, Schuster et al. Citation2012). In specific, the effective k value retrieved previously in Morang, Galpin, and Greenslade (Citation2018) for illite (origin: Montana, U.S.A.) of 0.31(7) at 532 nm is ∼370 times the value reported by Egan and Hilgeman (Citation1979) for illite (origin: Illinois, U.S.A) of 0.00083 at 533 nm and ∼420 times the value reported by Utry et al. (Citation2017) for illite (origin: Hungary) of 0.00074 at 532 nm. A different method was used to obtain each of these k values; Morang, Galpin, and Greenslade (Citation2018) used aerosol extinction of controlled particle sizes with number concentration measurements coupled with a Mie theory based retrieval to determine n (the real portion of the refractive index) and k, while Egan and Hilgeman (Citation1979) made a compressed pellet of the illite mixed with potassium bromide (KBr) to measure the diffuse transmission and reflectance with modified Kubelka-Munk scattering theory to determine k, and Utry et al. (Citation2017) measured scattering and absorption for well characterized aerosol sample and completed a retrieval to determine k while holding n constant at the Egan and Hilgeman (Citation1979) value.
Variability in clay composition due to its natural production may contribute to the variability in refractive index reported in the literature. In many studies, iron oxide minerals have been shown to be strong absorbers of solar radiation (e.g., Zhang et al. Citation2015 and references therein). Schuster et al. (Citation2012) noted significant variability in the literature for n values of illite from 1.41 reported by Egan and Hilgeman (Citation1979) to 1.59 reported for a natural sample by Friedrich, Steudel, and Weidler (Citation2008). Variability of the iron content of illite investigated in 2008 by Friedrich, Steudel and Weidler yielded significant changes in the n value for illite from 1.587 to 1.502 as the weight percent (wt. %) of Fe2O3 was decreased from 7.9 to 1.7, but the impact on k values was not studied. It is useful to note that the chemical composition of illite in this study and Morang, Galpin, and Greenslade (Citation2018) includes 7.32 wt. % of Fe2O3 and 0.55 wt. % of FeO, while that of Utry et al. (Citation2017) reported 1.2 wt. % of FeO3 in their sample (Van Olphen and Fripiat 1979, Utry et al. Citation2015). As a result of the uncertainty in the literature for the RIc, especially for illite, we base our discussion, especially of single scattering albedo on our previous result, but a range of k values are examined.
The method converting experimentally observed optical growth (fRHext) to physical GF uses a spherical assuming model to represent these aerosols and by changing the input RI from bulk values to previously obtained effective values, the optical extinction can be replicated so that the size based on the optical extinction, Dopt, can be determined. Dopt accounts for the presence of multiply charged particles within the size-selected aerosol sample where the mobility diameter does not, though both cases assume that the particles are spherical. The theoretically calculated optical particle diameters were then used to calculate the physical growth factor as:
(4)
(4)
where Dopt,dry and Dopt,wet are the Mie theory determined diameters for the aerosol before and after humidification, respectively.
Further, the calculated optical diameters were used to determine, with a simple geometry assumption, the volume fraction of water (Vf,w) for the grown particle at each studied RH as:
(5)
(5)
The water volume fraction was then used to determine the clay volume fraction (Vf,c) as the sum of the two values is equal to one when considering this as a simple two component system. Once Vf,w and Vf,c were known for the grown particles, a volume weighted refractive index was determined as (Ouimette and Flagan Citation1982, Erlick, Abbatt, and Rudich Citation2011):
(6)
(6)
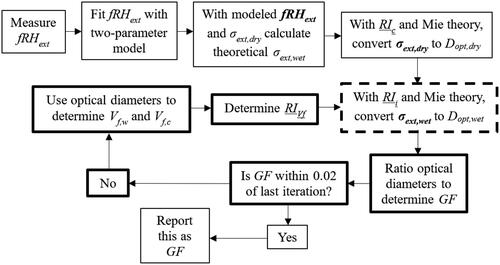
where RIw is the refractive index of water (1.33 + 0i) (Gifford Citation1906). The volume weighted mixing rule was chosen as it provides a simple method for determining the changed refractive index and has been shown to provide a good match to retrieved values for non-absorbing and slightly absorbing aerosol component mixtures (Abo Riziq et al. Citation2007). Other literature reports have indicated that molar refraction-mixing rule and Lorentz–Lorenz mixing rule have a physically meaningful basis and yield better results, however due to the lack of knowledge about the density of the particles, applying these alternates is beyond the scope of this work (Liu and Daum Citation2008, Cai et al. Citation2016). In addition, the fact that these clay particles take up water in the interlayer spacing as well as on the surface means that inhomogeneous mixing may contribute to additional uncertainty in our method (Cases et al. Citation1992). The new RIVf was implemented in Mie theory calculations to determine a new Dopt,wet and GF, restarting the process, as shown in . This was done for three total iterations, which provided final GF that did not change by more than 0.02 from the previous iteration at any RH for any sample.
Figure 2. Flow chart for iterative method used to convert measured fRHext to GF. The process is initialized in the top row of boxes, while the iterative process appears in the loop of bolded boxes within the flow chart. The iterative process is initialized in the dashed bolded box in the right middle where RIi is RIc for the first iteration only and RIVf calculated in the previous iteration for all others. The RI cases are underlined for emphasis.
Ultimately, three total GFs were calculated from fRHext model fits following this iterative method at 5% RH intervals, from 20% to 90%, for each of the particle sizes and clay types studied. The final values obtained, at each RH, were then averaged across the three sizes for each clay type to determine the final GF. The changes that occur to the effective RI, subsequently calculated RI, and GF with each iteration were also assessed.
Results and discussion
The extinction enhancement of montmorillonite, Na-rich montmorillonite, and illite aerosol as a function of RH was measured at three Dmobility with a two-sample cell CRDS method. The experimentally measured data were fit by a two-parameter model and then converted to physical water uptake represented as the GF through the described iterative process. Measured and modeled fRHext as a function of RH for each Dmobility are shown in , c, and e and the GF calculated from the final iteration and averaged across the three studied sizes as a function of RH are given in , d, and f. Error bars on measured fRHext points represent the standard deviation of the averaged experimentally measured values over three trials. Gray shaded error on fRHext model fits is propagated from the uncertainty on a and b as determined by the fit, and on GF is the standard deviation of the values averaged across the particle diameters. It is important to note that since RIc for Na-rich montmorillonite is not as representative of the largest sized particles (Morang, Galpin, and Greenslade Citation2018), the determined GF may be an underestimate of as much as 26% for this sample, while the montmorillonite and illite GF error encompasses the ∼10% uncertainty that is expected. The dependence of fRHext on particle size has been well documented previously (Garland et al. Citation2007, Tang Citation1996, Flores et al. Citation2012) and as expected, an increase in extinction enhancement with decreasing particle size was observed for each clay type.
Figure 3. Extinction enhancement (left) and physical growth factor (right) with water uptake as a function of RH for the studied clays, where (a) and (b) show montmorillonite, (c) and (d) show Na-rich montmorillonite, and (e) and (f) show illite. On the left side, points represent experimentally measured fRHext data with distinct shapes representing mobility diameters as noted in the legend, and dashed, dotted or solid lines as noted in the legend with gray shading represent the corresponding two-parameter model fits with propagated uncertainty. On the right side, solid black lines with gray shading represent the final iteration averaged GF and standard deviation.
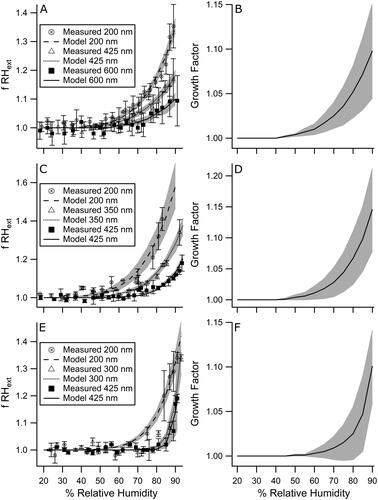
The GF calculated in this work at 80% RH are 1.05(3), 1.07(4), and 1.03(3) for montmorillonite, Na-rich montmorillonite, and illite, respectively. These values fall within the range of previously measured values determined with a variety of different methods. In a study by Hatch et al. (Citation2012), a Fourier-transform infrared spectrometer was used to determine the mass of water absorbed as a function of humidity, by the same Na-rich montmorillonite and illite clays studied here. For the sake of comparison, the measured values at 80% RH have been converted, with simple geometry and densities, to GF and are 1.17(1) and 1.14(4), respectively (Hatch et al. Citation2012). These values are both higher than those determined by the current work, though this would be expected as the calculation used to convert mass change to GF assumes all of the added water is on the outside of the particles, while it is likely that some of the initially absorbed water will fill between the structural layers of the clay and not induce a change in overall particle size (Cases et al. Citation1992). If the mass of water corresponding to the first adsorbed monolayer (at ∼20% RH) is subtracted from that at 80% RH, then the GF become 1.14 and 1.10 for Na-rich montmorillonite and illite (Hatch et al. Citation2012), though it is important to note that the current work does not see GF > 1.00 before 40% RH. Additionally, the measurements done by Hatch et al. (Citation2012) were of clay thin-films, created from water suspensions, and the processing could have altered the water uptake properties as compared to the dry-generated aerosol (Tang, Cziczo, and Grassian Citation2016, Galpin Citation2018). In a study by Herich et al. (Citation2009), a tandem-DMA method was used to directly determine the GF of dry-generated aerosol of montmorillonite, Na-rich montmorillonite, and illite. In this case the illite and montmorillonite were acquired from different source locations and Na-rich montmorillonite was obtained from the same supplier as the current work, though whether it is of the same source location is unknown (Herich et al. Citation2009). The GF, calculated from hygroscopicity parameters reported in Figure 4 of the referenced work, at 80% RH were 1.02(1), 1.008(5), and 1.006(6) for montmorillonite, Na-rich montmorillonite, and illite, respectively (Herich et al. Citation2009). Montmorillonite and illite are both within the error of the GF determined in the current work, while the Na-rich montmorillonite is not. This could be a result of differences in the chemical make-up of the Na-rich montmorillonites for the two studies. This is especially likely as bulk studies of montmorillonites have shown Na-rich samples to have increased swelling with water absorption from the other montmorillonites studied (Grim Citation1962), which was also observed in the current work. Alternatively, differences between the geometric growth factors calculated here and that previously determined by others could be attributed to assumptions in our calculations including the fact that the RIc were retrieved with a spherical assumption and that the effect of distinct multiply charged particles on the growth factor are not explicitly calculated.
Measured extinction enhancement with water uptake was fit by the two-parameter model described in EquationEquation (3)(3)
(3) with the custom fit function in Igor Pro. This determined a, b, and their uncertainties with a chi-squared minimization method. How well fit the models are to their respective measured values was assessed by calculating the goodness-of-fit described as:
(7)
(7)
where fRHext,meas and fRHext,model are the measured and modeled extinction enhancement at specific RH, respectively, ΔfRHext,meas is the error on the measured extinction enhancement, and N is the number of points used in the fitting. The fit parameters, goodness-of-fit values, and the corresponding Dmobility and Dopt,dry are given in for all samples. All of the fRHext models provide good fits to measured data with χ2/N2 less than one, as would be expected considering none of the clays undergoes deliquescence (Titos et al. Citation2016), and it can be seen that 600 nm Dmobility montmorillonite is the best fit, while 200 nm Na-rich montmorillonite is the worst. Additionally, the Dopt,dry determined here were compared to effective diameters determined by Morang, Galpin, and Greenslade (Citation2018) through tandem-DMA analysis where possible (all except the largest montmorillonite). All of the comparable cases are within 5 nm for the same Dmobility and clay, except Na-rich montmorillonite where Dmobility = 200 and 350 nm have 17 and 9 nm differences, though these are still well within the 10% uncertainty reported on the effective diameters (Morang, Galpin, and Greenslade Citation2018).
Table 1. Mobility and corresponding dry optical diameters, along with extinction enhancement fit parameters and their goodness-of-fit for montmorillonite, Na-rich montmorillonite, and illite.
It is important to use an iterative approach when calculating GF from fRHext measurements as the uptake of water will alter the RI of the aerosol, in addition to the size of the particles, both of which will affect the observed optical signature. shows how for each clay both the n and k of the effective and subsequently calculated RI and the GF at the selected RH and averaged across the studied sizes, changed over successive iterations; the first entry in each case is the RI equivalent to that of the pure clay represented by the effective RI retrieved in previous work (Morang, Galpin, and Greenslade Citation2018). The error on RI and GF represent the standard deviation of the averaged values for the sizes considered. Values to three decimals places for n and k were used when determining GF in order to fully capture the changes occurring and these are largely consistent with the standard deviations. The largest changes in n, k and GF with each iteration are seen at the highest RH, as this is the case where the most water has been added to the particles.
Table 2. Iterative changes in RI and resulting GF at selected relative humidity for montmorillonite, Na-rich montmorillonite, and illite. Sequential iterations are given in columns, left to right, under each variable heading. Uncertainties calculated from the standard deviation of averaging over sizes are given in parenthesis.
Three distinctly different RIc cases were studied here: montmorillonite had both n and k values that were mid-range of those studied, but larger than that of water; Na-rich montmorillonite had the largest n which is likewise greater than water, but its k was the smallest and the same as that of water; and illite had the only n that was smaller than water, but also the largest k. The RIc values used in this work are effective refractive index values previously retrieved using a spherical morphology assumption (Morang, Galpin, and Greenslade Citation2018). Most of the iterative changes seen here are not statistically significant when averaged over the three studied sizes, and this is due to the relatively small amount of water uptake that occurs with clay aerosol (ammonium sulfate and malonic acid have GF = 1.54 and 1.32 at 85% RH, respectively) (Wise et al. Citation2003). Despite this and regardless of the clay studied, or the direction of the RI shift to become more water-like, there is a clear trend present that, if the GF was large enough to change, it increased over each iteration. It is possible that this trend would not hold if other particle sizes for this case or other substances with different RI are studied, as the size dependent shape of the Mie theory extinction curve changes with RI. Additionally, very small first iteration GF (those ≤1.01 in the first GF column) were not impacted by the repetitive process, so it is unnecessary to use the iterative method if the measured fRHext is similarly small (≤1.02) as seen in , c, and e.
Changes in the RI of the clay aerosol as a result of water uptake can alter the relative amount of incoming radiation that is scattered or absorbed, and therefore how the aerosol affects the local climate. To assess how the water uptake might change the distribution between scattering and absorption, the theoretical single scattering albedo (SSA) was calculated for the studied clays at high RH (≥80% RH) for the 200 and 425 nm Dmobility as:
(8)
(8)
where σscat and σext are the Mie theory determined scattering and extinction cross-sections for a particle with Dopt,wet determined in the final iteration. Calculated SSA values, assuming RIc and RIVf, for grown montmorillonite and illite, are given in as well as the respective Dopt,wet. These values depend on the initial selection of the RIc, where previously retrieved effective refractive index values based on Mie theory fits to dry extinction measurements of the samples are used (Morang, Galpin, and Greenslade Citation2018).
Table 3. Comparison of single scattering albedo calculated for humidified particles using RIc and the final RIVf for montmorillonite and illite at high relative humidity for Dmobility of 200 nm (top, Dopt,dry = 369 nm for both) and 425 nm (bottom, Dopt,dry = 590 nm and 526 nm, respectively). The far right column is the same for illite using RIc with the previously retrieved n, but the lower limit of the retrieved k value (k = 0.24).
The imaginary portion of the refractive index has a significant effect on the calculated SSA; thus, it is useful to discuss that quantity further. In particular, the k of illite (0.31(7)) previously retrieved with a spherical assumption from experimentally measured unitless extinction efficiency as a function size parameter and used here for Mie theory based SSA calculations can be compared with other literature values. The k of the effective refractive index value for illite of 0.31(7) can be compared to that measured previously for the highly absorbing dye nigrosin, 0.31(5) (Lack et al. Citation2006). Yet, previously, we showed the experimentally measured extinction data from illite resembles that of rhodamine-590 and nigrosin, being indicative of a strongly absorbing species (Abo Riziq et al. Citation2007, Lack et al. Citation2006, Morang, Galpin, and Greenslade Citation2018). We further rationalized this observation of illite by noting our method is incorporating into the retrieved effective refractive index the non-sphericity and flaky, feathery, rough edges observed by Veghte and Freedman (Citation2014) with scanning electron microscopy, where other have indicated that these edges can induce multiple scattering events within the structure, which can in turn increase the possibility of a photon being absorbed (Legrand et al. Citation2014, Morang, Galpin, and Greenslade Citation2018, Pilorget et al. Citation2016, Veghte and Freedman Citation2014, Veghte et al. Citation2015, Veghte et al. Citation2016). In order to examine our iterative method further, we also performed Mie theory based SSA calculations using the lower end of k previously retrieved and the previously reported value for illite and the previously reported value for montmorillonite. If a k value of 0.24, or the lower end of the effective refractive index for illite is used, the SSA increases by as much as 0.03 as show in , but is still indicative of a significantly absorbing particle. If bulk, intrinsic or other literature reported refractive index values were utilized for montmorillonite or illite, the Mie theory based calculated SSA values would be equal to one due to the k values being close zero. It is also useful to compare to literature reported SSA values for illite in particular, which range from >0.95 at 550 nm calculated using Mie theory and various literature refractive index values as reported in Zhang et al. (Citation2015) to 0.99 at 525 nm experimentally determined using the total scattering coefficient measured with nephelometry and the optical absorption coefficient extrapolated from with Ångström exponents from photoacoustic spectrometry measurements at 355 and 532 nm as reported in Utry et al. (Citation2017). A much wider range of SSA values has been noted for mineral dust species. All SSA values for Na-rich montmorillonite were equal to one due to the lack of absorption at the studied wavelength for both the clay and water, though the observed decrease in n from RIc to RIVf would likely reduce the magnitude of the cooling effect of the grown aerosol (Erlick, Abbatt, and Rudich Citation2011).
For comparison, dry SSA values for the Dopt,dry equivalent of Dmobility = 200 and 425 nm are both 0.62 for montmorillonite and 0.32 and 0.39, respectively, for illite. When compared with the values in , it can be seen that using RIVf provides a larger shift from the dry particles than is predicted if only the diameter change is considered. There is an observable increase in calculated SSA for grown particles when RIVf is used compared to RIc for all the montmorillonite and half of the illite values, meaning there is a relative increase in the light scattering of the aerosol. Increased scattering will shift the climatic effect of that aerosol to be more cooling, or less warming. On the other hand, the SSAVf values calculated for illite at 80% RH for both Dmobility and 85% RH for the larger Dmobility, 425 nm, show little to no increase. This is due to the measured fRHext being close to one at these conditions, providing little change in RIVf from RIc. Given the relatively small growth of these clay aerosol compared to organic or inorganic species, it is surprising that the SSA values considered can vary by as much as 0.05 (or 5% on the 0-1 scale) simply as a result of the changes calculated for the RI. The changes to the SSA values discussed here originate from both the initial selection of the effective RI and the growth of the aerosol; when RI values are closer to water or growth is minimal, little change to the SSA values will be observed.
The iterative approach utilized here has shown the extent to which RI and therefore SSA can change for aerosol that have relatively small GF and fRHext. This type of approach is necessary for accurate GF to be determined from fRHext. Further, the climate relevant effects will be more significant when studying aerosol that take up large amounts of water or have RI further from that of water. An example of this would be nigrosine, a black dye that is sometimes used as a surrogate for absorbing aerosol in lab studies (Flores et al. Citation2012). Flores et al. (Citation2012) retrieved a RI of 1.626 + 0.243i via CRDS and a GF at 90% RH of 1.24 via tandem-DMA for this compound. These values would result in an aerosol with a dry diameter of 400 nm growing to 496 nm at 90% RH, and RIVf of 1.485 + 0.127i. The retrieved RI results in SSA of 0.55 for both the dry and wet diameters, while RIVf gives an SSA of 0.65 for the grown particle, which is an increase of 0.10 (double the largest increase seen in the current work).
Conclusions
This work has provided a look into how the optical properties change when montmorillonite, Na-rich montmorillonite, and illite aerosol take up water, and has examined in detail an iterative approach for converting extinction enhancement to growth factor over increasing relative humidity. The method detailed here demonstrates an important application of previously retrieved effective refractive indices that account for the non-sphericity of clay particles, as they allow for the determination of average particle size from simple Mie theory calculations. The iterative approach and availability of experimentally representative optical constants combined to integrate sensitive optical measurements and theoretical calculations, allowing consideration of changes in both particle size and RI that alter the observed extinction enhancement as a function of RH. Further, accounting for RI changes from the initial effective refractive index with the water uptake of these clay aerosol was shown to have shifted their calculated single scattering albedo toward scattering by up to 5% more than if only the diameter change is considered, even with the small GFs measured. The implied climate impacts showed increased scattering with particle growth, which was further enhanced when the changed optical properties were also considered. Though none of the SSA changes except using other literature values of the refractive index caused these samples to shift from predicted warming to cooling, they demonstrate the necessity of understanding the effect of optical properties and size together, especially as many climate models do not account for water uptake properties of clay aerosol.
Supplemental Material
Download MS Word (72.2 KB)Acknowledgments
Jillian L. Moran's thesis (2019) includes an earlier version of this article; she holds the copyright to her thesis and has granted permission for use here. The authors wish to thank Tyler R. Galpin for his assistance with experiments related to this work and with the optical measurements of water uptake. The authors would also like to thank the editor and reviewers for their helpful comments on this work.
Disclosure statement
The authors declare no competing financial interest.
References
- Abo Riziq, A., C. Erlick, E. Dinar, and Y. Rudich. 2007. Optical properties of absorbing and non-absorbing aerosols retrieved by cavity ring down (CRD) spectroscopy. Atmos. Chem. Phys. 7 (6):1523–36. doi:10.5194/acp-7-1523-2007.
- Alizadeh-Choobari, O., A. Sturman, and P. Zawar-Reza. 2014. A global satellite view of the seasonal distribution of mineral dust and its correlation with atmospheric circulation. Dyn. Atmos. Oceans 68:20–34. doi:10.1016/j.dynatmoce.2014.67.002.
- Arakawa, E. T., P. S. Tuminello, B. N. Khare, M. E. Millham, S. Authier, and J. Pierce. 1997. Measurement of optical properties of small particles. Scientific Conference on Obscuration and Aerosol Research at Oak Ridge National Laboratory, ORNL/CP-95872, 30 pp, https://digital.library.unt.edu/ark:/67531/metadc698142/m1/2/.
- Atkinson, D. B. 2003. Solving chemical problems of environmental importance using cavity ring-down spectroscopy. Analyst 128 (2):117–25. doi:10.1039/b206699h.
- Attwood, A. R., and M. E. Greenslade. 2011. Optical Properties and Associated Hygroscopicity of Clay Aerosols. Aerosol Sci. Technol. 45 (11):1350–9. doi:10.1080/02786826.2011.594462.
- Attwood, A. R., and M. E. Greenslade. 2012. Deliquescence Behavior of Internally Mixed Clay and Salt Aerosols by Optical Extinction Measurements. J. Phys. Chem. A 116 (18):4518–27. doi:10.1021/jp2124026.
- Baynard, T., E. R. Lovejoy, A. Pettersson, S. S. Brown, D. Lack, H. Osthoff, P. Massoli, S. Ciciora, W. P. Dube, and A. R. Ravishankara. 2007. Design and application of a pulsed cavity ring-down aerosol extinction spectrometer for field measurements. Aerosol Sci. Technol. 41 (4):447–62. doi:10.1080/02786820701222801.
- Cai, C.,. R. E. H. Miles, M. I. Cotterell, A. Marsh, G. Rovelli, A. M. J. Rickards, Y. H. Zhang, and J. P. Reid. 2016. Comparison of methods for predicting the compositional dependence of the density and refractive index of organic-aqueous aerosols. J. Phys. Chem. A 120 (33):6604–17. doi:10.1021/acs.jpca.6b05986.
- Cases, J. M., I. Berend, G. Besson, M. Francois, J. P. Uriot, F. Thomas, and J. E. Poirier. 1992. Mechanism of Adsorption and Desorption of Water-vapor by Homoionic Montmorillonite 1. The Sodium-Exchanged Form. Langmuir 8 (11):2730–9. doi:10.1021/la00047a025.
- Egan, W. G., and T. W. Hilgeman. 1979. Optical properties of inhomogenous materials: applications to geology, astronomy, chemistry, and engineering. New York: Academic Press.
- Erlick, C., J. P. D. Abbatt, and Y. Rudich. 2011. How Different Calculations of the Refractive Index Affect Estimates of the Radiative Forcing Efficiency of Ammonium Sulfate Aerosols. J. Atmos. Sci. 68 (9):1845–52. doi:10.1175/2011JAS3721.1.
- Freedman, M. A., C. A. Hasenkopf, M. R. Beaver, and M. A. Tolbert. 2009. Optical Properties of Internally Mixed Aerosol Particles Composed of Dicarboxylic Acids and Ammonium Sulfate. J Phys Chem A 113 (48):13584–92. doi:10.1021/jp906240y.
- Friedrich, F.,. A. Steudel, and P. G. Weidler. 2008. Change of the Refractive Index of Illite Particles by Reduction of the Fe Content of the Octahedral Sheet. Clays Clay Miner. 56 (5):505–10. doi:10.1346/CCMN.2008.0560503.
- Galpin, T. 2018. Optical Properties of Laboratory Generated Aerosol: Complex Refractive Index Retrieval for Polystyrene Spheres, and Extinction Enhancement of Montmorillonite by Water Swelling. Master of Science, Chemistry, University of New Hampshire.
- Garland, R. M., A. R. Ravishankara, E. R. Lovejoy, M. A. Tolbert, and T. Baynard. 2007. Parameterization for the relative humidity dependence of light extinction: Organic-ammonium sulfate aerosol. J. Geophys. Res. 112 (D19):D19303. doi:10.1029/2006JD008179.
- Gifford, J. W. 1906. The refractive indices of water and of sea-water. Proc. R Soc. London, Ser. A 78 (525):406–9. doi:10.1098/rspa.1906.0087.
- Goudie, A. S., and N. J. Middleton. 2001. Saharan dust storms: nature and consequences. Earth. Sci. Rev. 56 (1-4):179–204. doi:10.1016/S0012-8252(01)00067-8.
- Grim, R. E. 1962. Applied Clay Mineralogy. In International series in the earth sciences, ed. Robert R. Shrock. New York: McGraw-Hill Book Company, Inc.
- Hatch, C. D., J. S. Wiese, C. C. Crane, K. J. Harris, H. G. Kloss, and J. Baltrusaitis. 2012. Water Adsorption on Clay Minerals As a Function of Relative Humidity: Application of BET and Freundlich Adsorption Models. Langmuir 28 (3):1790–803. doi:10.1021/la2042873.
- Herich, H.,. T. Tritscher, A. Wiacek, M. Gysel, E. Weingartner, U. Lohmann, U. Baltensperger, and D. J. Cziczo. 2009. Water uptake of clay and desert dust aerosol particles at sub- and supersaturated water vapor conditions. Phys. Chem. Chem. Phys. 11 (36):7804–9. doi:10.1039/b901585j.
- Hudson, P. K., E. R. Gibson, M. A. Young, P. D. Kleiber, and V. H. Grassian. 2008. Coupled infrared extinction and size distribution measurements for several clay components of mineral dust aerosol. J. Geophys. Res 113 (D1):D01201. doi:10.1029/2007JD008791.
- IPCC. 2013. Climate Change 2013: The Physical Science Basis. Contribution of Working Group I to the Fifth Assessment Report of the Intergovernmental Panel on Climate Change. [Stocker, T. F., D. Qin, G.-K. Plattner, M. Tignor, S.K. Allen, J. Boschung, A. Nauels, Y. Xia, V. Bex and P.M. Midgley (eds.)], 1535. Cambridge: Cambridge University Press.
- Journet, E., Y. Balkanski, and S. P. Harrison. 2014. A new data set of soil mineralogy for dust-cycle modeling. Atmos. Chem. Phys. 14 (8):3801–16. doi:10.5194/acp-14-3801-2014.
- Lack, D.A., E.R. Lovejoy, T. Baynard, A. Pettersson, and A.R. Ravishankara. 2006. Aerosol Absorption Measurement using Photoacoustic Spectroscopy: Sensitivity, Calibration, and Uncertainty Developments. Aerosol Science and Technology. 40 (9):697–708. doi:10.1080/02786820600803917.
- Lang-Yona, N., A. Abo-Riziq, C. Erlick, E. Segre, M. Trainic, and Y. Rudich. 2010. Interaction of internally mixed aerosols with light. Phys. Chem. Chem. Phys. 12 (1):21–31. doi:10.1039/b913176k.
- Lee, A. K. Y., T. Y. Ling, and C. K. Chan. 2008. Understanding hygroscopic growth and phase transformation of aerosols using single particle Raman spectroscopy in an electrodynamic balance. Faraday Discuss. 137:245–63. doi:10.1039/b704580h.
- Legrand, M., O. Dubovik, T. Lapyonok, and Y. Derimian. 2014. Accounting for particle non-sphericity in modeling of mineral dust radiative properties in the thermal infrared. J. Quant. Spectrosc. Radiat. Transf. 149:219–40. doi:10.1016/j.jqsrt.2014.07.014.
- Liu, Y., and P. H. Daum. 2008. Relationship of refractive index to mass density and self-consistency of mixing rules for multicomponent mixtures like ambient aerosols. J. Aerosol Sci. 39 (11):974–86. doi:10.1016/j.jaerosci.2008.06.006.
- Flores, J. M., R. Z. Bar-Or, N. Bluvshtein, A. Abo-Riziq, A. Kostinski, S. Borrmann, I. Koren, I. Koren, and Y. Rudich. 2012. Absorbing aerosols at high relative humidity: linking hygroscopic growth to optical properties. Atmos. Chem. Phys. 12 (12):5511–21. doi:10.5194/acp-12-5511-2012.
- Morang, J. L., T. Galpin, and M. E. Greenslade. 2018. Effective Refractive Index Values and Single Scattering Albedo Implications for Dry-Generated Clays As Retrieved from Cavity Ring-Down Spectroscopy. Anal. Chem. 90 (19):11248–55. doi:10.1021/acs.analchem.8b01319.
- Ouimette, J. R., and R. C. Flagan. 1982. The Extinction Coefficient of Multicomponent Aerosols. Atmos. Environ. 16 (10):2405–19. doi:10.1016/0004-6981(82)90131-7.
- Pilorget, C., J. Fernando, B. L. Ehlmann, F. Schmidt, and T. Hiroi. 2016. Wavelength dependence of scattering properties in the VIS–NIR and links with grain-scale physical and compositional properties. Icarus 267:296–314. doi:10.1016/j.icarus.2015.12.029.
- Saleh, R., P. J. Adams, N. M. Donahue, and A. L. Robinson. 2016. The interplay between assumed morphology and the direct radiative effect of light-absorbing organic aerosol. Geophys. Res. Lett. 43 (16):8735–43. doi:10.1002/2016GL069786.
- Sappey, A. D., E. S. Hill, T. Settersten, and M. A. Linne. 1998. Fixed-frequency cavity ringdown diagnostic for atmospheric particulate matter. Opt. Lett. 23 (12):954–6. doi:10.1364/ol.23.000954.
- Scanza, R. A., N. Mahowald, S. Ghan, C. S. Zender, J. F. Kok, X. Liu, Y. Zhang, and S. Albani. 2015. Modeling dust as component minerals in the Community Atmosphere Model: development of framework and impact on radiative forcing. Atmos. Chem. Phys. 15 (1):537–61. doi:10.5194/acp-15-537-2015.
- Schuster, G. L., M. Vaughan, D. MacDonnell, W. Su, D. Winker, O. Dubovik, T. Lapyonok, and C. Trepte. 2012. Comparison of CALIPSO aerosol optical depth retrievals to AERONET measurements, and a climatology for the lidar ratio of dust. Atmos. Chem. Phys. 12 (16):7431–52. doi:10.5194/acp-12-7431-2012.
- Tang, I. N. 1996. Chemical and size effects of hygroscopic aerosols on light scattering coefficients. J. Geophys. Res. 101 (D14):19245–50. doi:10.1029/96JD03003.
- Tang, M. J., D. J. Cziczo, and V. H. Grassian. 2016. Interactions of Water with Mineral Dust Aerosol: Water Adsorption, Hygroscopicity, Cloud Condensation, and Ice Nucleation. Chem. Rev. 116 (7):4205–59. doi:10.1021/acs.chemrev.5b00529.
- Titos, G., A. Cazorla, P. Zieger, E. Andrews, H. Lyamani, M. J. Granados-Munoz, F. J. Olmo, and L. Alados-Arboledas. 2016. Effect of hygroscopic growth on the aerosol light-scattering coefficient: A review of measurements, techniques and error sources. Atmos. Environ. 141:494–507. doi:10.1016/j.atmosenv.2016.07.021.
- Usher, C. R., A. E. Michel, and V. H. Grassian. 2003. Reactions on Mineral Dust. Chem. Rev. 103 (12):4883–939. doi:10.1021/cr020657y.
- Utry, N., T. Ajtai, M. Pintér, E. Illés, E. Tombácz, G. Szabó, and Z. Bozóki. 2017. Generation and UV-VIS-NIR spectral responses of organo-mineral aerosol for modelling soil derived dust. Atmos. Environ. 152:553–61. doi:10.1016/j.atmosenv.2017.01.012.
- Utry, N., T. Ajtai, M. Pintér, E. Tombácz, E. Illés, Z. Bozóki, and G. Szabó. 2015. Mass-specific optical absorption coefficients and imaginary part of the complex refractive indices of mineral dust components measured by multi-wavelength photoacoustic spectrometer. Atmos. Meas. Tech. 8 (1):401–10. doi:10.5194/amt-8-401-2015.
- van Olphen, H., and J. J. Fripiat, eds. Data Handbook for Clay Materials and Other Non-Metallic Minerals; New York: Pergamon Press.
- Veghte, D. P., M. B. Altaf, J. D. Haines, and M. A. Freedman. 2016. Optical properties of non-absorbing mineral dustcomponents and mixtures. Aerosol Sci. Technol. 50 (11):1239–52. doi:10.1080/02786826.2016.1225153.
- Veghte, D. P., and M. A. Freedman. 2014. Facile Method for Determining the Aspect Ratios of Mineral Dust Aerosol by Electron Microscopy. Aerosol Sci. Technol. 48 (7):715–24. doi:10.1080/02786826.2014.920484.
- Veghte, D. P., J. E. Moore, L. Jensen, and M. A. Freedman. 2015. Influence of shape on the optical properties of hematite aerosol. J. Geophys. Res. Atmos. 120 (14):7025–39. doi:10.1002/2015JD023160.
- Wang, F., X. Q. Zhao, C. Gerlein-Safdi, Y. Mu, D. F. Wang, and Q. Lu. 2017. Global sources, emissions, transport and deposition of dust and sand and their effects on the climate and environment: a review. Front. Environ. Sci. Eng. 11 (1):13. doi:10.1007/s11783-017-0904-z.
- Wise, M. E., J. D. Surratt, D. B. Curtis, J. E. Shilling, and M. A. Tolbert. 2003. Hygroscopic growth of ammonium sulfate/dicarboxylic acids. J. Geophys. Res. 108 (D20):4638. doi:10.1029/2003JD003775.
- Zarzana, K. J., C. D. Cappa, and M. A. Tolbert. 2014. Sensitivity of Aerosol Refractive Index Retrievals Using Optical Spectroscopy. Aerosol Sci. Technol. 48 (11):1133–44. doi:10.1080/02786826.2014.963498.
- Zhang, X. L., G. J. Wu, C. L. Zhang, T. L. Xu, and Q. Q. Zhou. 2015. What is the real role of iron oxides in the optical properties of dust aerosols? Atmos. Chem. Phys. 15 (21):12159–77. doi:10.5194/acp-15-12159-2015.