
 ?Mathematical formulae have been encoded as MathML and are displayed in this HTML version using MathJax in order to improve their display. Uncheck the box to turn MathJax off. This feature requires Javascript. Click on a formula to zoom.
Abstract
Knowledge of respiratory bacterium/virus distribution on surfaces is critical for studying disease transmission via the contact route. Here, we investigated the bioaerosol deposition and distribution on a surface from a cough experimentally. A cough generator was used to release bacterium/virus-laden droplets. A solid surface was placed in front of the cough generator at different relative distances (D = 0.2, 0.5, 0.8, and 1.1 m) and angles (θ=30°, 60°, and 90°). Benign bacteria and bacteriophages were used separately. Results showed that droplet jet directly impinged upon the surface and then spread out along the surface. The distributions of droplet volume and viable microorganisms along the surface were unimodal. We then identified the impaction region based on the droplet flow field from a particle imaging velocimetry technique, which corresponded with the peak position and high-volume area. The impaction region contained around 83% of droplet volume along the vertical axis of the surface. The peak position, peak value, and width of the impaction region were related to D and θ. The micro-organisms inside the droplets did not affect the droplet distribution on near surfaces. The front surface can work as a partition to block the cough jet and protect people behind, and can be smaller when it is installed closer to the coughing person. This work demonstrates a methodology to obtain distribution and viability of microorganism deposited on surface, and suggest guidelines to setting up a protective partition as a possible intervention method against disease transmission.
Copyright © 2020 American Association for Aerosol Research
EDITOR:
1. Introduction
Every year, communicable respiratory diseases cause absence from work, lost worker productivity (Fisk Citation2000), 3–5 million severe illness cases and even 290,000 to 650,000 deaths by influenza (WHO Citation2018). There are four different exposure pathways in the communicable respiratory disease transmission process: (Atkinson and Wein Citation2008; Jones and Adida Citation2011; Lei et al. Citation2018; Nicas and Jones Citation2009) (1) direct/indirect contact transmission, (2) large droplet spray transmission, (3) inhalation of inspirable droplets, and (4) inhalation of respirable airborne transmission. Pathway (1) involves direct contact which indicates body-to-body contact with an infected person, or indirect contact, also denoted as fomites, in which a susceptible person contacts contaminated intermediate surfaces. Pathway (2) means large droplets directly spray onto facial membranes from a cough or sneeze. Pathway (3) corresponds with droplets of 10–100 µm in aerodynamic diameter, which deposit onto the upper respiratory tract. Pathway (4) is for the particles smaller than 10 µm in aerodynamic diameter, which deposit onto the upper/lower respiratory tract and pulmonary region. The relative contribution of each pathway depends on the types of pathogens (Lei et al. Citation2018), surrounding environment and infection sites in the airways (Jones and Adida Citation2011). Studies show that airborne transmission (i.e., pathway 3) is one important pathway for influenza and severe acute respiratory syndrome viruses (SARS) to spread (Cowling et al. Citation2013; Tellier Citation2006; Tellier Citation2009; Yu et al. Citation2004). However, the contact transmission is still an important route for the respiratory diseases (Lowen et al. Citation2008; Nicas and Jones Citation2009; Jones and Adida Citation2011).
Indirect contact disease transmission involves the following steps: deposition and survival of bacteria/viruses from respiratory activities; bacterium/virus transfer to hands and to facial membrane by contact; and infection. Field studies reveal that the viable influenza virus appears on surfaces in offices, households, day care centers (Boone and Gerba Citation2005; Boone and Gerba Citation2010), and hospitals (Otter, Yezli, and French Citation2011; Weinstein and Hota Citation2004). Researchers also found that human-occupied rooms contain much more bioaerosols than non-occupied rooms (Bhangar, Huffman, and Nazaroff Citation2014; Bhangar et al. Citation2016; Qian et al. Citation2012). Human respiratory activity (e.g., coughing or sneezing) is one of the important sources to contaminate these indoor surfaces. When we cough, the large droplets (initial diameter larger than 60 µm) can be transmitted in the air jet for as far as 1.5 − 2 m away horizontally before being deposited onto the ground (Liu et al. Citation2017; Xie et al. Citation2007). The smaller droplets initially travel as a cloud, lose momentum, and mix with and follow the background airflow. The cloud of small droplets could span approximately 7 and 8 m far away from the infector under the initial releasing velocity of up to 10–30 m/s (Bahl et al. Citation2020; Bourouiba Citation2020). They may deposit on environmental surfaces by turbulence (Tang et al. Citation2006; Xie et al. Citation2007). The pathogen on a surface can migrate broadly through hand touching to other surfaces (Lei et al. Citation2017) or through resuspension via human walking (Qian and Ferro Citation2008). Among these surface contamination processes, we can imagine that the near surfaces facing the coughing source will contain much more bacteria/viruses, which should be more likely to cause infection and contaminate more surfaces when touched by hands. Therefore, knowing the bacterium/virus concentration and distribution on a surface near the cough source is important and valuable for infection risk assessment and control.
There is limited research focusing on the deposition and distribution of bioaerosol onto near surfaces from a cough. Chao, Wan, and Sze To (2008) studied the expiratory droplet transportation and deposition in a hospital ward. Their study showed that gravitational settling was more important for the deposition of larger expiratory droplets. For the airborne droplets, the deposition velocity onto the side wall was comparable to that onto the upward-facing surfaces. Sze To et al. (Citation2009) experimentally studied the expiratory aerosol dispersion and deposition in aircraft cabins, showing that 35% of the droplets in weight were deposited on the seat in front and 4% of the droplets were deposited on the side seat. Wong et al. (Citation2010) studied the bioaerosol nuclei deposition on the plates placed at floor level in a test chamber. They showed that the background flow had an influence on distribution. There were more viable bacteria at the floor section near the wall opposite to the injection point than other areas. Kunkel et al. (Citation2017) studied the size-resolved dynamics of coughing bioaerosol transportation and deposition within three rooms in one apartment (0.5 m, 3 m, and 5 m away). They showed that the largest Escherichia coli weight happened at 0.5 m and decreased as the distance increased, while the largest phage (virus) weight appeared at 3 m and the smallest weight was at 0.5 m on horizontal settling plates near the floor.
However, these studies focused on airborne aerosol deposition at rather long-range situations with relatively low aerosol velocity (Lai and Nazaroff Citation2000; Zhao and Wu Citation2007). In these situations, the microorganisms inside the airborne aerosol can affect the aerodynamics and deposition on floor surfaces (Wong et al. Citation2010; Kunkel et al. Citation2017). For a short-range direct deposition onto a surface from a cough with relatively high velocity, it is still unknown whether the bacteria or viruses inside the aerosol would affect the deposition or not. Furthermore, when the high-speed jet of droplet-air mixture directly collides with the surface, the air spreading along the surface will affect the movement of droplets. The droplet jet becomes wider and moves downward due to gravitational force when traveling further. The relative distance and relative angle between the cough and front surface change the jet flow structure near the surface (O’Donovan and Murray Citation2008) and may affect the bioaerosol flow dynamics, deposition, and distribution along the surface. If the surface near the coughing person is used as a partition for protective purpose, this information will be essential in designing such a partition.
In this work, the objectives are to investigate the direct deposition of bioaerosols released from a cough, to obtain the viable bacterium/virus distributions on the surface, and to reveal the coughing droplet flow-field near the surface. We used a custom-built generator to simulate a cough and studied the droplet deposition onto a front surface with different relative distances and relative angles. The size-resolved droplet number concentration and viable bacterium/virus distribution on the surface were measured. Two microorganisms were used separately to represent the common bacteria and viruses: E. coli (ATCC 11303) and bacteriophage T3 (ATCC 11303-B3).
2. Materials and methods
2.1. Cough generator and artificial saliva solution
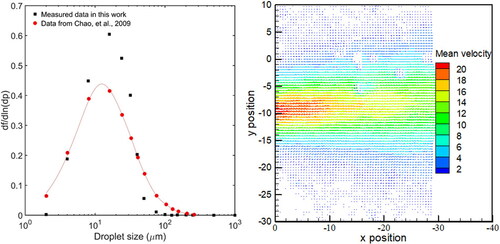
The cough generator was a custom-built aerosolization system, which had been used in previous studies (Chao, Wan, and Sze To 2008; Leung, Fu, et al. Citation2013; Sze To et al. Citation2009; Wan et al. Citation2007). The released droplet size distribution and initial velocity were tuned based on a real cough (Chao et al. Citation2009). The size distribution and releasing velocity were measured by an interferometric Mie imaging (IMI) technique and a particle imaging velocimetry (PIV) technique, respectively, and the results are shown in . The measurement setup is shown in in the online supplementary information (SI). The released droplets from the generator had a similar size distribution to a real cough with peak size at 10–20 µm. The droplet velocity was around 12 m/s, similar to the average coughing velocity of 11.7 m/s (Chao et al. Citation2009). In the experiment, the coughing process lasted 1 s and was repeated 3 times with a time interval of 5 s, controlled by an Arduino system, to simulate a series of frequent coughs. Each cough released 0.075 mL artificial saliva solution.
Figure 1. Droplet size distribution and releasing velocity from the cough generator, where f is number frequency of droplet, dp is droplet size, and the unit of the velocity in the legend is m/s.
The artificial saliva solution consisted of 76 g of glycerol and 12 g of Sodium Chloride (NaCl) in 1 litre of sterilized water (Chao, Wan, and Sze To 2008; Sze To et al. Citation2009). The nonvolatile material accounted for 6% in volume of the initial droplet volume, similar to the actual volume ratio of human respiratory fluid (Effros et al. Citation2002).
2.2. Experimental setup and solid surface for deposition
Experiments were conducted in a room with controlled temperature and relative humidity at 22ºC ± 1 °C and 72% ± 4%, respectively. The droplets, a mixture of artificial saliva solution and microorganisms, were released from the cough generator positioned in the mouth of a thermal manikin. A solid surface was placed in front of the thermal manikin as shown in . The background air velocity near the experimental setup was around 0–0.1 m/s, measured by a flow meter (7575-X, Q-track, TSI, USA).
Figure 2. (a) Schematic diagram of the experimental setup; (b) the solid surface with sampling points.
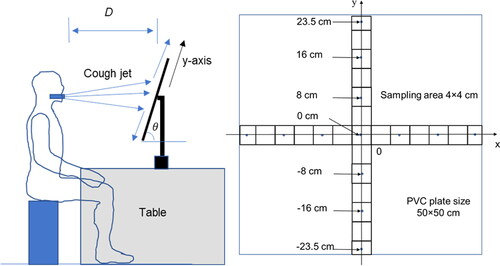
The solid surface for deposition was a smooth polyvinyl chloride (PVC) plate of 0.5 m × 0.5 m × 0.6 mm (length, width, and thickness). The surface was clean and there was no E. coli or bacteriophage on the surface before the experiment. The surface was marked by horizontal and vertical lines to indicate the sampling positions of 4 × 4 cm2 grids, as shown in . The origin of the grids was at the position pointed by the cough generator. The positive x-axis was in the right direction and the positive y-axis was in the upward direction.
2.3. Experimental procedure and studied cases
In this work, real bacteria E. coli and virus bacteriophage (phage for short) were employed. We first prepared a 200 mL E. coli or phage solution with concentration of 107 colony forming unit (CFU)/mL or plaque forming unit (PFU)/mL. Then, we load the mixture of artificial saliva solution and the microorganisms into the cough generator for aerosolization. The air jet together with aerosolized droplets directly collided with and spread along the PVC plate surface. After droplet deposition, the PVC plate was cut into small pieces with size of 4 × 4 cm2 according to the pre-marked grid with sterilized scissors. Each small piece was further cut into two symmetrical pieces. One part was used to count the size-resolved bioaerosol by a microscope (Ni-E, Nikon, Japan). The other part was put into a tube with 5 mL sterilized water to extract the deposited E. coli or phage in water. Then, the pour plate method and top agar layer method were used to measure the viable E. coli and phage concentrations in water respectively and were described in detail in Section 2.4. The deposited viable E. coli and phage numbers on surface could then be calculated.
The collection process of bacteriophage or E. coli after deposition on the surface was completed at around 40 min after aerosolization and deposition. After deposition on the surface, the microdroplets might still undergo evaporation which is the key process to inactivate bacterium/virus (Xie et al. Citation2006). Microscope observation was conducted, and it was found that the evaporation was completed within the collection time. The final equilibrium status of droplets was related to the environmental temperature and relative humidity which were well-controlled during the experiment. Thus, the measured CFU/PFU here can be regarded as the initial bacterium/virus concentration on the surface from a cough, compared with a few days’ or months’ lifetime of the microorganism on a surface.
In this experiment, the relative distance D = 20, 50, 80, and 110 cm and relative angle θ = 30°, 60°, 90° were studied. Two microorganisms, E. coli and bacteriophage were used, respectively. So, in total, 24 cases were studied, and each case was repeated 3 and 4 times.
2.4. Bacterium and virus solution preparation and cultivation method
E. coli and bacteriophage used in this work were supplied from the American Type Culture Collection (ATCC). E. coli is the Gram-negative rod-shaped bacterium with typical size of 0.5-2 µm, and the phage is a double-stranded DNA coliphage and the characteristic size is about 60-200 nm. They are commonly used as the surrogates of bacterium and virus respectively in experimental studies (Kunkel et al. Citation2017; Lai et al. Citation2018; Yoon et al. Citation2007).
For the E. coli experiment, the E. coli was cultured in advance in Tryptone soya broth (TSB) solution for 24 h in an incubator at a temperature of 37 °C. Then the E. coli solution was centrifuged at 4,000 RPM for 15 min to obtain E. coli pellets. The E. coli pellets were then resuspended in 200 mL artificial saliva solution. The E. coli concentration of the final solution for cough generator was 107 CFU/mL.Serial dilution was conducted to dilute the E. coli solution. Then, pour plate method was used to measure the E. coli concentration in a solution. First, target E. coli solution of 1 mL was transferred into a petri dish by a pipette. Then, melted sterilized Tryptone soya agar (TSA) solution of around 25 mL with temperature of around 52 °C was poured into the same petri dish. The solution was mixed by gentle shaking in the petri dish and the solution was then solidified by cooling to room temperature. Then the petri dish was inverted, sealed by the parafilm, and put in an incubator at a temperature of 37 °C for around 24 h. Then, the colony forming units (CFUs) on the petri dish were counted. The E. coli concentration in initial solution could be calculated by the CFU number on plate and the corresponding dilution ratio.
For the bacteriophage experiment, the high titer bacteriophage solution (up to 1010-11 PFU/mL) was prepared in advance. In the experiment, the solution of around 100 µL was diluted into 200 mL artificial saliva solution with a final concentration of 107 PFU/mL. First, serial dilution was conducted to dilute the target phage solution and obtain the diluted solutions with different dilution ratios. Then, top agar layer method was used to measure viable phage concentration for each of the diluted solutions: preparing solidified agar plates in advance, mixing 0.2 mL target phage solution with 0.2 mL E. coli host solution in a tube, waiting for 15 min, then mixing quickly with 3 mL 52 °C soft agar [in g/L: nutrient broth, 25; agar power, 7], and pouring onto the prepared agar plate. The plates were inverted after solidification and put into an incubator for 10 h. Then the plaque forming units (PFUs) were counted and the viable phage concentration was calculated by the PFU number and corresponding dilution ratio.
For the preparation of high titer phage solution, the bacteriophage T3 was first cultured in its E. coli host solution for 10 h in an incubator at 37 °C. The top agar layer method was then used to prepare the plates with bacteriophage plaques. The top layer of the plates with more than 100 PFUs were scraped off into a flask, stirred for 60 min at 37 °C, and then centrifuged at 10,000 g for 15 min. The supernatant was centrifuged again at 28,000 g for 30 min. The bacteriophage pellet left at the bottom was then suspended into the buffer solution and the high titer phage T3 solution was then stored in a refrigerator at 4 °C. The detailed protocol can be found in reference (Kunkel et al. Citation2017). But in the last step, the phage pellet was resuspended into the Tris buffer [in g/L: Tris, 6.05, PH 7.4; NaCl, 5.8; MgSO4·7H2O, 2] instead of the albumin-dextrose-saline (ADS) solution to avoid changing the wetting property of the solution.
The influenza A virus concentration in nasal washes from a small panel of subjects has been shown to range from 6 × 10² TCID50 to 2 × 10⁷ TCID50 (the full name: 50% Tissue Culture Infective Dose) (Murphy et al. Citation1973). TCID50 is the virus dose that successfully infects 50% of the tissue culture assays. So here we prepared solution with unfavorable concentration (i.e., upper limit of the concentration range) between 107 and 108 CFU/mL or PFU/mL as the E. coli and bacteriophage concentration.
2.5. Particle imaging velocimetry (PIV) setup
The Particle Imaging Velocimetry (PIV) technique was employed to measure the released droplet velocity from the generator and to characterize the droplet velocity field near the solid surface before colliding with the surface. In the PIV experimental setup, a laser sheet was used to light up the droplets, and a camera was positioned perpendicular to the laser sheet to capture the droplet positions. Then, droplet velocity and direction can be calculated by the time interval and position difference between two sequential moments. The time interval of double exposure was 30–80 µs, depending on the measured velocity magnitude. The PIV setup for measuring droplet velocity near the surface is shown in in the SI. Each measurement covered an area of 7 cm × 5 cm (length × height). Measurement was conducted at 4-6 positions for each case to acquire the whole picture of velocity field near the surface.
2.6. Measurement of size-resolved droplet by microscope and droplet volume calculation
The PVC sample for the microscope measurement was 2 cm × 4 cm in size. Uniform sampling method was used to take 36 pictures of droplets on the surface by the array of 4 × 9. It was ensured that the result was independent of the sampling number by comparing results of sampling 24 (4 × 6) and 54 (6 × 9) points.
The droplet volume, V, was calculated by the following spherical cap equation (Fu et al. Citation2018; Leung, Fu, et al. Citation2013; Tadmor Citation2004; Wang et al. Citation2020) due to the rather small bond number at the static status ( h: droplet height,
liquid surface tension), which indicates that surface tension dominates in microdroplets.
(1)
(1)
where
is the apparent contact angle, and D is the contact diameter of a droplet on the surface. The contact angle of the droplet was measured by a goniometer (Biolin Theta Contact Angle Meter C204A, Biolin Scientific, Sweden). The E. coli-laden droplet contact angle was measured as 41°, and the bacteriophage-laden droplet contact angle was 56°.
2.7. E. coli/bacteriophage survivability calculation
The following equation was used to calculate E. coli/bacteriophage survivability in the whole processes of coughing, deposition, and evaporation:
(2)
(2)
where N (CFU/cm2 or PFU/cm2) is the viable E. coli/bacteriophage number per unit area on the surface by cultivation, c (CFU/mL or PFU/mL) is the viable E. coli/bacteriophage concentration of the solution before aerosolization, and V (mL/cm2) is the total volume of the droplets per unit area on the surface at equilibrium status. The equivalent droplet volume before evaporation was determined by V/r, where r is the ratio of droplet volume at equilibrium status to the initial volume, and r was measured to be 13.34% by a goniometer (Biolin Theta Contact Angle Meter C204A, Biolin Scientific, Sweden).
3. Results
3.1. Size-resolved droplet number concentration and distribution on surface
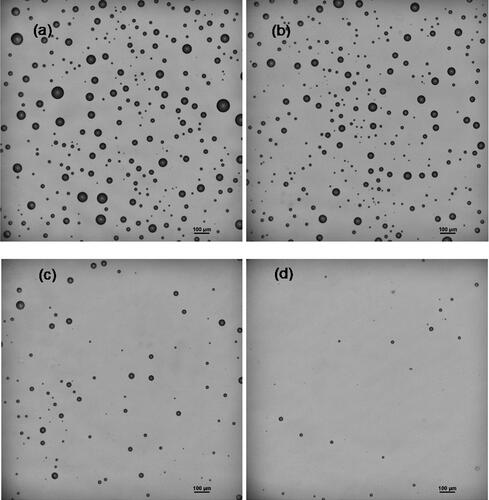
When the cough jet impinged on the flat surface, the air jet spread along the surface. Both large and small droplets deposited on the surface close to the impaction point due to inertia impaction, while some smaller droplets changed direction, spread with the air jet, and deposited on the surface far away from the impaction point. This process was visualized and further discussed by the droplet velocity field from the PIV results in Section 3.5. shows the images of deposited bacteriophage-laden droplets for the case of D = 50 cm, θ = 90° from the position y = 0 cm (origin) to the downward edge at y = −23.5 cm. It shows that both droplet size and number on the surface decreased gradually from the origin to the edge of the surface. At the origin, both large and small droplets were densely distributed on the surface, while at the edge, the small droplets were sparsely distributed.
Figure 3. Images of bacteriophage-laden droplet of the case of D = 50 cm, θ = 90° at different positions along vertical line (a) y = 0 cm, (b) -8 cm, (c) -16 cm, (d) -23.5 cm.
shows the size-resolved number concentrations of the bacteriophage-laden droplets along the y-axis on the surface under different cases. Four droplet sizes with contact diameters of 3–20, 20–50, 50–100, and 100–500 µm were presented. When D = 20 cm, the overall number concentrations of droplets along the surface demonstrated the bimodal distributions. When D = 50, 80, and 110 cm, the droplet number distributions were the unimodal distributions, but they were asymmetric and upward skewed. For D = 50 cm and θ = 90°, the number distribution of droplets was an approximately symmetric distribution. As θ decreased from 90° to 30° or D increased from 50 to 110 cm, the distribution leaned downward more heavily, and the peak position also moved downward. The peak positions of droplet number concentrations of different sub-size ranges were almost the same, except for the cases of D = 20 cm. It indicated in most cases, droplets of different sizes traveled all together without separation in the vertical direction.
Figure 4. Size-resolved droplet number concentration along the vertical line (y-axis) on the surface. The number concentration of each sub-size range is stacked. The mean value and standard deviation (error bar) of each sub-size are obtained from the experiment repeated three times.
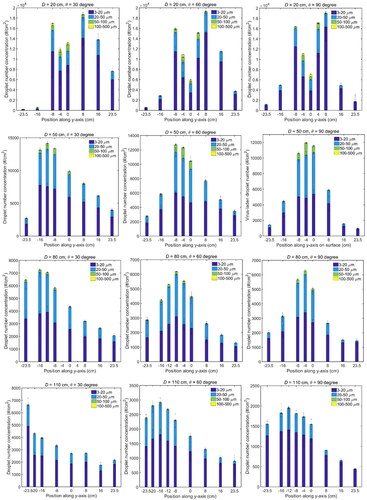
When D increased from 20 to 110 cm, the peak value of the overall number concentration decreased from around 2 × 10⁴ to 3 × 10³ #/cm2, and most of the deposited droplets were smaller than 50 µm in diameter. This is due to the fact that the cough jet became wider in radial direction and the droplet number concentration in the cough jet decreased when traveling forward. It is also found that some droplets larger than 100 µm in diameter appeared on the surface in the case of D = 20 cm. The formation of these large droplets is suspected to be the consequence of droplet agglomeration, because for a smaller D, there was a higher chance for the droplets to deposit on the same position and agglomerate on the surface.
Under the same distance D, the peak number concentrations along the surface for the three different angles were found to be in the same magnitude. It is because under the same distance, the number concentrations of the droplets in the cough jet were similar, and the impaction velocities were in the same magnitude for different surface angles, as shown in Section 3.5 later. Therefore, the effect of the surface angle on the peak number concentration is moderate, compared with the effect of the relative distance D. The possibility of agglomeration was also similar for different angles under the same distance, resulting in the similar peak number concentration of large droplets.
3.2. Phage-laden droplet volume distribution on surface
shows the distribution of phage-laden droplet volume concentration (µm3/cm2) on the surface. The droplet volume concentration was the overall volume of droplets with different sizes per unit area at the sampling position. The volume of each droplet was calculated by EquationEquation (1)(1)
(1) according to the contact diameter on the microscope images. For all cases, the droplet volume concentrations demonstrated the unimodal distributions. It was found that the distributions fit the following skew normal EquationEquation (3)
(3)
(3) , and the best-fit parameters are listed in in the SI.
(3)
(3)
where
Figure 5. Distribution of phage-laden droplet volume concentration on surface at distances of D = 20,50,80,110 cm. The mean value of volume and standard deviation (error bar) at each position are obtained from the experiment repeated three times.
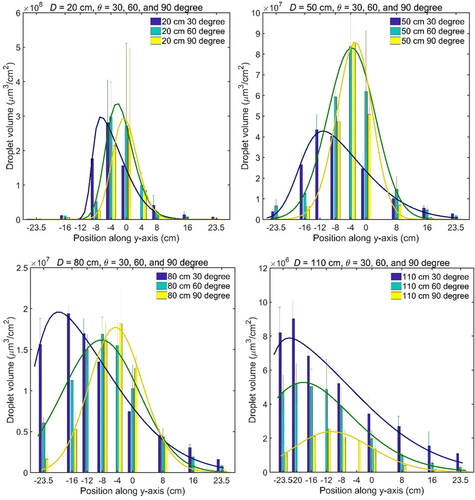
Table 1. The phage survivability in coughing and deposition processes at four relative distances and three angles of the surface.
In , it was observed that with an increase of distance or decrease of relative angle, the position of the peak shifted gradually downward (in negative y-axis direction). The skewness of the distribution decreased from around 0.9 to nearly zero when the angle increased from 30° to 90°. When the distance increased or the angle decreased, the variance of the distribution increased, meaning that the droplet volume was more sparsely distributed on the surface.
3.3. Plaque forming unit (PFU) distributions on the surface and virus survivability
shows the viable bacteriophage number concentration distribution along y-axis. The PFU distribution was also fitted by EquationEquation (3)(3)
(3) and the parameters are listed in in the SI. It was seen that the viable bacteriophage distribution was similar to the droplet volume distribution on the surface, as shown in . The detailed comparison is shown in in the SI. It indicates that the number of viable virus contained in the droplets is proportional to the droplet volume. It should be noted that the size of a virus (∼0.06 µm) was much smaller than that of the droplets (∼10 µm), so the droplet dynamics were not affected by the virus inside. The virus survivability in the cough and deposition process was calculated and shown in . It ranged from 12.9% to 23.6% with the overall mean value of 17.7% ± 5.7%. There was no clear relationship between the survivability and the relative distance or angle. This indicates that, for the short-range deposition, the survivability is independent of the relative distance and angle of the surface. Therefore, the viable microorganism concentrations on the near surface mainly depend on the droplet dynamics and deposition process. It should be noted that the values of the survivability depend on the aerosolization process, cultivation time, targeted microorganism, environmental conditions, etc. and are very different in different practical scenarios. Therefore, the values of the survivability obtained in this study cannot be directly used in risk assessment. More specific studies are essential to investigate the microorganism survivability in different situations.
Figure 6. Viable bacteriophage number concentration distribution in the vertical line (y-axis) along the surface. The mean value of PFU and standard deviation (error bar) at each position are obtained from the experiment repeated three times.
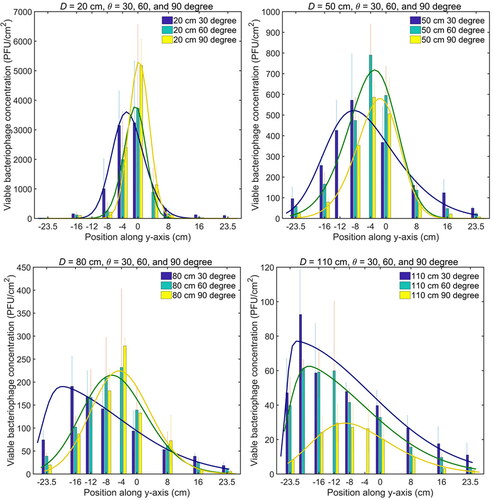
Table 2. Position ranges of impaction region of different cases.
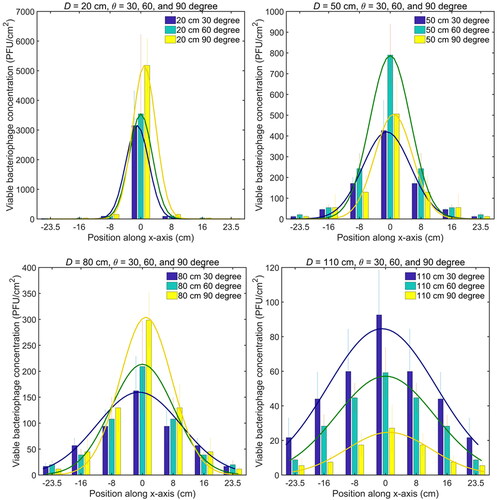
The viable bacteriophage concentrations along the x-axis () demonstrated the symmetric unimodal distributions, which were different from the upward skewed unimodal distribution in the y-axis direction. The distributions were well fitted with the normal Gaussian equation, which was a special case of skewed normal EquationEquation (3)(3)
(3) with
=0 and
=0, and the parameters are shown in Table 3S in the SI. The variance increased as the relative distance D increased, and it was larger with smaller relative angle θ. It shows that the viable virus distributions spread wider along the horizontal direction of the surface as the D increased or θ decreased, which was similar with that along the vertical direction of the surface. The peak position was the same as the mean position at x = 0 for all D and θ, but the peak value, decreased greatly as D increased.
Figure 7. Viable bacteriophage concentration distribution in the horizontal line (x-axis) along the surface. The mean value of PFU and standard deviation (error bar) at each position are obtained from the experiment repeated three times.
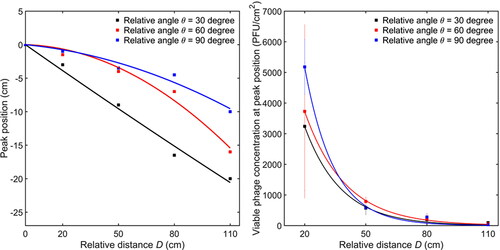
The peak positions of the viable bacteriophage concentration were not always located at the origin but changed with the relative distance and angle. shows the peak positions of the viable bacteriophage concentration on the y-axis and shows the corresponding peak values against the relative distance and angle. The peak position moved downward gradually as the distance D increased due to the gravitational force. For each distance D, the peak position was lower for a smaller relative angle. The peak positions matched with a parabolic equation, indicating the effect of gravitational force in the vertical direction. shows the values of the viable bacteriophage concentration at peak positions under different cases. They decreased sharply when the relative distance increased and were fitted by an exponential equation. The fitting parameters in and are reported in Tables 4S and 5S in the SI.
Figure 8. (a) The peak position of the viable bacteriophage concentration on the vertical line and (b) the corresponding peak values under different cases.
3.4. Droplet velocity field near the surface by particle image velocimetry (PIV) technique
shows the velocity field of cough droplets near the surfaces for the cases of D = 50 cm. The velocity fields of the other studied cases are presented in in the SI. In the PIV measurement, the cough droplets were the seed particles, Therefore, represents the velocity field of the cough droplets. According to the PIV result, as D increased from 20 to 110 cm, the droplet jet spread wider in the radial direction from 5 cm, to larger than 35 cm during the flight. The droplet jet velocity decayed from 11 m/s at the nozzle of the cough generator to around 5, 1.8, 1.1, and 0.75 m/s at the position close to the surface (around 5 cm apart), when D was equal to 20, 50, 80, and 110 cm respectively.
Figure 9. Droplet velocity field near surface for the cases of relative distance D = 50 cm. The unit of the velocity in the legend is m/s.
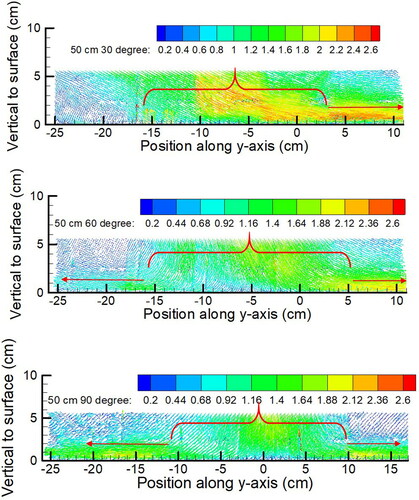
It was observed that the droplet jet first traveled toward the surface with a specific flow direction and after impaction it became a parallel spreading flow along the surface. When θ = 30°, the spreading flow was mainly in the upward direction (positive y-direction). As θ increased to 90°, the spreading flow became symmetrical, spreading both upward and downward along the surface after impaction. By observing the direction of the droplet jet at the near wall region (within 1 cm above the surface), two regions were identified: the impaction region and the spreading region where the flow was parallel to the surface, illustrated by the red bracket and red arrow in , respectively. The range of the impaction region and the ratio of droplet volume in the impaction region to the overall volume along the y-axis is summarized in . The length of the impaction region gradually increased with the increase of D and was insignificantly affected by θ. The droplet volume in the impaction region accounted for 83.0% ±3.6% of the overall volume along the y-axis. By comparing the impaction region with droplet number/volume distributions in and , it was found that the impaction region corresponded with the high number/volume area. It indicates that, in the impaction process, both the large and small droplets directly deposited in the impaction region. Large droplets were deposited by inertial impaction, and small droplets were brought close to the surface and deposited by turbulent diffusion. Some of the small droplets spread along the surface, following the spreading air, and were finally deposited by turbulent diffusion.
3.5. Distribution of E. coli droplet and comparison with that of bacteriophage droplet
Bacterium E. coli was also used to study the deposition and distribution of bacteria-laden droplets onto the near surfaces. The studied cases were the same as that of the virus deposition and the results are shown in the SI. The number concentration and distribution of E. coli droplets were similar to that of the bacteriophage droplets. The colony forming unit (CFU) distribution also matched well with the droplet volume distribution under a suitable scaling. The mean survivability of E. coli for studied cases was 24.1%± 10.3%. The volume distributions of E. coli droplets and bacteriophage droplets were compared. Both the distributions and the peak positions along the surface were similar, meaning that the micro-organisms inside the droplets did not affect the droplet deposition on near surfaces. This was different from some of the research works in the literature (Wong et al. Citation2010; Kunkel et al. Citation2017), which showed that the bacteria or viruses inside the droplets can affect the deposition because of the irregular shapes of the airborne nuclei. In this work, for short-range situations, the evaporation process was not completed before deposition, so most of the airborne droplets were larger than 10 µm in diameter. They were much larger than the bacterium or virus inside and were in spherical shape as if there were no microorganism inside. So, the droplets containing microorganisms have the same aerodynamic forces as that without microorganisms, resulting in a similar deposition pattern on near surfaces.
4. Discussion
Surface cleaning is an effective way to cut the contact route and help end the epidemic transmission of nosocomial pathogens although the debate continues about this causal relationship (Cohen, Cohen, and Shang Citation2015; Otter, Yezli, and French Citation2011; Tschudin-Sutter et al. Citation2017). In the contact precaution, the cleaning and disinfection of the area near the patient should be conducted frequently. Our research reveals that the impaction region with the length of around 21 cm contains around 83.0% of viable deposited bacteria/viruses along the surface. Thus, the cleaning and disinfection of the high concentration areas immediately after a cough could effectively reduce infection risk and minimize the further spreading of bacteria/viruses through contact. On the other hand, our findings also indicate that the viable virus/bacterium can be brought by the spreading air and deposited far away from the impaction point. Therefore, the cleaning process should be taken with caution.
The distributions of the deposited bacteria/viruses on the surfaces obtained in this work could improve the accuracy of estimating contact exposure. In modeling of infection risk of the contact route (Jones and Adida Citation2011; Sze‐To et al., Citation2014; Lei et al. Citation2018; Nicas and Jones Citation2009), the viable bacterium/virus distribution on the surfaces near the infector is conventionally assumed to be uniform and the surface is considered as a whole unit for bacterium/virus transfer. The current finding of the bacterium/virus distribution could be integrated into the model, working as the initial microorganism concentration of different touching positions. It should be noted that the number of viable bacteria/viruses on the surface depends on the viabilities of the targeted microorganisms. Our measured microorganism concentration on the surface cannot represent all microorganisms, but the relative spatial distribution of the concentration would be helpful in assessing the relative risk, and here we also demonstrate a methodology for future analysis.
The results in this work suggest some guidelines in setting up a partition as a possible intervention method to prevent the direct droplet spray on nearby people. When there is a vertical partition in front of a sick person who coughs, the cough jet together with the virus will spray on the partition surface, while protecting the people behind the partition. The size of the partition should be large enough to, at least, cover the spray area. According to the results of the droplet flow field, the spray area is centered at the level of mouth with a diameter related to the distance between the person and the partition. Therefore, for a farther distance, such as 110 cm from the sick person, a higher partition is needed because the aerosol spreads wider during the flight. When the distances are 20 cm, 50 cm, 80 cm, and 110 cm, the height of the partition should be at least 10 cm, 15 cm, 20 cm, and >30 cm higher than the level of the person’s mouth respectively. Since the spray area is symmetric about the person’s mouth, the required widths of the partition are at least 20, 30, 40, and >60, respectively, with the person’s mouth at the middle. When a smaller partition with suitable size is installed at a position closer to the sick person, it is not necessary to install another partition with larger size further away because most of the aerosols are blocked by the front partition. It should be noted that the suggestions above are based on the horizontal coughing posture result (i.e., θ = 90°). Head posture with different angles is not considered.
5. Conclusions
In this work, we study the bioaerosol deposition and distribution onto a flat surface from a cough. It is found that when the cough jet impinges on the surface, both the large and small droplets directly deposit on the surface, forming a high concentration area, and then only some small droplets flow with the spreading air. The distribution of viable E. coli/phage fits well with skew normal distribution. The impaction region with the length of around 21 cm contains up to 83% of viable deposited bacterium/virus on the vertical line along the surface. The peak position and the peak value of the virus distribution are correlated with the relative distance and angle. The impaction velocity varies from 5 m/s to less than 1 m/s under different relative distances, while the survivability is similar for different distances. This indicates that the impaction velocity does not affect the microorganism survivability. The E. coli-laden droplet has similar distribution with that of a phage-laden droplet, meaning that the micro-organisms inside the droplets do not affect the droplet deposition onto near surfaces. The near surface could work as a protective partition to block cough spraying. The size of the partition is determined by the flow field of the cough jet near the surface; closer to the coughing person, a smaller partition is required. The mechanism of the deposition and distribution of cough droplets can help set up surface cleaning and disinfection strategies and provide guidelines for partition sizes in front of the infector.
Supplemental Material
Download MS Word (4 MB)Additional information
Funding
References
- Atkinson, M. P., and L. M. Wein. 2008. Quantifying the routes of transmission for pandemic influenza, Bull. Math. Biol. 70(3), 820–867.
- Bahl, P., C. Doolan, C. de Silva, A. A. Chughtai, L. Bourouiba, and C. R. MacIntyre. 2020. Airborne or droplet precautions for health workers treating COVID-19? J. Infect. Dis. jiaa189, doi:https://doi.org/10.1093/infdis/jiaa189.
- Bhangar, S., R. I. Adams, W. Pasut, J. A. Huffman, E. A. Arens, J. W. Taylor, T. D. Bruns, and W. W. Nazaroff. 2016. Chamber bioaerosol study: Human emissions of size-resolved fluorescent biological aerosol particles. Indoor Air. 26 (2):193–206. doi:https://doi.org/10.1111/ina.12195.
- Bhangar, S., J. A. Huffman, and W. W. Nazaroff. 2014. Size‐resolved fluorescent biological aerosol particle concentrations and occupant emissions in a university classroom. Indoor Air 24 (6):604–17. doi:https://doi.org/10.1111/ina.12111.
- Boone, S. A., and C. P. Gerba. 2005. The occurrence of influenza A virus on household and day care center fomites. J. Infect. 51 (2):103–9. doi:https://doi.org/10.1016/j.jinf.2004.09.011.
- Boone, S. A., and C. P. Gerba. 2010. The prevalence of human parainfluenza virus 1 on indoor office fomites. Food Environ. Virol. 2 (1):41–6. doi:https://doi.org/10.1007/s12560-010-9026-5.
- Bourouiba, L. 2020. Turbulent gas clouds and respiratory pathogen emissions: Potential implications for reducing transmission of COVID-19. JAMA 323 (18):1837–8. doi:https://doi.org/10.1001/jama.2020.4756.
- Chao, C. Y. H., M. P. Wan, L. Morawska, G. R. Johnson, Z. D. Ristovski, M. Hargreaves, K. Mengersen, S. Corbett, Y. Li, X. Xie, et al. 2009. Characterization of expiration air jets and droplet size distributions immediately at the mouth opening. J. Aerosol Sci. 40 (2):122–33. doi:https://doi.org/10.1016/j.jaerosci.2008.10.003.
- Cohen, C. C., B. Cohen, and J. Shang. 2015. Effectiveness of contact precautions against multidrug-resistant organism transmission in acute care: A systematic review of the literature. J. Hosp. Infect. 90 (4):275–84. doi:https://doi.org/10.1016/j.jhin.2015.05.003.
- Cowling, B. J., D. K. M. Ip, V. J. Fang, P. Suntarattiwong, S. J. Olsen, J. Levy, T. M. Uyeki, G. M. Leung, J. S. Malik Peiris, T. Chotpitayasunondh, et al. 2013. Aerosol transmission is an important mode of influenza A virus spread. Nat. Commun. 4 (1):1–6. doi:https://doi.org/10.1038/ncomms2922.
- Effros, R. M., K. W. Hoagland, M. Bosbous, D. Castillo, B. Foss, M. Dunning, M. Gare, W. Lin, and F. Sun. 2002. Dilution of respiratory solutes in exhaled condensates. Am. J. Respir. Crit. Care Med. 165 (5):663–9. doi:https://doi.org/10.1164/ajrccm.165.5.2101018.
- Fisk, W. J. 2000. Health and productivity gains from better indoor environments and their relationship with building energy efficiency. Annu. Rev. Energy Environ. 25 (1):537–66.
- Fu, S. C., Y. S. Cheung, H. H. Lee, J. K. Kwan, and C. Y. Chao. 2018. Studies on detachment behavior of micron sized droplets: A comparison between pure fluid and nanofluid. Aerosol Sci. Technol. 52 (1):69–77.
- Jones, R. M., and E. Adida. 2011. Influenza infection risk and predominate exposure route: uncertainty analysis. Risk Analysis: An International Journal 31 (10):1622–31. doi:https://doi.org/10.1111/j.1539-6924.2011.01600.x.
- Kunkel, S. A., P. Azimi, H. Zhao, B. C. Stark, and B. Stephens. 2017. Quantifying the size-resolved dynamics of indoor bioaerosol transport and control. Indoor Air. 27 (5):977–87. doi:https://doi.org/10.1111/ina.12374.
- Lai, A. C., and W. W. Nazaroff. 2000. Modeling indoor particle deposition from turbulent flow onto smooth surfaces. J. Aerosol Sci. 31 (4):463–76.
- Lai, A. C., T. F. Tan, W. S. Li, and D. Ip. 2018. Emission strength of airborne pathogens during toilet flushing. Indoor Air 28 (1):73–9. doi:https://doi.org/10.1111/ina.12406.
- Lei, H., Y. Li, S. Xiao, C. Lin, S. L. Norris, D. Wei, Z. Hu, and S. Ji. 2018. Routes of transmission of influenza A H1N1, SARS CoV, and norovirus in air cabin: Comparative analyses. Indoor Air. 28 (3):394–403. doi:https://doi.org/10.1111/ina.12445.
- Lei, H., Y. Li, S. Xiao, X. Yang, C. Lin, S. L. Norris, D. Wei, Z. Hu, and S. Ji. 2017. Logistic growth of a surface contamination network and its role in disease spread. Sci. Rep. 7 (1):14826 doi:https://doi.org/10.1038/s41598-017-13840-z.
- Leung, W. T., S. C. Fu, G. N. Sze To, and C. Chao. 2013. Comparison of the resuspension behavior between liquid and solid aerosols. Aerosol Sci. Technol. 47 (11):1239–47. doi:https://doi.org/10.1080/02786826.2013.831973.
- Leung, W. T., G. N. Sze‐To, C. Chao, S. Yu, and J. Kwan. 2013. Study on the interzonal migration of airborne infectious particles in an isolation ward using benign bacteria. Indoor Air 23 (2):148–61. doi:https://doi.org/10.1111/j.1600-0668.2012.00797.x.
- Liu, L.,. J. Wei, Y. Li, and A. Ooi. 2017. Evaporation and dispersion of respiratory droplets from coughing. Indoor Air. 27 (1):179–90. doi:https://doi.org/10.1111/ina.12297.
- Lowen, A. C., J. Steel, S. Mubareka, and P. Palese. 2008. High temperature (30 degrees C) blocks aerosol but not contact transmission of influenza virus. J. Virol. 82 (11):5650–2. doi:https://doi.org/10.1128/JVI.00325-08.
- Murphy, B. R., E. G. Chalhub, S. R. Nusinoff, J. Kasel, and R. M. Chanock. 1973. Temperature-sensitive mutants of influenza virus. III. Further characterization of the ts-1 [E] influenza A recombinant (H3N2) virus in man. J. Infect. Dis. 128 (4):479–87. doi:https://doi.org/10.1093/infdis/128.4.479.
- Nicas, M., and R. M. Jones. 2009. Relative contributions of four exposure pathways to influenza infection risk. Risk Anal: Int. J. 29 (9):1292–303. doi:https://doi.org/10.1111/j.1539-6924.2009.01253.x.
- O’Donovan, T. S., and D. B. Murray. 2008. Fluctuating fluid flow and heat transfer of an obliquely impinging air jet. Int. J. Heat Mass Transf. 51 (25-26):6169–79.
- Otter, J. A., S. Yezli, and G. L. French. 2011. The role played by contaminated surfaces in the transmission of nosocomial pathogens. Infect. Control Hosp. Epidemiol. 32 (7):687–99. doi:https://doi.org/10.1086/660363.
- Qian, J., and A. R. Ferro. 2008. Resuspension of dust particles in a chamber and associated environmental factors. Aerosol. Sci. Technol. 42 (7):566–78. doi:https://doi.org/10.1080/02786820802220274.
- Qian, J., D. Hospodsky, N. Yamamoto, W. W. Nazaroff, and J. Peccia. 2012. Size‐resolved emission rates of airborne bacteria and fungi in an occupied classroom. Indoor Air 22 (4):339–51. doi:https://doi.org/10.1111/j.1600-0668.2012.00769.x.
- Sze To, G. N., M. P. Wan, C. Chao, L. Fang, and A. Melikov. 2009. Experimental study of dispersion and deposition of expiratory aerosols in aircraft cabins and impact on infectious disease transmission. Aerosol Sci. Technol. 43 (5):466–85. doi:https://doi.org/10.1080/02786820902736658.
- Sze‐To, G. N., Yang, Y. J. K. Kwan, S. C. Yu, and C. Y. Chao. 2014. Effects of surface material, ventilation, and human behavior on indirect contact transmission risk of respiratory infection. Risk Anal. 34 (5):818–30.
- Tadmor, R. 2004. Line energy and the relation between advancing, receding, and young contact angles. Langmuir 20 (18):7659–64. doi:https://doi.org/10.1021/la049410h.
- Tang, J. W., Y. Li, I. Eames, P. Chan, and G. L. Ridgway. 2006. Factors involved in the aerosol transmission of infection and control of ventilation in healthcare premises. J. Hosp. Infect. 64 (2):100–14. doi:https://doi.org/10.1016/j.jhin.2006.05.022.
- Tellier, R. 2006. Review of aerosol transmission of influenza A virus. Emerg. Infect. Dis. 12 (11):1657–62. doi:https://doi.org/10.3201/eid1211.060426.
- Tellier, R. 2009. Aerosol transmission of influenza A virus: A review of new studies. J. R. Soc. Interface 6 (suppl_6). S783–S790.
- Tschudin-Sutter, S.,. J. Lucet, N. T. Mutters, E. Tacconelli, J. R. Zahar, and S. Harbarth. 2017. Contact precautions for preventing nosocomial transmission of extended-spectrum β Lactamase-Producing Escherichia coli: A Point/Counterpoint Review. Clin. Infect. Dis. 65 (2):342–7. doi:https://doi.org/10.1093/cid/cix258.
- Wan, M. P., C. Chao, Y. D. Ng, G. N. Sze To, and W. C. Yu. 2007. Dispersion of expiratory droplets in a general hospital ward with ceiling mixing type mechanical ventilation system. Aerosol Sci. Technol. 41 (3):244–58. doi:https://doi.org/10.1080/02786820601146985.
- Wang, C. T., W. T. Leung, J. C. Xu, S. C. Fu, and C. Y. Chao. 2020. Droplet detachment behavior from a rough hydrophilic surface. J. Aerosol Sci. 139:105469. doi:https://doi.org/10.1016/j.jaerosci.2019.105469.
- Weinstein, R. A., and B. Hota. 2004. Contamination, disinfection, and cross-colonization: Are hospital surfaces reservoirs for nosocomial infection? Clin. Infect. Dis. 39 (8):1182–9. doi:https://doi.org/10.1086/424667.
- WHO. 2018. Influenza (seasonal) fact sheet/detail/influenza (seasonal).
- Wong, L. T., W. Y. Chan, K. W. Mui, and A. Lai. 2010. An experimental and numerical study on deposition of bioaerosols in a scaled chamber. Aerosol Sci. Technol. 44 (2):117–28. doi:https://doi.org/10.1080/02786820903426226.
- Xie, X.,. Y. Li, A. Chwang, P. L. Ho, and W. H. Seto. 2007. How far droplets can move in indoor environments-revisiting the Wells evaporation-falling curve. Indoor Air. 17 (3):211–25. doi:https://doi.org/10.1111/j.1600-0668.2007.00469.x.
- Xie, X.,. Y. Li, T. Zhang, and H. H. Fang. 2006. Bacterial survival in evaporating deposited droplets on a teflon-coated surface. Appl. Microbiol. Biotechnol. 73 (3):703–12. doi:https://doi.org/10.1007/s00253-006-0492-5.
- Yoon, K., J. H. Byeon, J. Park, and J. Hwang. 2007. Susceptibility constants of Escherichia coli and Bacillus subtilis to silver and copper nanoparticles. Sci. Total Environ. 373 (2/3):572–5. doi:https://doi.org/10.1016/j.scitotenv.2006.11.007.
- Yu, I. T., Y. Li, T. W. Wong, W. Tam, A. T. Chan, J. H. Lee, D. Y. Leung, and T. Ho. 2004. Evidence of airborne transmission of the severe acute respiratory syndrome virus. New Engl. J. Med. 350 (17):1731–9. doi:https://doi.org/10.1056/NEJMoa032867.
- Zhao, B., and J. Wu. 2007. Particle deposition in indoor environments: Analysis of influencing factors. J. Hazard. Mater. 147 (1/2):439–48. doi:https://doi.org/10.1016/j.jhazmat.2007.01.032.