
 ?Mathematical formulae have been encoded as MathML and are displayed in this HTML version using MathJax in order to improve their display. Uncheck the box to turn MathJax off. This feature requires Javascript. Click on a formula to zoom.
Abstract
Very few measurements exist of the composition and contribution to cloud condensation nuclei (CCN) of organic mass (OM) at different sizes for particles over the Southern Ocean. Airborne and shipboard measurements of organic composition, aerosol number and mass size distributions, and CCN spectra during the Southern Ocean Clouds, Radiation, Aerosol Transport Experimental Study (SOCRATES) provide a comparison of organic contributions at three different size ranges: (1) by scanning transmission X-ray microscope (STXM) with near edge X-ray absorption fine structure (NEXAFS) for particles 0.25–1.75 µm diameter, (2) by scanning transmission electron microscopy with energy dispersive X-ray spectroscopy (STEM-EDS) for particles 0.1–0.5 and 0.5–1µm diameter, and (3) indirectly by comparing CCN spectra to particle size distributions for particles <0.15 µm diameter. Organic functional groups from STXM-NEXAFS microscopy indicate that the majority of particles between 0.25 and 1.75 µm diameter with detectable organic components were consistent with marine organic signatures associated with sea spray particles, which was also true for ice nucleating particles sampled by immersion freezing <−27 °C. Clustering of the 96 NEXAFS spectra resulted in 5 distinct types of sea spray related organic mixtures (four salt-containing sea spray particle types and one organic-rich particle type without a salt core) that accounted for 76% of the particles, including two that appear primary and three that include acid groups that are likely from secondary sources. STEM analysis indicates that particles 0.1–0.5 µm diameter were mostly sulfate and particles 0.5–1 µm diameter were mostly sodium-based sea spray. The hygroscopicity of most particles >0.1 µm diameter were consistent with sodium-based sea spray and sulfate particles, providing closure between STEM and CCN measurements. Particles <0.15 µm diameter had kappa values of 0.2–0.5, indicating the substantial presence of OM at these sizes. The organic component fraction estimated from comparing the size distribution and supersaturation spectra varied from <10% to 70% for particles <0.15 µm diameter. This result shows the impact of the organic composition of particles <0.15 µm diameter on CCN concentrations at typical supersaturations for the SO. This variable OM fraction accounted for <0.1 µg/m3 mass concentrations of particles smaller than 0.15 µm diameter but may play a role at cloud supersaturations greater than 0.3%.
Copyright © 2020 American Association for Aerosol Research
EDITOR:
1. Introduction
Aerosol-cloud interactions are poorly understood and are the leading source of uncertainty for the top-of-the-atmosphere aerosol radiative forcing (Stocker et al., Citation2013). Depending on their size and chemical composition particles can act as cloud condensation nuclei (CCN) on which cloud droplets form, affecting cloud brightness and precipitation patterns (Andreae and Rosenfeld Citation2008). Oceans cover about 70% of Earth and their dark surfaces makes the radiative impacts of clouds particularly important. This is especially relevant over the Southern Ocean (SO), which is the cloudiest region on Earth, as cloud properties are sensitive to aerosol concentrations (Whittlestone and Zahorowski Citation1998). The often low particle number concentrations in the SO marine boundary layer (MBL) and the remote location of the SO, where the aerosol is minimally perturbed from anthropogenic influence, provide a unique environment to investigate the radiative impacts of aerosol particles (Gabric, Whetton, and Cropp Citation2001; Ayers and Gillett Citation2000; Andreae et al. Citation1999; Quinn et al. Citation1998).
The SO is a biologically active region emitting primary marine aerosol (sea-spray) (Quinn and Bates Citation2011) and marine vapor precursors (e.g., dimethyl sulfide, DMS, and isoprene) that subsequently form secondary sulfate and organics (Liu et al. Citation2018; Kawamura et al. Citation1996). Previous studies highlighted the importance of sulfur-containing particles (from DMS oxidation) on CCN and cloud properties in the SO MBL and near Antarctica. McCoy et al. (Citation2015) found that biogenic sulfate provided the strongest link to cloud droplet number concentrations as it explained 48% of variability compared to only 24% for the organic mass fraction over the SO. Asmi et al. (Citation2010) found that aerosol particles in Antarctica were very hygroscopic (growth factor = 1.75 for 90 nm diameter particles) similar to sulfuric acid particles. Vallina, Simó, and Gassó (Citation2006) found that the product of chlorophyll and hydroxyl radical concentrations (a proxy for DMS photooxidation products) explained 89% of the variability of CCN concentrations over the SO. At Cape Grim, Tasmania (41oS), where the sampled air mass is frequently influenced by the SO, CCN concentrations at 0.23% supersaturation correlated strongly and positively with DMS-derived MSA concentrations (Korhonen et al. Citation2008; Ayers and Gras Citation1991). At higher latitudes (45oS–60oS) the fraction of cloud droplets and CCN from sea-spray emissions is generally larger due to higher wind speeds (Fossum et al. Citation2018; McCoy et al. Citation2015; Korhonen et al. Citation2008; Virkkula et al. Citation2006).
There are also several observations that show the contribution of sea-spray organic mass (OM) to aerosol samples at Cape Grim (Xu et al. Citation2013; Virkkula et al. Citation2006; Middlebrook, Murphy, and Thomson Citation1998; Murphy et al. Citation1998), near the Great Barrier Reef, Australia (Leck and Bigg Citation2008), and in the southeastern Pacific (Hawkins and Russell Citation2010). Marine OM accounts for between <10% and 30% of the submicron aerosol mass in the SO MBL, at sizes relevant for CCN. For instance, Virkkula et al. (Citation2006) reported that OM accounted for more than 10% of the submicron aerosol mass in the south Pacific and near Antarctica. Asmi et al. (Citation2010) found that 20–30% of the submicron aerosol mass in Antarctica was organic. Gras and Ayers (Citation1983) reported an OM volume fraction of 11% at Cape Grim, Tasmania, for particles smaller than 0.6 µm diameter. Bigg (Citation2007) reported that up to 30% of particles between 80 and 200 contained primary OM at Cape Grim.
The OM fraction of the submicron marine aerosol has also been linked to cloud properties. Meskhidze and Nenes (Citation2006) reported increased CCN concentrations during phytoplankton blooms over the SO. Krüger and Graßl (Citation2011) reported increased CCN column content over regions with higher chlorophyll concentrations which decreased cloud droplet effective radius and increased cloud brightness over the SO particularly near the Antarctic coast. Similar results were also reported over the northeastern Atlantic (Ovadnevaite et al. Citation2011). These results highlight the complex interactions of sea-spray OM with clouds and the climate.
Here airborne measurements of organic functional groups by STXM-NEXAFS (for particles 0.25–1.75 µm geometric diameter), elemental composition by STEM-EDS (for particles 0.1–0.5 and 0.5–1 µm geometric diameter), aerosol number size distributions (for particles >0.07 µm optical diameter) and CCN number concentrations (for supersaturations 0.1–0.5%) over the remote SO, as part of the Southern Ocean Clouds, Radiation, Aerosol Transport Experimental Study (SOCRATES) are compiled to assess the composition and contribution of organic components in these different size ranges. We also examine organic functional groups associated with collected ice nucleating particles (INPs) over the Southern Ocean for the first time. The comparison of independent techniques allows for assessment of the role of organics on CCN number concentrations.
2. Method
Measurements during the SOCRATES field campaign were performed onboard the NSF/NCAR Gulfstream-V High-performance Instrumented Airborne Platform for Environmental Research (GV HIAPER) observational platform. Briefly, 15 different research flights (RF, numbered RF1 to RF15) were conducted between 15 January and 24 February 2018, departing Hobart, Tasmania, and flying south over the Southern Ocean to about 62°S. The flights included various level legs to sample below, in, and above clouds. More details can be found in Sanchez et al. 2020, Twohy et al. (2020), and McFarquhar et al. (2020).
Two miniaturized streamwise thermal-gradient CCN chambers and a CN counter measured online in the aircraft cabin after collection through the HIAPER Modular Inlet (HIMIL; (Stith et al. Citation2009)) or a counterflow virtual impactor (CVI; (Noone et al. Citation1988; Twohy, Strapp, and Wendisch Citation2003)). An Ultra High Sensitivity Aerosol Spectrometer (UHSAS, DMT) was mounted on the aircraft wing to characterize size distributions of particles with optical diameters between 0.07 and 1 μm. Particles were collected for later analysis by three methods: (1) CVI with counterflow and heaters off for below cloud and above cloud samples, (2) CVI with counterflow and heaters on for cloud droplet residuals, and (3) a Continuous Flow Diffusion Chamber (CFDC) for Ice Nucleating Particles (INP). No CVI samples were collected in icing conditions. Below and above cloud particles from the HIMIL, cloud droplet residuals from the CVI, and INP from the CFDC were impacted on carbon-coated electron microscope grids for subsequent transmission electron microscopy (TEM) analysis and on silicon nitride windows (Si3N4; Silson Ltd., 0.5 × 0.5 mm dimension and 0.1 µm thickness) for STXM-NEXAFS analysis. INP from near the ocean surface were also collected aboard the Australian R/V Investigator ship using a duplicate CFDC as part of the Clouds Aerosols, Precipitation, Radiation, and Atmospheric Composition over the Southern Ocean (CAPRICORN) II experiment.
Particle diameters for TEM-EDS and STXM-NEXAFS measurements refer to spherical-equivalent geometric diameter of the particles collected. The impactors provided aerodynamic cutoffs, but these diameters have been converted to spherical-equivalent geometric diameters using a density of 2 g cm−3. A density of 2 g cm−3 was chosen because it was between dry ammonium bisulfate and sea-spray, which we expect to represent the majority of mass in the >0.1 µm size range. Ambient and cloud residuals were collected in two different dry size ranges, ∼0.1–0.5 µm diameter and >0.5 µm diameter. UHSAS measurements use optical diameters based on calibration by PSL. Comparisons of the two measurements assume that the optical and geometric diameters are equal since size-resolved refractive indices were not available for correction. Therefore, except where noted (see Section 2.6), the term “diameter” is used to mean spherical-equivalent geometric diameter, with the equivalent aerodynamic diameter assuming a density of 2 g cm−3 and the equivalent optical diameter assuming the refractive index of PSL. The density assumption has no impact on the results because all microscopy results are presented for geometric diameter. The uncertainty associated with the refractive index is discussed in Section 2.4.
2.1. Hysplit back trajectories
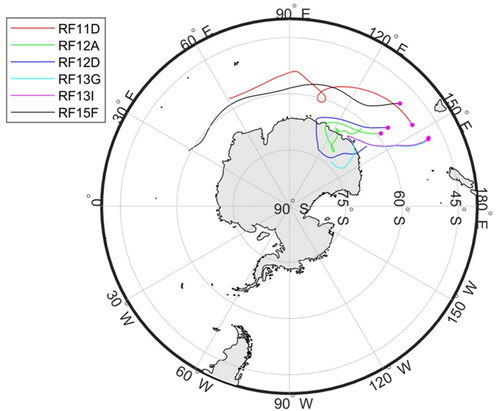
Back trajectories (120-h at 100–200 m arriving altitudes) were calculated using the Hybrid Single-Particle Lagrangian Integrated Trajectory (HYSPLIT) (Stein et al. Citation2015; Draxler and Rolph Citation2003) model for specific sampling times during four flights (). Back trajectories were only calculated for periods of time during which concurrent STEM size-resolved chemical composition, CCN spectra and UHSAS distributions were available. The air sampled during those flights was influenced by Antarctica and by the SO with little influence from polluted regions.
Figure 1. 5-day HYSPLIT back trajectories calculated for the different research flights (RF) of interest at arriving altitudes between 100 and 200 m. Letters after flight number denote different legs.
2.2. Organic functional group composition by STXM-NEXAFS for 0.25–1.75 µm diameter particles
Particles were analyzed offline at the Lawrence Berkeley National Laboratories (LBL) Advanced Light Source (ALS) Beamline 5.3.2.2. by scanning transmission X-ray microscope (STXM) with near edge X-ray absorption fine structure (NEXAFS) following established protocols (Maria et al. Citation2004; Russell, Maria, and Myneni Citation2002). STXM-NEXAFS characterizes organic functional groups in the collected particles based on the energy of radiation absorbed near the carbon edge. 15 samples collected during different legs for RF01, RF08, and RF12-15 (with collection times varying between 2 and 5 min) were analyzed to collect 159 complete particle stacks of spectra. These 159 particles were analyzed by an automated shape-recognition algorithm, which identified areas of high pre-edge density (non-carbon components) and high carbon density (post-edge minus pre-edge) (Takahama, Liu, and Russell Citation2010). 99 particles (61%) passed data quality control checks, which removed particles for which the carbon absorbance was within the noise, and, of those 99 particles, 96 particles had spectra with sufficient signal to categorize. A summary of these 96 particles is shown in in the online supplementary information (SI).
Table 1. Summary of STXM-NEXAFS clustered particle spectra shown in .
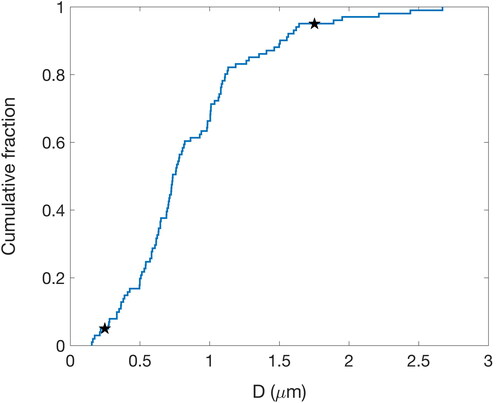
STXM-NEXAFS relies on manual identification of particles within the collected windows as targets for detailed, high resolution mapping. Finding micron-sized particles on millimeter windows relies on the density of collection and the optical density of the particles. The beamline time available for this project included four sessions with nine 8-h shifts each, but the fourth session in late March 2020 was canceled due to the COVID19 closure of ALS. The sizes of particles retrieved by STXM were between 0.25 µm diameter at the 5th percentile and 1.75 µm diameter at the 95th percentile (). All but one of the samples analyzed were collected on an impactor with nominal 0.5 µm lower cut size, resulting in less than 25% of the analyzed particles <0.5 µm diameter and only two <0.2 µm diameter. Approximately 30% of particles had geometric diameter larger than 1 µm. Note that this implies that the organic functional groups reported in this study are mostly representative of particles in the larger end of the accumulation mode and in the coarse mode, which represent a large fraction of the mass but very few of the total number of particles in the MBL. For this reason, we do not expect the STXM-NEXAFS composition to be representative of the majority of CCN-sized particles. In addition, at approximately six particles per sample, counting statistics imply that the particle types for any one sample should be considered qualitatively but not quantitatively.
Figure 2. Cumulative distribution for the spherical-equivalent geometric diameter of particles analyzed by STXM-NEXAFS. The black stars indicate the 5th and 95th percentiles.
STXM-NEXAFS spectra for the SOCRATES project were clustered into nine categories using the MATLAB K-means clustering algorithm (, ). The cluster mean spectra were subsequently compared to particle spectra collected during several field campaigns (Laskin et al. Citation2012; Hawkins and Russell Citation2010; Takahama et al. Citation2007) and inside a wave flume (Pham et al. Citation2017). Six categories identified by Takahama et al. (Citation2007) as types b, d, i, j, k, and l were identified as similar to six of the categories of sampled particles. These included combustion-like particles (types b and d) and particles with organic carbon around a non-carbon core (types j, k, and l). A published reference spectrum was deemed similar if the clustered mean and reference spectra shared common peaks and a cosine similarity >0.95 (). If a reference spectrum was identified for a particle cluster, then that cluster was labeled with the name of the previously published category. In addition, the Type l category and 2 new categories (Mcarb and Macid, ) were similar to two sea-spray categories identified by Hawkins and Russell (Citation2010) and one category identified by Laskin et al. (Citation2012) in that they identified the same peaks but not in similar ratios. Three new sodium-based spectra types (named here Mcarb, Malk, Macid) were identified based on the criteria that (1) the match with previous spectra had cosine similarity <0.95 with all prior spectral categories and (2) one or more functional groups differed compared to past spectral types. The comparison of cluster averages and published reference spectra is shown in . Representative images from each cluster are shown in . These images show some distinctive shapes that appeared in specific cluster types, including for type Mcarb, Malk, Macid, l, and b. There is also some overlap of the shapes with multiple spectra categories for the circular shapes shown in l and Malk and for the coatings around salt cubes Mcarb, Malk, and Macid. The number of particles characterized is insufficient to identify or rule out a characteristic morphology of each cluster.
Figure 3. Normalized optical density (thin lines) versus beam energy for spectra in the 9 particle clusters (). Thick black lines in each panel are averages (if N > 1). The spectra are arranged by alphabetical order starting with previously identified categories (b, d, i, j, k, and l from Takahama et al. [Citation2007]) and then with new categories (Macid, Malk, and Mcarb). The vertical scale for the average spectra is larger than from those of the individual spectra in order to make the peaks easier to see. Vertical dotted lines correspond to R(C = C)R’ (285.0 eV), R(C = O)R (286.7 eV), R(CHn)R’ (287.7 eV), R(C = O)OH (288.7 eV), CO32- (290.4 eV), and potassium (297.4 eV and 299.9 eV) transitions.
![Figure 3. Normalized optical density (thin lines) versus beam energy for spectra in the 9 particle clusters (Table 1). Thick black lines in each panel are averages (if N > 1). The spectra are arranged by alphabetical order starting with previously identified categories (b, d, i, j, k, and l from Takahama et al. [Citation2007]) and then with new categories (Macid, Malk, and Mcarb). The vertical scale for the average spectra is larger than from those of the individual spectra in order to make the peaks easier to see. Vertical dotted lines correspond to R(C = C)R’ (285.0 eV), R(C = O)R (286.7 eV), R(CHn)R’ (287.7 eV), R(C = O)OH (288.7 eV), CO32- (290.4 eV), and potassium (297.4 eV and 299.9 eV) transitions.](/cms/asset/e23fe62d-95fa-4967-bf77-24d7e2697275/uast_a_1845296_f0003_b.jpg)
Figure 4. Comparison of cluster average spectra measured during the SOCRATES campaign and shown in (solid black lines) with reference spectra. Solid blue lines are spectra identified by Takahama et al. (Citation2007). The solid green lines shown with Types Mcarb and l particles are calcareous phytoplankton and Type II Polysaccharide (PsII) identified by Hawkins and Russell (Citation2010), respectively. The solid red line shown with type Macid was identified by Laskin et al. (Citation2012) as representative of aged sea spray particles during the CARES study at Point Reyes, CA.
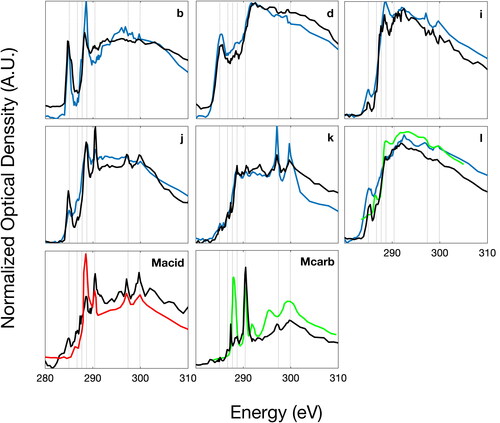
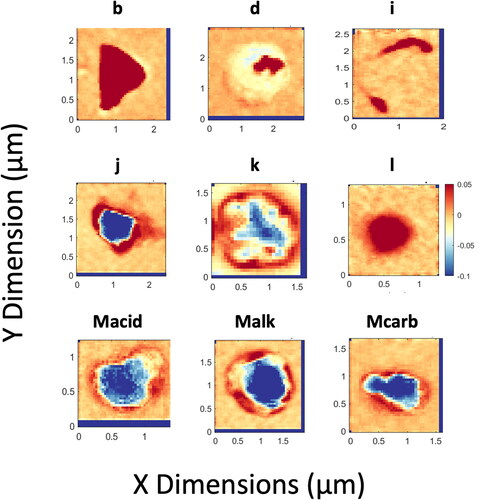
Figure 5. Total carbon map for representative particles from each cluster category shown in . For each image, the red-blue color scale shown is the relative carbon absorption. Red denotes the maximum carbon absorption and blue denotes the minimum carbon absorption. Types labeled as b, d, i, j, k, and l were identified by Takahama et al. (Citation2007). Dark blue rectangular regions on edges indicate fraction of image omitted by alignment.
2.3. STEM elemental composition for particles 0.1–0.5 and 0.5–1 µm diameter
STEM-EDS analysis was used to measure elements present in individual particles (Twohy et al. 2020). Because particles were collected on carbon-coated grids, the ability to measure carbon in particles in the 0.1–0.5 µm size range was limited. The three most abundant particle types for below and in-cloud particles in this size range were identified as sulfur-based, sodium-based sea spray, and sodium-based sea spray with enhanced sulfur (relative to unprocessed sea salt). The sulfur-based particles likely included sulfuric acid and/or ammonium bisulfate (Twohy et al. 2020), so they are sometimes called sulfate here for simplicity. The sodium-based were most likely indicators of the presence of NaCl and other sea salts. Other particle types accounted for less than 2% of particle number in each sample and were excluded from analysis. To obtain individual diameters of particles collected on STEM grids, particle 2-dimensional areas were calculated using a grayscale threshold of STEM micrographs with a modified version of the MATLAB Image Segmentation Tutorial. The 2 D areas were subsequently converted to a spherical-equivalent geometric diameter (see SI: Text S2, ). To account for particle spreading on grids, sulfate particle diameters were also decreased by 10% (Mcinnes, Covert, and Baker Citation1997). Size-resolved STEM composition is only available for particles sampled during RF11-15. All samples were taken in clear air at 150 m in the marine boundary except for 12-A, which was above cloud at 1760 m.
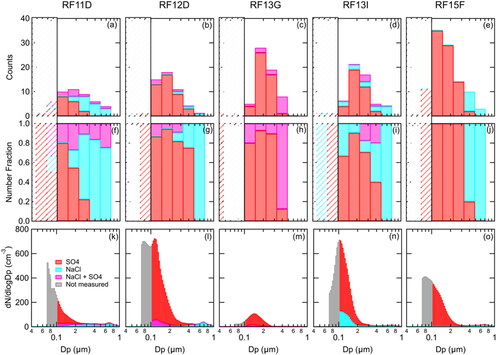
The STEM impactor collection efficiency decreases for particles <0.1 µm diameter size bin (). The smallest particle size measured by the UHSAS is 0.07 µm optical diameter. To account for the size dependent collection efficiency, the CVI particle numbers in were used to estimate the number fraction of each particle type in each bin shown (). The number fraction for each bin was then used to weight the UHSAS absolute number concentration. The bin size resolution was a factor of 10 lower than the UHSAS distribution because of the low number of particles analyzed in each sample. The number fraction distribution was scaled to the number concentrations in the UHSAS bins and then smoothed using a 20-bin running average to reduce discontinuity between size bins before being multiplied by the UHSAS concentrations. A few particles <0.1 µm diameter were observed but were not used to weight the UHSAS concentrations due to the low counting statistics.
Figure 6. (a–e) Low-level-leg STEM composition as a function of size, (d–f) low-level-leg STEM number fraction composition as a function of size, and (f–j) combined CN and UHSAS externally mixed particle size distributions from the STEM number fraction composition. STEM particles <0.1 µm diameter are crossed out in (a–j) and are shown as not measured (gray) in (k–o). Vertical lines represent critical diameter based on measured CDNC. The size bin resolution in (a–j) is a factor of 10 lower than (k–o) due to the low counting statistics.
2.4. Aerosol hygroscopicity and organic fraction of <0.15 µm diameter particles
CCN spectra measurements were performed every 5 min using a miniature continuous-flow stream-wise thermal gradient chamber in scanning mode (Roberts and Nenes Citation2005). The scanned supersaturations varied between 0.1% and 0.87%.
We used CCN spectra and number size distributions to estimate the hygroscopicity () of particles <0.15 µm diameter (limited by the minimum measured instrument supersaturation of 0.1% and the smallest measured particle size of 0.07 µm diameter) for 6 legs, as shown in . Specific legs were analyzed because concurrent UHSAS, CCN, and STEM composition measurements were available.
values are not reported whenever CCN concentrations were larger than UHSAS concentrations, which implies that during those periods the activation diameter was lower than the UHSAS detection limit (0.07 µm diameter). The uncertainty in
values was estimated using the one-standard error range of UHSAS size distributions and one-standard error range of CCN concentrations for each leg. If ±8% uncertainty is allowed for the difference between the UHSAS optical diameter calibrated by PSL and ambient particles consisting of NaCl or sulfate (Kupc et al. Citation2018), then the uncertainty of this calculation is ±24% uncertainty. The one-standard error for UHSAS size distributions during the leg was calculated using 1 Hz measurements. The one-standard error for CCN spectra was available for each 5-min scan. When multiple CCN spectra were available and averaged, the standard error of the average spectrum was obtained by error propagation. The error associated with retrieved
values is shown in (third column, blue shaded areas).
Figure 7. (First column) Leg-averaged cumulative concentration number retrieved from inverted size distributions from UHSAS and its one-standard error (solid black lines and error bars). (Second column) CCN spectra and their one-standard error shown as cyan lines and error bars. Also shown are CCN spectra calculated from UHSAS size distributions and assuming size-independent effective kappa values of 0.1 (dotted gray line), 0.5 (dashed and dotted line) and 1.0 (dashed line). If an intermediate effective kappa value better represented the measurements it is shown as a solid gray line with the kappa value noted. (Third column) Retrieved average (solid blue line) and range (blue shaded area) for the kappa estimated from UHSAS and CCN measurements () as a function of optical and geometric particle diameter. Also shown are the kappa values calculated from STEM elemental composition (
dashed black lines for the average and shaded gray area for the error). (Fourth column) Bulk average STEM composition for all particles sampled in each leg.
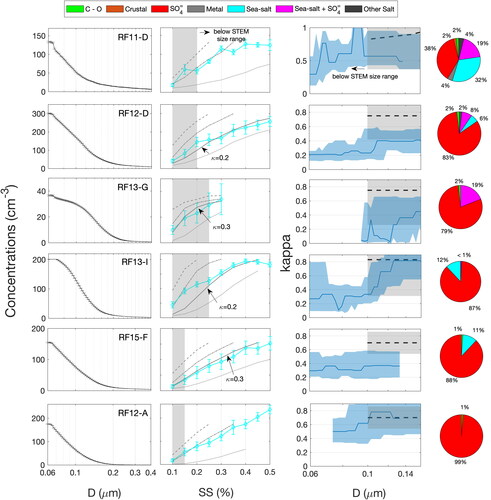
The hygroscopicity of particles >0.1 µm in diameter (lower cutoff size of STEM impactor) was also investigated from STEM size-resolved composition measurements ().
values were calculated assuming an internal mixture and size-dependent composition with assumed hygroscopicity of 0.7 for the sulfate particle type, 1.1 for the sodium-based sea spray particle type, and 0.9 for the sodium-based sea spray mixed with sulfate particle type (Zieger et al. Citation2017; Sullivan et al. Citation2010). Assuming an internal mixture (at each size bin) and size-dependent composition is consistent with the externally mixed composition obtained from STEM analysis because the sulfate and sea salt particle types were at different sizes ().
provides an upper bound for the true particle hygroscopicity since the carbonaceous components in small particles are not usually detectable above the background carbon substrate. The uncertainty for calculated
values was estimated by propagating counting error (counting statistics presented in ) and a ± 20% error in the OM fraction present on particles that could be missed by STEM.
The organic fraction of the submicron aerosol was investigated using calculated hygroscopicity parameters. CCN spectra were calculated from UHSAS size distribution and assuming STEM composition (base case, no organic component present) and artificially varying the fraction of organic components to best represent the measured CCN spectra. This approach assumes the particles at each size are internally mixed, and specifically that the inferred organic contributions were internally mixed with sulfate. Organic components mixed with sodium-based sea spray particles do not represent measured CCN spectra because of the low number concentrations of sodium-based sea spray particles measured in the size range with most of the CCN. Estimating the organic fraction of the aerosol particles using this approach was possible because of large differences in hygroscopicity parameter between sodium-based sea spray and sulfuric acid particles (kappa = 1.1 and 0.7, respectively) and organic components (kappa <0.1), (Petters and Kreidenweis Citation2007). One drawback of this approach is the short sampling times for each leg (<20 min) and the limited number of particles for each size range, which may not be sufficient to sample a representative aerosol population. The uncertainty of this approach is described by the counting statistics for each size bin, which is shown in .
2.5. Ice nucleating particles (INP) measurements
INP collections were made from the CFDC, the operating principles for which have been described by Rogers (Citation1988). INP concentrations from SOCRATES will be reported in a separate publication. The CFDC configurations flown on the G-V and used on the R/V Investigator were identical, and followed that described in McCluskey et al. (Citation2018). The diffusion chamber uses cylindrical geometry of higher and lower temperature ice-coated walls to produce controlled temperature and humidity for a sample air lamina (1.5 volumetric L min−1) centered in clean sheath flows. Air from the aircraft and ship inlets was initially dried by a set of three diffusion driers. Operating temperatures were controlled to facilitate measurements above limits of detection, which required temperatures of −27 to −31 °C for this study. CFDC RH in the chamber “growth” section was nominally controlled to 105% for both ship and aircraft campaigns to simulate immersion freezing conditions (Demott et al. Citation2015). Aerosol particles and activated ice crystals are measured by an optical particle counter at the CFDC outlet. An impactor holding a STEM grid or Si-Ni window was placed beneath the optical particle counter within a 4 µm aerodynamic cut size, single jet impactor. Aerosol particles larger than 2.4 µm aerodynamic diameter (50% cutoff) on the aircraft and 1.5 µm aerodynamic diameter (50% cutoff) on the R/V Investigator were removed before entering the CFDC inlet by two identical inertial impactors. To further assure that large aerosol particles were not mistaken for residues of ice crystals collected on the ice crystal impactor, particles larger than 1.5 µm dry spherical-equivalent geometric diameter were omitted from chemical analysis. There were very few particles observed in this size range.
3. Classification of organic composition by STXM-NEXAFS for particles 0.25–1.75 µm
From the LBL ALS STXM-NEXAFS results, 96 particles had spectra that met all quality checks described above, and the average organic particle spectra were clustered into 9 spectra categories. Six of the spectra categories are sufficiently similar to the categories presented by Takahama et al. (Citation2007) that they are considered to be the same category ( and ). One of the categories (Mcarb) was similar to those reported by Hawkins and Russell (Citation2010), identified with marine conditions in DYCOMSII and VOCALS-Rex, and another one (Macid) was similar to those reported by Laskin et al. (Citation2012) in CARES. Of the 96 classified particles, only 28 had a spherical geometry (). Spherical-equivalent geometric diameters for the different clusters are summarized in and given for individual particles in . The sampled particles had an average diameter of 0.86 µm with a 56% relative standard deviation.
Particles with Type b spectra had clear and strong absorption in the aromatic/alkene (R(C = C)R’) and the acid R(C = O)OH carbon regions, similar to Type b particles from Takahama et al. (Citation2007), (cosine similarity = 0.98, two common peaks, ). The strong aromatic absorption implies that these particles may be light-absorbing particles of combustion origin, possibly from regional ship traffic or fires in Australia. Type b spectra particles accounted for only two out of 96 particles reported and were sampled during RF08 and RF15. Particles with Type b spectra were irregular in shape and contained substantial organic mass, with little to no inorganic components (). The irregular shape of these particles could also be the result of coagulation or sintering of solid particles during combustion, although some deformation may result from impaction on Si3N4 windows.
Particles with Type d spectra (cosine similarity = 0.99, three common peaks with Type d particles identified by Takahama et al. (Citation2007), see ) accounted for 9 out of 96 particles reported. These particles showed strong absorption from aromatic/alkene bonds with additional broad absorption in the alkyl range after the carbonate peak. Type d particles were previously identified as potentially fresh, primary combustion particles (Braun Citation2005; Lehmann et al. Citation2005), possibly from regional ship traffic. This is further strengthened by the irregular shape of the carbon absorbance within the particle, which is suggestive of fractal-like black carbon particles (). Particles with Type d spectra were sampled during RF01 and RF12 − 14.
A single particle of Type i was identified because it had two absorbance peaks in common with that type (aromatic, carboxylic carbonyl and carbonate) and a cosine similarity of 0.99 to that type. STEM analysis revealed that this particle was a sodium-based sea spray particle.
Particles with Type j had clear absorption in the aromatic/alkene and carbonyl carboxylic regions in addition to absorption in the carbonate and potassium regions (cosine similarity = 0.97 to Type j identified by Takahama et al. (Citation2007)). Type j particles were identified as biomass burning particles because they included a mixture of aromatic and acid signatures (Takahama et al. Citation2007). These particles accounted for 10 out of 96 particles reported. The spectra for Type j particles were similar to Macid spectra but had higher absorption in the carbonyl region, which could be associated with fresh sea-spray particles (Pham et al. Citation2017; Hawkins and Russell Citation2010). Images for particles with Type j spectra show an organic component attached to the surface of a non-carbon core. None of these particles were analyzed with STEM. The presence of a clear absorption in the aromatic/alkene region is unusual for sodium-based sea spray particles but could be consistent with phenolic compounds found in sea surface microlayers (Gagosian Citation1983; Carlson and Mayer Citation1980; Hunter Citation1980) as well as with aromatic groups present in proteins such as phenylalanine and tryptophan. The presence of these organic compounds around a non-carbon core and the strong absorption from carbonyl carboxylic bonds could also indicate a mixture of multiple sources that could include combustion as well as sea spray. The presence of aromatic bonds could also be from ship fuel on the ocean surface that can be aerosolized during bubble bursting (Frossard et al. Citation2014). Particles with Type j spectra were sampled during RF08 and RF12-14.
Particles with Type k spectra had clear and strong absorption in the carbonyl carboxylic and potassium regions, similar to Type k particles identified by Takahama et al. (Citation2007) (cosine similarity = 0.95, four common peaks, ). These particles accounted for five out of 96 particles, were irregular in shape (), and were the largest particles (1.67 ± 0.65 µm). STEM analysis on three out of the five Type k particles revealed these were sodium-based fresh sea spray particles. These particles were sampled only during RF08 and RF12 − 14.
Particles with Type l spectra had a clear absorption peak in the aromatic/alkene region and a broad, amorphous absorption in the alkyl and carboxylic carbonyl regions. These particles were similar to type l identified by Takahama et al. (Citation2007) (cosine similarity = 0.99, three common peaks, ). Type l particles accounted for 12 out of 96 particles reported. Smaller but distinct peaks in the carbonyl and alkyl regions were also observed (). 11 out of 12 Type l particles were spherical in morphology (, ). Type l particles were also similar to the spherical organic-rich Type Polysaccharide II (PsII, cosine similarity = 0.99, 3 common peaks, ) identified by Hawkins and Russell (Citation2010) in the southeastern Pacific Ocean, suggesting a biogenic, sea spray, origin for these particles. However, these particles could have been influenced by combustion sources given the clear contribution from aromatics at 285 eV, which could indicate polycyclic aromatic hydrocarbons from combustion (Rogge et al. Citation1998). STEM analysis on four out of the 12 Type l particles collected revealed that three particles were organic particles and one particle was sodium-based sea spray with a large carbon ring ().
Particles with Type marine acid (Macid) spectra were the most numerous and accounted for 22 out of 96 of particles. These particles had carboxylic carbonyl (R(C = O)OH), carbonate (CO32-), and potassium peaks that were sometimes noisy and weak. Macid particles were mostly irregular in shape and showed higher carbon absorbance around the perimeter of a low-carbon core, consistent with the presence of an organic coating around a salt core (). These particles were not identified by Takahama et al. (Citation2007) or by Hawkins and Russell (Citation2010). Similar spectra were reported during the CARES study at Point Reyes, CA for aged sea salt particles (Laskin et al. Citation2012), but with different peak ratio, as shown in . Macid particles were sampled during flights RF8, 12 − 15 although the majority of particles was collected during RF12 − 15 for below-, in-, and above-cloud legs (). The peak in the carbonate region (the prevalent form of carbon in the oceans, (Hansell and Carlson Citation2014)) for these particles () provides further evidence of the sea spray nature of the Macid particles. Dust may also contain carbonate (Hawkins and Russell Citation2010; Maria et al. Citation2004; Russell, Maria, and Myneni Citation2002), and was found above clouds and in ice nucleating particles during SOCRATES (Twohy et al. 2020). The additional carboxylic carbonyl group in particles with Type Macid spectra are indicative of the presence of secondary (oxidized) OM that condensed on fresh sea spray particles. The presence of potassium peaks, though weak, supports a seawater source since biomass burning is possible but unlikely in this region. A limited number of particles with STXM-NEXAFS spectra (12 particles out of the 22 Macid particles) were also analyzed by STEM-EDS. Six particles analyzed were identified as sodium-containing sea spray particles, four were identified as metal particles with the presence of organic carbon, one was an organic particle attached to a sea salt crystal, and one was a sulfate particle (). These different components indicate that the Type Macid particles include a range of different primary particle sources to which acid groups were added by secondary processing (Frossard et al. Citation2014; Russell Citation2013). These sources include but are not limited to sea spray particles.
Particles with marine alkyl (Malk) Type spectra were similar to Type Macid but lacked a clear carboxylic acid group peak (usually associated with secondary processes), suggesting that Malk type spectra particles were primary sea spray that had not yet had acid groups added. These particles accounted for 21 out of 96 particles reported during the SOCRATES campaign and had low absorption in several regions, typically including aromatic/alkene, carbonyl, alkyl, carbonate, and potassium regions. These absorption peaks were small and often noisy, consistent with little organic mass on these particles. The low absorption signal meant that comparisons to other reference categories were not conclusive. Images of these particles revealed an organic coating around a salt core (), similar to Macid particles. STEM analysis was performed on 13 out of 21 Malk particles. All 13 particles were identified as sodium-based sea spray particles and some (four out of 13 particles) showed a substantial amount of carbon associated with them. Malk spectra particles were sampled during flights RF8 and RF12-15 with the majority of particles (19 out of 21) sampled during below- or in-clouds legs.
Particles with types labeled “Mcarb” in accounted for 14 out of 96 particles reported. These particles were not identified by Takahama et al. (Citation2007) but were similar to the calcareous phytoplankton type identified by Hawkins and Russell (Citation2010) (two common peaks). However, the distinct alkyl region absorption of the calcareous phytoplankton type was missing from sea salt particles collected during the SOCRATES campaign and calcareous phytoplankton particles did not show a sea salt core. Type Mcarb particles had sharp and strong absorption lines in the carbonate region with smaller absorption in the alkyl, carbonyl carboxylic, and potassium regions. The lack of other distinctive peaks in the carbon region suggests particles with too little organic mass for functional group identification. Given the location and back trajectories, the carbonate likely indicates sea spray particles, even though there was too little organic mass to identify other functional groups. These particles were sampled mostly during above-cloud legs (eight out of 14 particles, ). STEM analysis was performed on 10 out of 14 of these particles, and all 10 particles analyzed were identified as sea salt particles.
3.1. SOCRATES particle organic composition
Overall, 74 out of 96 of the classified particles that were analyzed by STXM-NEXAFS during SOCRATES were consistent with sea spray particles that contain organic functional groups. 5 different sea spray particles (Types k, l, Macid, Malk, and Mcarb) were identified based on differences in organic functional group signatures. Types k, Macid, Malk, and Mcarb are sodium-based sea spray particles (based on back trajectories, STXM-NEXAFS potassium measurements, and STEM-EDS sodium measurements). Type l (organic-rich particles with no inorganic core) likely have a marine origin because of their spectral similarity to Type PsII particles (although the PsII particles identified by Hawkins and Russell (Citation2010) lacked absorption in the aromatic/alkene region, ). The organic components for l and Macid Types showed clear absorption acid groups that were likely formed during secondary atmospheric processing of these aerosols. Furthermore, 84% of the sodium-based particles that were analyzed with STEM-EDS had a sodium core, supporting a marine origin for these particles. For comparison, Hawkins and Russell (Citation2010) identified a single sodium-based sea spray particle (Type PsI) and 3 sea spray particles with no sodium core. Here we report 3 new sodium-based sea spray particle Types (Macid, Malk, and Mcarb) that were not previously identified in any ocean regions. These results indicate that sodium-based sea spray aerosol accounted for the majority of >0.25 µm diameter particles analyzed by STXM for carbon, as expected in the MBL (Saliba et al. Citation2019, Citation2020; Sanchez et al. Citation2018; Ovadnevaite et al. Citation2014; Hara, Osada, and Yamanouchi Citation2013; Bates et al. Citation2012; Hawkins et al. Citation2010; Russell et al. Citation2010; Murphy et al. Citation1998).
3.2. Vertical differences in particle organic composition
For the aerosol particle sampling, there were 21 particles analyzed from below-cloud samples, 19 from in-cloud samples, and 23 from above-cloud samples. The average spectra of particles sampled below-cloud, in-cloud, and above-cloud were similar (cosine similarity >0.95) with pronounced peaks in the carboxylic and carbonate regions indicative of aged sodium-based sea spray particles. A one-way ANOVA test revealed no statistical differences in the relative intensities for the different OM functional groups (p = 0.09 for carbonate region and p > 0.6 for the other OM functional groups). Additional measurements could improve the sampling statistics to reveal more subtle differences in the particles at each level. The carbonyl and carboxylic groups contents (both indicators of particle oxidation) of the particles sampled below-cloud and in-cloud were comparable. In contrast, particles sampled above-cloud had larger contribution to absorption from aromatics (six out of nine Type d particles were sampled during above-clouds legs) and carbonate groups, which could indicate long range transport of combustion and dust particles in the free troposphere.
3.3. Ice nucleating particles (INP)
20 out of 33 INPs sampled following activation in the CSU continuous flow diffusion chamber (processed via immersion freezing at −27 to −31 °C) during the SOCRATES campaign exhibited spectra with significant contributions from the carbonate and potassium regions (typical of sodium-based sea spray particles). This result is consistent with expectations that INPs emanate from marine organic mass emissions in sea spray over the SO (McCluskey et al. Citation2018; Vergara-Temprado et al. Citation2017).
11 out of 20 INPs collected during the SOCRATES campaign were spherical, organic-rich particles (Type l spectra, , ). Organic-rich particles (with no sea salt attached to them) were previously identified in the Southern Pacific (Type PsII). However, an influence of combustion emissions for these particles cannot be ruled out due to clear absorption in the aromatic/alkene region ().
Two out of 32 INPs sampled over the SO (Type b, ) were likely fresh or aged combustion particles that may also contain BC. This indicates that nearby ship emissions or transported pollution play a minor role on the INP budget over the SO, consistent with the prior findings for INP warmer than −30 °C (McCluskey et al. Citation2018).
4. Classification of inorganic composition by STEM
>0.1 µm diameter impactor samples from below cloud and in-cloud behind a CVI were collected to identify MBL particle and cloud droplet residual particle composition respectively using STEM analysis (, ) for four flights (RF11-13 and 15). The number of particles counted in each size bin varied between 1 and 35 (for 10 logarithmically spaced bins between 0.1 and 0.5 µm diameter, ). Sulfate particles accounted for >80% of the particle number <0.15 µm dry geometric diameter for RF11D, RF12D, RF13G, and RF15F but around 60% of the <0.15 µm diameter particles for RF13I. The number fraction of sea spray particles increased from <10% for particles <0.2 µm to >90% for particles >0.4 µm diameter, consistent with sodium-based sea spray particles found at larger sizes (Saliba et al. Citation2019; de Leeuw et al. Citation2011; Lewis and Schwartz Citation2004; Murphy et al. Citation1998). Sea spray particles mixed with sulfate components were also identified but generally accounted for <20% of the particles counted and sized. Similar particle composition was observed in the SO MBL (Middlebrook, Murphy, and Thomson Citation1998; Murphy et al. Citation1998; Bigg, Gras, and Evans Citation1984) and over Antarctica during periods of time influenced by continental (Antarctica), as well as in SO air masses (Budhavant, Safai, and Rao Citation2015; Hara, Osada, and Yamanouchi Citation2013; Asmi et al. Citation2010). Additional SOCRATES results from STEM analysis are given in Twohy et al. (2020).
Table 2. STEM composition of below cloud particles and in-cloud droplets for three flights. Colors correspond to legend.
shows the STEM composition and the STEM-weighted UHSAS composition for particles greater than 0.1 µm diameter. There are only subtle differences between them, suggesting that the size dependent collection efficiency did not affect the measured composition significantly. Here, the sodium-based sea spray number fraction is comparable to previous marine number fractions recorded in the North Atlantic MBL during late spring (Sanchez et al. Citation2018).
also shows that the in-cloud droplet residual composition for RF12 and RF13 had a significantly higher fraction of sodium-based sea spray relative to the below cloud particles. A UHSAS behind the CVI revealed that cloud droplet residual concentrations >0.1 µm diameter were much lower than the observed cloud drop number concentration (CDNC), indicating the raw STEM measurements were missing some cloud residuals and therefore, biased low. The heating by the CVI may have caused some non-refractory particles to evaporate to sizes smaller than the >0.1 µm diameter impactor cutoff, or some cloud droplets may have been below the CVI cut size of 7–8 µm diameter. To account for this bias, the difference between the CDNC and UHSAS >0.1 µm diameter particle concentration was assumed to be from non-refractory sulfate particles. This significantly increased the number fraction of sulfate particles in the cloud residuals ().
With the below cloud UHSAS distribution and observed CDNC, the critical diameter was determined as the size at which the below cloud cumulative UHSAS concentration is the same as the CDNC. The average critical diameters for all the RF11, RF12 and RF13 cases are 0.071 µm (range = 0.070–0.107 µm), 0.098 µm (range = 0.070–0.112 µm) and 0.096 µm (range = 0.071–0.109 µm), respectively. The critical diameters are all less than the impactor 0.1 µm cutoff diameter, indicating that in some cases, particles are too small to be collected on the impactor also activated to form cloud droplets. Using and the observed CDNC, an estimated cloud droplet residual composition was determined by integrating the particle number distribution above the critical diameter and is shown in . For all three cases, a portion of the activated particle composition is unknown, since the composition for particles below 0.1 µm diameter was not measured. It is likely that a significant fraction of the particles that were not measured are sulfate particles that have grown to CCN sizes, based on trends in the STEM analysis. The sea salt number fraction for the RF13 corrected in-cloud STEM residuals and estimated cloud droplet residual composition () are similar, indicating almost all of the particles in the CCN-size range are sulfate. Sanchez et al. (2020) have reported that sea spray particles constitute less than 20% of CCN number concentrations (at 0.3% supersaturation) and cloud droplet number concentrations in summertime over the Southern Ocean. The RF12 critical diameter is 0.098 µm and close to the 0.1 µm impactor cutoff, which is why the corrected in-cloud STEM residual composition and estimated residual composition are similar.
5. Organic fraction of particles <0.15 µm diameter retrieved from hygroscopicity measurements
The organic fraction of the particles <0.15 µm diameter sampled in the SO was investigated by constraining the aerosol composition using CCN spectra and particle number size distributions measurements from the UHSAS. Since 78 out of 96 particles analyzed with STXM-NEXAFS were larger than 0.5 µm diameter and only 2 out of 96 particles analyzed were <0.2 µm diameter, they are not representative of the majority of CCN. Moreover, the organic contribution to supermicron particles is not the same as the organic contribution to the submicron aerosol because the two size ranges have different sources and different growth rates (Betha et al. Citation2017; Maria et al. Citation2004). The elemental composition obtained from STEM analysis is representative of particles >0.1 µm diameter because smaller particles were not collected by the STEM impactor. It is also possible that some fraction of the organic components in the 0.1–0.15 µm diameter range were not identified by STEM analysis because these organic components volatilized during sampling (Frossard et al. Citation2014; Middlebrook, Murphy, and Thomson Citation1998).
The results presented in show trends for versus particle (optical and geometric) diameter for the different legs.
generally increased with particle size from ∼0.2–0.3 to ∼0.5–0.8. In contrast,
was nearly size-independent for leg RF15F. Differences in the size-dependence of
in MBL legs can be explained by air mass origin and evolution during transport. During RF12D, RF13G and RF13I, processes that drive condensation of the organic components on particles <0.15 µm diameter may be products from the oxidation of marine biogenic VOCs. This hypothesis is consistent with back trajectories calculated for RF12 and RF13 which passed over the Antarctic coast within the five-day back trajectory prior to sampling (). Antarctica’s biologically rich continental shelf is a known source of marine biogenic VOCs (e.g., DMS) during summer (Moore and Abbott Citation2000; Liu et al. Citation2018). These VOCs are oxidized to produce lower volatility products that subsequently condense on existing particles (Jung et al. Citation2020; Minikin et al. Citation1998). A higher contribution from secondary organic aerosol was also reported by Decesari et al. (Citation2020) and Rinaldi et al. (Citation2020) for the air masses originating above sympagic waters compared to pelagic waters near the Antarctic peninsula. For RF11D and RF15F, back trajectories show air masses that spent 5 days over the SO on a (nearly) constant latitude trajectory at around 60oS (). This latitude is where the maximum frequency of storm tracks occurs (Hoskins and Hodges Citation2005) and includes persistent cloud processing (and scavenging) of CCN-sized particles.
The moderately low values for particles <0.15 µm diameter are consistent with the presence of organic components on these particles. This result suggests a decreasing organic fraction with increasing particle size (and lower supersaturation) and that condensation of SOA (likely MSA) and surface reactions are potentially the source of the <0.15 µm organic components (Betha et al. Citation2018; Zhao et al. Citation2015), although a free tropospheric source for these organic components cannot be ruled out (Quinn et al. Citation2019). The moderately low aerosol hygroscopicity inferred for particles <0.15 µm diameter is consistent with previous observations. Kim et al. (Citation2017) found an annual averaged hygroscopicity of 0.15 ± 0.05 at the King Sejong Station, Antarctica, for <0.3 µm diameter particles and Lathem et al. (Citation2013) reported a mean hygroscopicity of 0.32 ± 0.23 (at 0.55% supersaturation) for particles sampled during Arctic background periods. The sharp increase in
for RF12D and RF13I at ∼0.1 µm dry diameter is consistent with population of larger (cloud processed) sulfate particles and smaller (fresh) organic-rich particles (, third column).
Retrieved were within the uncertainty of
for RF11D, RF13G, RF13I, and RF12A () for 0.1–0.15 µm diameter particles. This indicates that likely <20% organic components were present on particles in the 0.1–0.15 µm size range (overlapping range between STEM and CCN measurements). In contrast,
(calculated from STEM composition) was clearly larger than
for RF12D, and RF15F for particles in the 0.1–0.15 µm size range. The effective kappa that best represented the measured CCN spectra for RF12D and RF15F at supersaturation <0.2% (calculated from STEM lower size limit and
) was between 0.2 and 0.3 (, second column). This difference in kappa values suggests large amounts of organic components that were not detected by STEM analysis, potentially due to low counting statistics (<30 particles were used to estimate
).
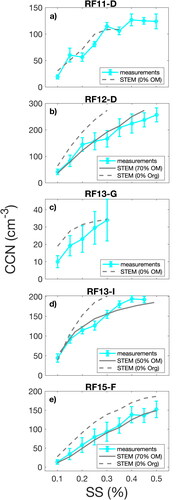
An upper limit for the organic number fraction of particles <0.15 µm diameter sampled during SOCRATES was estimated using the STEM and systematically varying the organic fraction (between 0 and 100%). STEM composition was extrapolated to particles <0.1 µm (high supersaturations) to calculate CCN concentrations at supersaturations that activate particles below the size range of the STEM. The organic fractions inferred from the measured CCN spectra and size distributions are not consistent with the low organic fraction measured for STEM samples for particles in the 0.1–0.15 µm diameter range () given the respective uncertainties. The comparison of measured and calculated CCN concentrations is shown in for 5 legs (RF11D, RF12D, RF13I, RF13G, and RF15F). For RF11D and RF13G, measured and calculated CCN spectra compared well without adding organic components to the sulfate particles, suggesting an aerosol composed of sulfuric acid and sulfuric acid partly neutralized by ammonia (Adams, Seinfeld, and Koch Citation1999; O’Dowd et al. Citation1997) and some sea-spray components. Similar results were reported by Asmi et al. (Citation2010) over Antarctica for particles smaller than 0.1 µm diameter. The good agreement between measured and calculated CCN spectra using no added organic components suggests that the STEM composition for the 0.1–0.15 µm diameter range was representative of the entire <0.15 µm diameter range. In contrast, inferred organic contributions of 50% (RF13I) and 70% (RF12D and RF15F) on the sulfate particles were required to represent observed CCN spectra at the measured supersaturations.
Figure 8. Comparison of measured (solid cyan lines) and calculated (dashed and solid gray lines) CCN concentrations versus supersaturation for legs with size-resolved STEM composition (). CCN measurements are shown as solid blue lines with error bars. Dashed gray lines represent CCN calculation using STEM composition and extrapolating the STEM composition to particles <0.1 µm diameter (high supersaturations). Solid gray lines represent CCN calculations using STEM composition with added fractions of organics on the sulfate mode to achieve best agreement with measurements.
Despite the large and variable volume fractions of the organic components (between <10–70%) of particles <0.15 µm (optical or geometric) diameter, we estimated that the mass concentrations for these <0.15 µm diameter organic components were 0.1 µg/m3 for RF12D, 0.06 µg/m3 for RF13I, and 0.06 µg/m3 for RF15D. This range of inferred OM concentrations for <0.15 µm diameter particles during the SOCRATES campaign is in agreement with the annual range of submicron FTIR OM measured in Antarctica (0.04–0.27 µg/m3) (Liu et al. Citation2018), and is consistent with the low NR-Org concentrations observed during the project (Twohy et al. Citation2020).
6. Conclusions
Few observations of the size-dependent organic composition of aerosol particles in the Southern Ocean (SO) MBL have been reported. Here concurrent chemical and physical aerosol measurements were used to characterize the organic composition and fraction that span a wide range of aerosol particle sizes (0.07–1.75 µm) sampled in the summertime SO MBL as part of SOCRATES. STXM-NEXAFS was used to measure the organic composition of particles between 0.25–1.75 µm diameter which are relevant for direct radiative impacts. STEM analysis was used to measure the elemental composition for 0.1–0.5 µm and 0.5–1 µm diameter particles, noting that 0.1–0.5 µm diameter particles often provide the majority of CCN at supersaturations <0.3%. CCN and size distribution measurements were used to estimate the hygroscopicity and infer the organic fraction of particles <0.15 µm diameter which are relevant for CCN budgets at >0.3% supersaturation. By investigating the organic fraction of <0.15 µm diameter particles, this study provides a more complete assessment of organic composition compared to other study that have focused on STXM only.
The analysis of particle samples using STXM-NEXAFS revealed that the majority of the 0.25–1.75 µm diameter particles collected (74 out of 96 particles) during SOCRATES were consistent with sea spray particles with some organic component around a sea salt core. 5 different sea spray Types (k, l, Macid, Malk, Mcarb) were identified, 3 of which (Macid, Malk, Mcarb) were not previously identified. The organic component sometimes included carboxylic acid groups that were likely secondary, indicating a contribution of “aging” to the sea spray. These particles were characterized by absorption in the alkyl, carbonyl, carboxylic carbonyl, carbonate, and potassium regions. STEM analysis of a subset of the particles analyzed with STXM-NEXAFS confirmed the sea spray origin for the majority of the particles between 0.25 and 1.75 µm diameter sampled over the SO. Ice nucleating particles sampled by immersion freezing <-27 °C were also largely consistent with sea salt and sea spray organic functional groups, although two of 33 particles were consistent with long-range transport of particles from continental sources.
The organic composition of particles smaller than 0.1 µm diameter could not be investigated with STXM-NEXAFS or STEM-EDS due to limitations in collection and analysis. These <0.1 µm diameter particles could be important for CCN budget in the SO MBL depending on their composition and critical supersaturations. For that purpose, we used measured CCN spectra and size distributions to estimate the particle hygroscopicity and the organic fraction of particles <0.15 µm diameter. The effective hygroscopicity of particles between 0.1 and 0.15 µm diameter (supersaturation <∼0.2%) was generally within the uncertainty of the hygroscopicity obtained from STEM composition and consistent with sulfuric acid and sea spray particles. The hygroscopicity of particles <0.10 µm diameter (supersaturation > ∼0.2%), which were not measured by the STEM analysis, varied between 0.2 and 0.5, corresponding to 0%–70% of the volume being organic components for sizes that are relevant to CCN concentrations over the SO. The large variability in the organic composition of particles <0.15 µm diameter likely implies significant differences in CCN concentrations at typical supersaturations for the SO.
The calculated OM volume contributions of <10% and up to 70% for particles smaller than 0.15 µm diameter were consistent with the observed CCN spectra. The high organic fraction of the <0.15 µm diameter particles accounted for OM concentrations of <0.1 µg/m3. The large organic fraction of particles <0.1 µm diameter may have important implications for CCN number concentrations and indirect radiative forcing over the SO, a climatically important region.
uast_a_1845296_sm5694.pdf
Download PDF (408.9 KB)Acknowledgments
This research was funded by NSF AGS-1660509, AGS-1660486, AGS-1660605, and AGS-1660374. We thank the Commonwealth Scientific and industrial Research Organization Marine National Facility for its support in the form of sea time on the R/V Investigator.
Data availability
SOCRATES data are available through the following EOL UCAR repository https://data.eol.ucar.edu/master_lists/generated/socrates/(UCAR/NCAR-Earth Observing Laboratory, 2019 for UHSAS and CDP data and K. Sanchez & Roberts, 2018 (https://data.eol.ucar.edu/dataset/552.013); UCAR/NCAR-Earth Observing Laboratory, 2018) for CCN measurements. STXM-NEXAFS particle spectra are archived at the UCSD Digital Collections (accessible at https://doi.org/10.6075/J09C6VZ6) and the NCAR Data Repository. (To be added after acceptance.)
References
- Adams, P. J., J. H. Seinfeld, and D. M. Koch. 1999. Global concentrations of tropospheric sulfate, nitrate, and ammonium aerosol simulated in a general circulation model. J. Geophys. Res. 104 (D11):13791–823.
- Andreae, M. O., W. Elbert, Y. Cai, T. W. Andreae, and J. Gras. 1999. Non-sea-salt sulfate, methanesulfonate, and nitrate aerosol concentrations and size distributions at Cape Grim, Tasmania. J. Geophys. Res. 104 (D17):21695–706.
- Andreae, M. O., and D. Rosenfeld. 2008. Aerosol-cloud-precipitation interactions. Part 1. The nature and sources of cloud-active aerosols. Earth-Sci. Rev. 89 (1-2):13–41. doi:https://doi.org/10.1016/j.earscirev.2008.03.001.
- Asmi, E., A. Frey, A. Virkkula, M. Ehn, H. E. Manninen, H. Timonen, O. Tolonen-Kivimäki, M. Aurela, R. Hillamo, and M. Kulmala. 2010. Hygroscopicity and chemical composition of antarctic sub-micrometre aerosol particles and observations of new particle formation. Atmos. Chem. Phys. 10 (9):4253–71.
- Ayers, G. P., and R. W. Gillett. 2000. DMS and its oxidation products in the remote marine atmosphere: Implications for climate and atmospheric chemistry. J. Sea Res. 43 (3-4):275–86.
- Ayers, G. P., and J. L. Gras. 1991. Seasonal relationship between cloud condensation nuclei and aerosol methanesulphonate in marine air. Nature 353 (6347):834–5. doi:https://doi.org/10.1038/353834a0.
- Bates, T. S., P. K. Quinn, A. A. Frossard, L. M. Russell, J. Hakala, T. Petäjä, M. Kulmala, D. S. Covert, C. D. Cappa, S. M. Li, et al. 2012. Measurements of ocean derived aerosol off the coast of California. J. Geophys. Res. 117:D00V15. doi:https://doi.org/10.1029/2012JD017588.
- Betha, R., L. M. Russell, C. L. Chen, J. Liu, D. J. Price, K. J. Sanchez, S. Chen, A. K. Y. Lee, S. C. Collier, Q. Zhang, et al. 2018. Larger submicron particles for emissions with residential burning in wintertime San Joaquin Valley (Fresno) than for vehicle combustion in summertime South Coast Air Basin (Fontana). J. Geophys. Res. Atmos. 123 (18):10–526.
- Betha, R., L. M. Russell, K. J. Sanchez, J. Liu, D. J. Price, M. A. Lamjiri, C. L. Chen, X. M. Kuang, G. O. da Rocha, S. E. Paulson, et al. 2017. Lower NOx but higher particle and black carbon emissions from renewable diesel compared to ultra low sulfur diesel in at-sea operations of a research vessel. Aerosol Sci. Technol. 51 (2):123–34.
- Bigg, E. K. 2007. Sources, nature and influence on climate of marine airborne particles. Environ. Chem. 4 (3):155–61.
- Bigg, E. K., J. L. Gras, and C. Evans. 1984. Origin of Aitken particles in remote regions of the Southern Hemisphere. J. Atmos. Chem. 1 (2):203–14.
- Braun, A. 2005. Carbon speciation in airborne particulate matter with C (1s) NEXAFS spectroscopy. J. Environ. Monit. 7 (11):1059–65. doi:https://doi.org/10.1039/b508910g.
- Budhavant, K., P. D. Safai, and P. S. P. Rao. 2015. Sources and elemental composition of summer aerosols in the Larsemann Hills (Antarctica). Environ. Sci. Pollut. Res. Int. 22 (3):2041–50. doi:https://doi.org/10.1007/s11356-014-3452-0.
- Carlson, D. J., and L. M. Mayer. 1980. Enrichment of dissolved phenolic material in the surface microlayer of coastal waters. Nature 286 (5772):482–3. doi:https://doi.org/10.1038/286482a0.
- de Leeuw, G., E. L. Andreas, M. D. Anguelova, C. W. Fairall, E. R. Lewis, C. O'Dowd, M. Schulz, and S. E. Schwartz. 2011. Production flux of sea spray aerosol. Rev. Geophys. 49, RG2001. doi:https://doi.org/10.1029/2010RG000349
- Decesari, S., M. Paglione, M. Rinaldi, M. Dall'Osto, R. Simó, N. Zanca, F. Volpi, M. C. Facchini, T. Hoffmann, S. Götz, et al. 2020. Shipborne measurements of Antarctic submicron organic aerosols: An NMR perspective linking multiple sources and bioregions. Atmos. Chem. Phys. 20 (7):4193–207. doi:https://doi.org/10.5194/acp-20-4193-2020.
- Demott, P. J., A. J. Prenni, G. R. McMeeking, R. C. Sullivan, M. D. Petters, Y. Tobo, M. Niemand, O. Möhler, J. R. Snider, Z. Wang, et al. 2015. Integrating laboratory and field data to quantify the immersion freezing ice nucleation activity of mineral dust particles. Atmos. Chem. Phys. 15 (1):393–409. doi:https://doi.org/10.5194/acp-15-393-2015.
- Draxler, R. R., and G. D. Rolph. 2003. HYSPLIT (HYbrid Single-Particle Lagrangian Integrated Trajectory) model access via NOAA ARL READY website (http://ready. arl. noaa. gov/HYSPLIT.php). Silver Spring, MD: NOAA Air Resources Laboratory, 25.
- Fossum, K. N., J. Ovadnevaite, D. Ceburnis, M. Dall’Osto, S. Marullo, M. Bellacicco, R. Simó, D. Liu, M. Flynn, A. Zuend, et al. 2018. Summertime primary and secondary contributions to Southern Ocean cloud condensation nuclei. Sci. Rep. 8 (1):1–14.
- Frossard, A. A., L. M. Russell, S. M. Burrows, S. M. Elliott, T. S. Bates, and P. K. Quinn. 2014. Sources and composition of submicron organic mass in marine aerosol particles. J. Geophys. Res. Atmos. 119 (22):12-977.
- Gabric, A. J., P. H. Whetton, and R. Cropp. 2001. Dimythylsulphide production in the subantarctic southern ocean under enhanced greenhouse conditions. Tellus Ser. B Chem. Phys. Meteorol. 53 (3):273–87.
- Gagosian, R. B. 1983. Review of marine organic geochemistry. Rev. Geophys. 21 (5):1245–58.
- Gras, J. L., and G. P. Ayers. 1983. Marine aerosol at southern mid-latitudes. J. Geophys. Res. 88 (C15):10661–6.
- Hansell, D. A., and C. A. Carlson. 2014. Biogeochemistry of marine dissolved organic matter. 2nd ed. San Diego, CA: Academic Press.
- Hara, K., K. Osada, and T. Yamanouchi. 2013. Tethered balloon-borne aerosol measurements: Seasonal and vertical variations of aerosol constituents over Syowa Station, Antarctica. Atmos. Chem. Phys. 13 (17):9119–39. doi:https://doi.org/10.5194/acp-13-9119-2013.
- Hawkins, L. N., and L. M. Russell. 2010. Polysaccharides, proteins, and phytoplankton fragments: Four chemically distinct types of marine primary organic aerosol classified by single particle spectromicroscopy. Adv. Meteorol. 2010:1–14. doi:https://doi.org/10.1155/2010/612132.
- Hawkins, L. N., L. M. Russell, D. S. Covert, P. K. Quinn, and T. S. Bates. 2010. Carboxylic acids, sulfates, and organosulfates in processed continental organic aerosol over the southeast Pacific Ocean during VOCALS-REx 2008. J. Geophys. Res. 115: D13201. doi:https://doi.org/10.1029/2009JD013276.
- Hoskins, B. J., and K. I. Hodges. 2005. A new perspective on Southern Hemisphere storm tracks. J. Clim. 18 (20):4108–29.
- Hunter, K. A. 1980. Microelectrophoretic properties of natural surface‐active organic matter in coastal seawater. Limnol. Oceanogr. 25 (5):807–22.
- IPCC. 2013. Climate change 2013: The physical science basis. Contribution of Working Group I to the Fifth Assessment Report of the Intergovernmental Panel on Climate Change. ed. D Stocker, Qin, G.-K. Plattner, M. Tignor, S. K. Allen, J. Boschung, A. Nauels, Y. Xia, V. Bex, and P. M. Midgley. Cambridge, UK; New York, NY: Cambridge University Press, pp. 1535.
- Jung, J., S.-B. Hong, M. Chen, J. Hur, L. Jiao, Y. Lee, K. Park, D. Hahm, J.-O. Choi, E. J. Yang, et al. 2020. Characteristics of methanesulfonic acid, non-sea-salt sulfate and organic carbon aerosols over the Amundsen Sea, Antarctica. Atmos. Chem. Phys. 20 (9):5405–24. doi:https://doi.org/10.5194/acp-20-5405-2020.
- Kawamura, K., R. Seméré, Y. Imai, Y. Fujii, and M. Hayashi. 1996. Water soluble dicarboxylic acids and related compounds in Antarctic aerosols. J. Geophys. Res. 101 (D13):18721–8.
- Kim, J., Y. Jun Yoon, Y. Gim, H. Jin Kang, J. Hee Choi, K. T. Park, and B. Yong Lee. 2017. Seasonal variations in physical characteristics of aerosol particles at the King Sejong Station, Antarctic Peninsula. Atmos. Chem. Phys. 17 (21):12985–99. doi:https://doi.org/10.5194/acp-17-12985-2017.
- Korhonen, H., K. S. Carslaw, D. V. Spracklen, G. W. Mann, and M. T. Woodhouse. 2008. Influence of oceanic dimethyl sulfide emissions on cloud condensation nuclei concentrations and seasonality over the remote Southern Hemisphere oceans: A global model study. J. Geophys. Res. 113:D15204. doi:https://doi.org/10.1029/2007JD009718.
- Krüger, O., and H. Graßl. 2011. Southern Ocean phytoplankton increases cloud albedo and reduces precipitation. Geophys. Res. Lett. 38:L08809. doi:https://doi.org/10.1029/2011GL047116.
- Kupc, A., C. Williamson, N. L. Wagner, M. Richardson, and C. A. Brock. 2018. Modification, calibration, and performance of the ultra-high sensitivity aerosol spectrometer for particle size distribution and volatility measurements during the Atmospheric Tomography Mission (ATom) airborne campaign. Atmos. Meas. Tech. 11 (1):369–83. doi:https://doi.org/10.5194/amt-11-369-2018.
- Laskin, A., R. C. Moffet, M. K. Gilles, J. D. Fast, R. A. Zaveri, B. Wang, P. Nigge, and J. Shutthanandan. 2012. Tropospheric chemistry of internally mixed sea salt and organic particles: Surprising reactivity of NaCl with weak organic acids. J. Geophys. Res. 117:D15302. doi:https://doi.org/10.1029/2012JD017743.
- Lathem, T. L., A. J. Beyersdorf, K. L. Thornhill, E. L. Winstead, M. J. Cubison, A. Hecobian, J. L. Jimenez, R. J. Weber, B. E. Anderson, and A. Nenes. 2013. Analysis of CCN activity of Arctic aerosol and Canadian biomass burning during summer 2008. Atmos. Chem. Phys. 13 (5):2735–56. doi:https://doi.org/10.5194/acp-13-2735-2013.
- Leck, C., and E. K. Bigg. 2008. Comparison of sources and nature of the tropical aerosol with the summer high Arctic aerosol. Tellus Ser. B Chem. Phys. Meteorol. 60 (1):118–26. doi:https://doi.org/10.1111/j.1600-0889.2007.00315.x.
- Lehmann, J., B. Liang, D. Solomon, M. Lerotic, F. Luizão, J. Kinyangi, T. Schäfer, S. Wirick, and C. Jacobsen. 2005. Near-edge X-ray absorption fine structure (NEXAFS) spectroscopy for mapping nano-scale distribution of organic carbon forms in soil: Application to black carbon particles. Global Biogeochem. Cycles 19:GB1013. doi:https://doi.org/10.1029/2004GB002435.
- Lewis, E. R., and S. E. Schwartz. 2004. Sea salt aerosol production: Mechanisms, methods, measurements and models—A critical review. Geophysical monograph series, vol. 152, 413. Washington, DC: AGU.
- Liu, J., J. Dedrick, L. M. Russell, G. I. Senum, J. Uin, C. Kuang, S. R. Springston, W. Richard Leaitch, A. C. Aiken, and D. Lubin. 2018. High summertime aerosol organic functional group concentrations from marine and seabird sources at Ross Island, Antarctica, during AWARE. Atmos. Chem. Phys. 18 (12):8571–87. doi:https://doi.org/10.5194/acp-18-8571-2018.
- Maria, S. F., L. M. Russell, M. K. Gilles, and S. C. B. Myneni. 2004. Organic aerosol growth mechanisms and their climate-forcing implications. Science 306 (5703):1921–4. doi:https://doi.org/10.1126/science.1103491.
- McCluskey, C. S., T. C. J. Hill, R. S. Humphries, A. M. Rauker, S. Moreau, P. G. Strutton, S. D. Chambers, A. G. Williams, I. McRobert, J. Ward, et al. 2018. Observations of ice nucleating particles over Southern Ocean waters. Geophys. Res. Lett. 45 (21):11,989–997. doi:https://doi.org/10.1029/2018GL079981.
- McCoy, D. T., S. M. Burrows, R. Wood, D. P. Grosvenor, S. M. Elliott, P. L. Ma, P. J. Rasch, and D. L. Hartmann. 2015. Natural aerosols explain seasonal and spatial patterns of Southern Ocean cloud albedo. Sci. Adv. 1 (6):e1500157. doi:https://doi.org/10.1126/sciadv.1500157.
- McFarquhar, G. M., C. Bretherton, R. Marchand, A. Protat, P. J. DeMott, S. P. Alexander, G. C. Roberts, C. H. Twohy, D. Toohey, S. Siems, et al. 2020. Observations of clouds, aerosols, precipitation, and surface radiation over the Southern Ocean: An overview of CAPRICORN, MARCUS, MICRE and SOCRATES. Bulletin of the American Meteorological Society.
- Mcinnes, L., D. Covert, and B. Baker. 1997. The number of sea-salt, sulfate, and carbonaceous particles in the marine atmosphere. Tellus B Chem. Phys. Meteorol. 49 (3):300–13. doi:https://doi.org/10.3402/tellusb.v49i3.15969.
- Meskhidze, N., and A. Nenes. 2006. Phytoplankton and cloudiness in the southern ocean. Science 314 (5804):1419–23. doi:https://doi.org/10.1126/science.1131779.
- Middlebrook, A. M., D. M. Murphy, and D. S. Thomson. 1998. Observations of organic material in individual marine particles at Cape Grim during the First Aerosol Characterization Experiment (ACE 1). J. Geophys. Res. 103 (D13):16475–83. doi:https://doi.org/10.1029/97JD03719.
- Minikin, A., M. Legrand, J. Hall, D. Wagenbach, C. Kleefeld, E. Wolff, E. C. Pasteur, and F. Ducroz. 1998. Sulfur-containing species (sulfate and methanesulfonate) in coastal Antarctic aerosol and precipitation. J. Geophys. Res. 103 (D9):10975–90. doi:https://doi.org/10.1029/98jd00249.
- Moore, J. K., and M. R. Abbott. 2000. Phytoplankton chlorophyll distributions and primary production in the Southern Ocean. J. Geophys. Res. 105 (C12):28709–22. doi:https://doi.org/10.1029/1999jc000043.
- Murphy, D. M., J. R. Anderson, P. K. Quinn, L. M. McInnes, F. J. Brechtel, S. M. Kreidenweis, A. M. Middlebrook, M. Pósfai, D. S. Thomson, and P. R. Buseck. 1998. Influence of sea-salt on aerosol radiative properties in the Southern Ocean marine boundary layer. Nature 392 (6671):62–5. doi:https://doi.org/10.1038/32138.
- Noone, K. J., J. A. Ogren, J. Heintzenberg, R. J. Charlson, and D. S. Covert. 1988. Design and calibration of a counterflow virtual impactor for sampling of atmospheric fog and cloud droplets. Aerosol Sci. Technol. 8 (3):235–44. doi:https://doi.org/10.1080/02786828808959186.
- O’Dowd, C. D., J. A. Lowe, M. H. Smith, B. Davison, C. N. Hewitt, and R. M. Harrison. 1997. Biogenic sulphur emissions and inferred non‐sea‐salt‐sulphate cloud condensation nuclei in and around Antarctica. J. Geophys. Res. 102 (D11):12839–54.
- Ovadnevaite, J., D. Ceburnis, S. Leinert, M. Dall'Osto, M. Canagaratna, S. O'Doherty, H. Berresheim, and C. O'Dowd. 2014. Submicron NE Atlantic marine aerosol chemical composition and abundance: Seasonal trends and air mass categorization. J. Geophys. Res. Atmos. 119 (20):11,850–850. doi:https://doi.org/10.1002/2013JD021330.
- Ovadnevaite, J., D. Ceburnis, G. Martucci, J. Bialek, C. Monahan, M. Rinaldi, M. C. Facchini, H. Berresheim, D. R. Worsnop, and C. O'Dowd. 2011. Primary marine organic aerosol: A dichotomy of low hygroscopicity and high CCN activity. Geophys. Res. Lett. 38:L21806. doi:https://doi.org/10.1029/2011GL048869.
- Petters, M. D., and S. M. Kreidenweis. 2007. A single parameter representation of hygroscopic growth and cloud condensation nucleus activity. Atmos. Chem. Phys. 7 (8):1961–71. doi:https://doi.org/10.5194/acp-7-1961-2007.
- Pham, D. Q., R. O’Brien, M. Fraund, D. Bonanno, O. Laskina, C. Beall, K. A. Moore, S. Forestieri, X. Wang, C. Lee, et al. 2017. Biological impacts on carbon speciation and morphology of sea spray aerosol. ACS Earth Space Chem. 1 (9):551–61. doi:https://doi.org/10.1021/acsearthspacechem.7b00069.
- Quinn, P. K., and T. S. Bates. 2011. The case against climate regulation via oceanic phytoplankton sulphur emissions. Nature 480 (7375):51–6.
- Quinn, P. K., T. S. Bates, D. J. Coffman, L. Upchurch, J. E. Johnson, R. Moore, L. Ziemba, T. G. Bell, E. S. Saltzman, J. Graff, et al. 2019. Seasonal variations in Western North Atlantic remote marine aerosol properties. J. Geophys. Res. Atmos. 124 (24):14240–61. doi:https://doi.org/10.1029/2019JD031740.
- Quinn, P. K., D. J. Coffman, V. N. Kapustin, T. S. Bates, and D. S. Covert. 1998. Aerosol optical properties in the marine boundary layer during the First Aerosol Characterization Experiment (ACE 1) and the underlying chemical and physical aerosol properties. J. Geophys. Res. 103 (D13):16547–63. doi:https://doi.org/10.1029/97JD02345.
- Rinaldi, M., M. Paglione, S. Decesari, R. M. Harrison, D. C. S. Beddows, J. Ovadnevaite, D. Ceburnis, C. D. O’Dowd, R. Simó, and M. Dall’Osto. 2020. Contribution of water-soluble organic matter from multiple marine geographic eco-regions to aerosols around Antarctica. Environ. Sci. Technol. 54 (13):7807–17. doi:https://doi.org/10.1021/acs.est.0c00695.
- Roberts, G. C., and A. Nenes. 2005. A continuous-flow streamwise thermal-gradient CCN chamber for atmospheric measurements. Aerosol Sci. Technol. 39 (3):206–21. doi:https://doi.org/10.1080/027868290913988.
- Rogers, D. C. 1988. Development of a continuous flow thermal gradient diffusion chamber for ice nucleation studies. Atmos. Res. 22 (2):149–81. doi:https://doi.org/10.1016/0169-8095(88)90005-1.
- Rogge, W. F., L. M. Hildemann, M. A. Mazurek, G. R. Cass, and B. R. T. Simoneit. 1998. Sources of fine organic aeresol. 9. Pine, oak, and synthetic log combustion in residential fireplaces. Environ. Sci. Technol. 32 (1):13–22. doi:https://doi.org/10.1021/es960930b.
- Russell, L. M. 2013. Carbonaceous particles: Source-based characterization of their formation, composition, and structures. In Treatise on geochemistry, eds. Karl Turekian Heinrich Holland. 2nd ed., 291–316. Waltham, MA: Elsevier Science
- Russell, L. M., L. N. Hawkins, A. A. Frossard, P. K. Quinn, and T. S. Bates. 2010. Carbohydrate-like composition of submicron atmospheric particles and their production from ocean bubble bursting. Proc. Natl. Acad. Sci. USA. 107 (15):6652–7. doi:https://doi.org/10.1073/pnas.0908905107.
- Russell, L. M., S. F. Maria, and S. C. B. Myneni. 2002. Mapping organic coatings on atmospheric particles. Geophys. Res. Lett. 29 (16):26-1. doi:https://doi.org/10.1029/2002gl014874.
- Saliba, G., C.-L. Chen, S. Lewis, L. Russell, P. Quinn, T. Bates, T. Bell, M. Lawler, E. Saltzman, K. Sanchez, et al. 2020. Seasonal differences and variability of concentrations, chemical composition, and cloud condensation nuclei of marine aerosol over the North Atlantic. J. Geophys. Res. Atmos. 125 (19):e2020JD033145. doi:https://doi.org/10.1029/2020JD033145.
- Saliba, G., C.-L. Chen, S. Lewis, L. M. Russell, L.-H. Rivellini, A. K. Y. Lee, P. K. Quinn, T. S. Bates, N. Haëntjens, E. S. Boss, et al. 2019. Factors driving the seasonal and hourly variability of sea-spray aerosol number in the North Atlantic. Proc Natl Acad Sci USA. 116 (41):20309–14. doi:https://doi.org/10.1073/pnas.1907574116.
- Sanchez, Kevin J., G. C. Roberts, G. Saliba, L. M. Russell, C. Twohy, M. J. Reeves, R. S. Humphries, M. D. Keywood, J. P. Ward, and I. M. McRobert. 2020. Measurement report: Cloud processes and the transport of biological emissions regulate southern ocean particle and cloud condensation nuclei concentrations. Atmospheric Chemistry and Physics, Discussions. 1–36. doi:https://doi.org/10.5194/acp-2020-731.
- Sanchez, K. J., C. L. Chen, L. M. Russell, R. Betha, J. Liu, D. J. Price, P. Massoli, L. D. Ziemba, E. C. Crosbie, R. H. Moore, et al. 2018. Substantial seasonal contribution of observed biogenic sulfate particles to cloud condensation nuclei. Sci. Rep. 8 (1):1–14. doi:https://doi.org/10.1038/s41598-018-21590-9.
- Stein, A. F., R. R. Draxler, G. D. Rolph, B. J. B. Stunder, M. D. Cohen, and F. Ngan. 2015. Noaa’s hysplit atmospheric transport and dispersion modeling system. Bull. Am. Meteorol. Soc. 96 (12):2059–77.
- Stith, J. L., V. Ramanathan, W. A. Cooper, G. C. Roberts, P. J. DeMott, G. Carmichael, C. D. Hatch, B. Adhikary, C. H. Twohy, D. C. Rogers, et al. 2009. An overview of aircraft observations from the Pacific Dust Experiment campaign. J. Geophys. Res. 114:D05207. doi:https://doi.org/10.1029/2008JD010924.
- Sullivan, R. C., M. D. Petters, P. J. Demott, S. M. Kreidenweis, H. Wex, D. Niedermeier, S. Hartmann, T. Clauss, F. Stratmann, P. Reitz, et al. 2010. Irreversible loss of ice nucleation active sites in mineral dust particles caused by sulphuric acid condensation. Atmos. Chem. Phys. 10 (23):11471–87. doi:https://doi.org/10.5194/acp-10-11471-2010.
- Takahama, S., S. Gilardoni, L. M. Russell, and A. L. D. Kilcoyne. 2007. Classification of multiple types of organic carbon composition in atmospheric particles by scanning transmission X-ray microscopy analysis. Atmos. Environ. 41 (40):9435–51. doi:https://doi.org/10.1016/j.atmosenv.2007.08.051.
- Takahama, S., S. Liu, and L. M. Russell. 2010. Coatings and clusters of carboxylic acids in carbon-containing atmospheric particles from spectromicroscopy and their implications for cloud-nucleating and optical properties. J. Geophys. Res. 115:D01202. doi:https://doi.org/10.1029/2009JD012622.
- Twohy, C. H., P. J. DeMott, L. M. Russell, D. W. Toohey, B. Rainwater, R. Geiss, K. J. Sanchez, S. Lewis, G. Roberts, R. S. Humphries, et al. 2020. Cloud-nucleating particles over the Southern Ocean in a changing climate. Earth's Future.
- Twohy, C. H., J. W. Strapp, and M. Wendisch. 2003. Performance of a counterflow virtual impactor in the NASA icing research tunnel. J. Atmos. Ocean. Technol. 20 (6):781–90.
- Vallina, S. M., R. Simó, and S. Gassó. 2006. What controls CCN seasonality in the Southern Ocean? A statistical analysis based on satellite-derived chlorophyll and CCN and model-estimated OH radical and rainfall. Global Biogeochem. Cycles 20:GB1014. doi:https://doi.org/10.1029/2005GB002597.
- Vergara-Temprado, J., B. J. Murray, T. W. Wilson, D. O'Sullivan, J. Browse, K. J. Pringle, K. Ardon-Dryer, A. K. Bertram, S. M. Burrows, D. Ceburnis, et al. 2017. Contribution of feldspar and marine organic aerosols to global ice nucleating particle concentrations. Atmos. Chem. Phys. 17 (5):3637–58. doi:https://doi.org/10.5194/acp2017.
- Virkkula, A., K. Teinilä, R. Hillamo, V. M. Kerminen, S. Saarikoski, M. Aurela, J. Viidanoja, J. Paatero, I. K. Koponen, and M. Kulmala. 2006. Chemical composition of boundary layer aerosol over the Atlantic Ocean and at an Antarctic site. Atmos. Chem. Phys. 6 (11):3407–3658. doi:https://doi.org/10.5194/acp-6-3407.2006.
- Whittlestone, S., and W. Zahorowski. 1998. Baseline radon detectors for shipboard use: Development and deployment in the First Aerosol Characterization Experiment (ACE 1). J. Geophys. Res. 103 (D13):16743–51. doi:https://doi.org/10.1029/98JD00687.
- Xu, G., Y. Gao, Q. Lin, W. Li, and L. Chen. 2013. Characteristics of water-soluble inorganic and organic ions in aerosols over the Southern Ocean and coastal East Antarctica during austral summer. J. Geophys. Res. Atmos. 118 (23):13,303–13318. doi:https://doi.org/10.1002/2013JD019496.
- Zhao, D. F., A. Buchholz, B. Kortner, P. Schlag, F. Rubach, A. Kiendler-Scharr, R. Tillmann, A. Wahner, J. M. Flores, Y. Rudich, et al. 2015. Size-dependent hygroscopicity parameter (κ) and chemical composition of secondary organic cloud condensation nuclei. Geophys. Res. Lett. 42 (24):10,920–10928. doi:https://doi.org/10.1002/2015GL066497.
- Zieger, P., O. Väisänen, J. C. Corbin, D. G. Partridge, S. Bastelberger, M. Mousavi-Fard, B. Rosati, M. Gysel, U. K. Krieger, C. Leck, et al. 2017. Revising the hygroscopicity of inorganic sea salt particles. Nat. Commun. 8 (1):1–10. doi:https://doi.org/10.1038/ncomms15883.