
 ?Mathematical formulae have been encoded as MathML and are displayed in this HTML version using MathJax in order to improve their display. Uncheck the box to turn MathJax off. This feature requires Javascript. Click on a formula to zoom.
Abstract
Clothing or garments have been widely used to prevent dermal contact from particles. During the current COVID-19 pandemic, there has been a renewed focus on the role of clothing for personal protection. Insufficient attention has, however, been given to understand the relation between fabric parameters and fabric performance for filtration. In this study, two different fabric materials (10 oz denim and A30) were experimentally tested. The performance of the materials was estimated through both a benchtop test, similar to that used in filter performance studies, and a sleeve test which simulates a segment of the human body. The benchtop test established the relation among face velocity, pressure drop, and penetration. In the sleeve test, aerosol penetrations were determined for different sampling angles and wind conditions. In addition to individual fabric test, penetration measurements were also made with the combination of the two fabrics. The experimental results were used to test the performance of the fabric penetration model that was developed as part of this study. Our fabric penetration model is based on inhomogeneous filtration theory with fiber parameters optimized by experimental benchtop penetration results. The fabric penetration model was used to predict the performance of a fabric sleeve system. The theoretical predictions match with the experimental results well for free stream velocities in the range of 9 to 18 m s−1. Therefore, without expensive experimental test operation under elevated wind conditions, the penetration of a fabric at different operation conditions can be predicted based on the experimental results in benchtop test.
Copyright © 2020 American Association for Aerosol Research
EDITOR:
1. Introduction
Human exposure to submicron particles is of increasing concern from a public health perspective. For example, air pollution due to traffic exhaust emission is being studied globally because it is found to be an important source affecting human health (e.g., Oberdörster, Ferin, and Lehnert 1994; He and Dhaniyala Citation2012). Occupational workers typically use a respirator or mask to minimize respiratory exposure to airborne particles. Sufficient attention, however, has not been paid to particle detriment through dermal contact pathways to human health (Gao et al. Citation2011). Research studies have shown that nanoparticles can penetrate through the human skin and into the body (Hodson, Methner, and Zumwalde Citation2009). These particles are absorbed into cells and can cross the blood–brain barrier (Lockman et al. Citation2003). Therefore, it is critical that appropriate clothing or individual protective equipment (IPE) be used to minimize dermal contact in an occupational workplace. Recently, the focus on IPE has been on the role of cloth masks in reducing exposure to pathogenic bioaerosol such as droplets containing SARS-CoV-2 virus. The performance of commonly used woven or non-woven fabrics for general clothing and as IPE is, however, poorly understood.
Fabric IPE penetration was studied by Hill et al. (Citation2013) using three experimental approaches – benchtop, wind tunnel swatch, and wind tunnel sleeve tests. In both the benchtop and wind tunnel swatch tests, the fabric was tightly covered over a filter holder, and a pump was operated to drive particle flow across the fabric and form a constant interior flow inside the filter holder. The benchtop test with a flat fabric piece is typically conducted with the fabric placed in a filter holder and penetrations measured from the ratio of downstream to upstream particle size distribution (Dhaniyala and Liu Citation1999). These tests showed that fabric media behaved similar to fibrous filter media, with particle capture efficiency dependent on the diameter of the “fibers” in the cloth, the tightness of the weave or packing density, and the thickness of the fabric or media. The application of traditional filtration theory to explain woven fabric filter performance was further established from computational fluid dynamics (CFD) simulations of fabric aerosol penetration (Ling, Wang, and Pui Citation2012).
In the sleeve tests of Hill et al. (Citation2013), a cylindrical holder held a fabric sleeve that was exposed to particle-laden wind-tunnel flow. The cylindrical sleeve holder represented an idealized component such as a human arm or leg and the fabric over the holder represented the sleeve cloth over the component. The particle penetration resulting from the flow field around the sleeve was then measured at a zero-degree angle, that is, in the direction directly facing the flow field. The experimental data were used to validate a simple theoretical model that described particle penetration through cylindrical fabric sleeves. In this model, knowledge of flow fields outside and inside cylindrical fabric sleeves (Bergman et al. Citation1986) was combined with classical single-fiber filtration theory to predict particle penetration through fabric sleeve systems.
In the work of Hill et al. (Citation2013), the single fiber filtration efficiency was obtained with an expression different from the general expression (Hinds Citation1999). In their work, four media and face velocity-dependent coefficients were applied in the single fiber filtration expression to adjust the contribution from four different collection mechanisms (convective diffusion, direct interception, inertial impaction, and the interaction between diffusion and interception), and these coefficients were determined from experimental penetrations.
The fabric aerosol penetration study of Hill et al. (Citation2013) established the possibility of using filtration theory to characterize the IPE media performance. This work aims to extend the study of Hill et al. (Citation2013) using more generic fabric material (10 oz denim and A30) as test material and more advanced filtration theory to understand performance of sleeves. The results from this study will help us better understand the extent of human dermal exposure to submicron pollutants.
2. Experimental setup
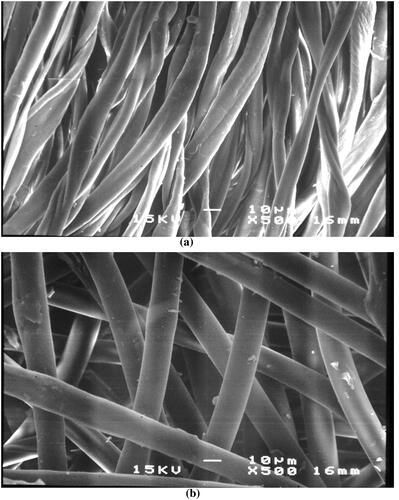
The fabric media tested in this study include the following: a 10 oz 100% cotton, 2/1 right-hand twill denim fabric, weighing 10 ounces per square yard, purchased from Jo-Ann Fabrics in 2010; and A30, a Kleenguard breathable coverall (Kimberly Clark Corporation Dept., Neenah, WI, USA). The pictures of the two fabrics from the scanning electron microscope (SEM) are shown in . The SEM pictures show that both fabrics have the characteristics of a fibrous filter.
Figure 1. Scanning electron microscope (SEM) picture of (a) 10 oz Denim and (b) A30.
The fabrics were tested with benchtop swatch and wind tunnel sleeve model. In the benchtop swatch setup, the test fabric was fixed in a 47-mm filter holder (Pall Corp., Port Washington, NY, USA). The pressure drop across the fabric sample was measured using a gauge Model 2101 (Mensor Corp., San Marcos, TX, USA) as a function of flowrate. The permeability of fabric materials was established based on the relation between face velocity and pressure drop crossing the fabric (Darcy Citation1856).
To characterize fabric penetration as a function of face velocity, aerosol measurements were made upstream and downstream of the filter using the experimental setup as shown in for a range of flowrates through the fabric sample. Particle size distribution measurements were alternately made upstream and downstream of the media to obtain size-dependent fabric penetration results. The tests were conducted by generating polydisperse aerosol by nebulizing a solution of 10% dioctyl sebacate (DOS) in 200-proof ethanol. Ethanol and water were removed from the generated aerosol by mixing the nebulizer flow with a high flowrate of clean airflow and a silica gel dryer. The generated particles were neutralized by a TSI 3077 A unit before dispersed to the testing section. Particle size distributions were measured by a combination of scanning mobility particle sizer (SMPS, TSI 3936) and aerodynamic particle sizer (APS, TSI 3320). The SMPS was operated with 3.0 l min−1 sheath flowrate and 0.3 l min−1 aerosol flowrate and a scanning time of 120 sec. The algorithm of He and Dhaniyala (Citation2013) was applied to make the multiple charging correction on the SMPS measured data. A mass flow controller (MFC; Sierra Instruments Inc., C100M, Monterey, CA, USA) was used to ensure adequate flow to the sampling instruments for all tested fabric face velocity conditions.
Figure 2. Experimental setup: (a) benchtop and (b) sleeve configurations.
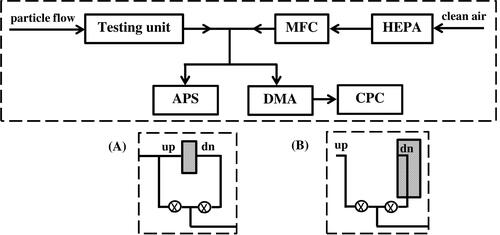
For the sleeve test, an experimental setup like that of Hill et al. (Citation2013) was used in this study. The tested fabrics were sewn to form a sleeve that was fit tightly over a component model. The component model, chosen to simulate a segment of a human body, was a cylinder with diameter of 0.08 m. The fabric sleeve was placed around the component over a thin support screen of 0.11 m diameter to prevent fabric flapping and deformation. Thus, there was a gap of ∼ 0.014 m between the cylinder and the testing fabric. To ensure that the flow around the fabric cylinder is largely two-dimensional, the cylinder length is extended to the top of the wind tunnel with an upper mounting adaptor.
The sleeve tests were conducted in the Naval Aerodynamic Test Facility (NATF) wind tunnel (Patuxent River, Maryland) which has a test section of 4 by 4 feet, similar to that used in Hill et al. (Citation2013). After stabilization of the wind tunnel flowrates, spatial variations of velocity in the tunnel were observed to be ∼1.0% and temporal fluctuations ∼0.5%. The temperature in the tunnel was 26.1 °C with variation less than 0.11 °C. The pressure drop across the fabric sleeve cylinder was measured at different wind-tunnel velocities using two static pressure probes placed upstream and downstream of the fabric, directly facing the flow, that is, at zero degree relative to wind-tunnel velocity. The pressures were measured using electronically scanned-pressure modules (Pressure Systems Inc., Hampton, VA, USA) with ranges of 10 inches and 20 inches of water.
For sleeve test measurements, as in the benchtop measurements, a solution of 10% dioctyl sebacate (DOS) in 200-proof ethanol was nebulized and the particles were dried using dilution air and silica gel (). Aerosol particles were disseminated in the wind tunnel test section with an array of injectors, similar to the setup used in Hill et al. (Citation2013). The size distributions of the polydisperse aerosol in the wind tunnel were made upstream of the fabric cylinder measurements using a probe placed ∼76 mm upstream of the fabric cylinder, and downstream with a probe affixed to the inner surface of the fabric. The size distribution measurements of the particles sampled with the two probes were measured using a combination of SMPS and APS, as in the benchtop experiment.
Sleeve tests were conducted with free stream flow in the wind tunnel set to 3.0, 6.1, 9.1, 13.2, 18.3, 27.4, and 36.6 m s−1. For each fabric face velocity, penetration was measured from the ratio of downstream to upstream particle concentrations as a function of particle size. Penetration measurements were made from at least five repeated measurements of sampled size distributions. For a selected test case, any possible particle loading effect was monitored by analyzing trends in penetration over the repeated tests. Our data indicated that the fabrics were tested without approaching any loading effects during the penetration measurements.
The detailed experimental setup and particle size distribution for the testing are included in the online supplementary information.
3. Experimental results
3.1. Pressure drop
The benchtop measurements of pressure drop () as a function of face velocity (
) can be used to determine media permeability. According to Darcy’s law, the permeability (
) of a media can be obtained following EquationEquation (1a)
(1a)
(1a) :
(1a)
(1a)
(1b)
(1b)
where
is gas viscosity, Df is fiber diameter, L is fabric thickness, measured by a caliper, and
is packing density. The expression
was shown by Davies (Citation1953) as follows:
(2)
(2)
The fiber diameter for the media can be obtained from the SEM images (), and the packing density can be calculated using EquationEquations (1)(1a)
(1a) and Equation(2)
(2)
(2) from pressure drop measurements. For each test media, the fabric parameters obtained from measurements are summarized in in the rows labeled as “measured.” For the media tested, the permeability per unit thickness,
rather than the permeability, is reported in . Also, shown in are optimized fiber parameter values, which will be discussed later in Section 4.
Table 1. Fabric parameters obtained from measurements and optimization.
The two tested media have super-micron diameter fibers. The calculated packing densities are larger than 0.3, suggesting that they are heavily packed. The A30 media has larger permeability per unit thickness than denim. The combination of the two media results in lower permeability than either of the individual media. The measured permeability per unit thickness of the combination (3.91 nm) matches reasonably with the calculated value (4.32 nm) that is determined from individual fabric permeability measurements.
The face velocity and pressure drop for different test setups and operating conditions are summarized in . In benchtop setup, for a constant face velocity, the pressure drop across the combination of the two media (denim and A30) is always higher than the sum of the pressure drop across each media under the same face velocity. From EquationEquation (1a)(1a)
(1a) and the permeability values in , it can be found that the higher pressure drop across the combination of the two media is because of its lower permeability in unit thickness.
Table 2. Face velocity and pressure drop across the media.
In the sleeve test setup, the pressure drop measured across the test media at different free stream velocities can be used to determine face velocity using the EquationEquation (1)(1a)
(1a) . The face velocities through the sleeve increase with increasing free stream flow velocity and media permeability. Thus, the face velocity across A30 is higher than that across denim, while for the combination of the two fabrics the face velocity is lower than that across the denim.
3.2. Penetration
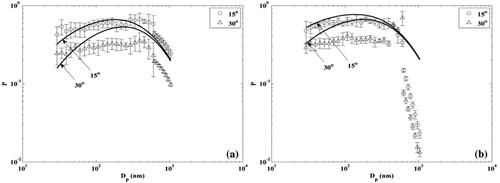
Penetration across each media is calculated from the ratio of downstream and upstream particle size distributions. Like fibrous filters, the penetration for larger size particles (>∼500 nm) decreases with increasing face velocity due to inertial impaction, while the penetration increases slightly for smaller sized particles (<∼100 nm) because of decreased diffusion effect with increasing face velocity, as shown in for a denim fabric. For the measured penetration distribution in each condition, the maximum penetration particle size (MPPS) can be obtained from the lognormal-form fit to the penetration curve as shown in He, Dhaniyala, and Wagner (Citation2015). The MPPS determined from the fit expression, under different operation conditions, are shown in .
Figure 3. Particle penetration over denim under (a) varying face velocity for benchtop test and (b) constant 18.3 m s−1 free stream wind speed with different sampling azimuth during sleeve test.
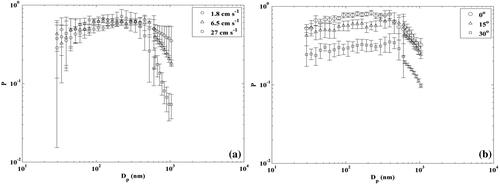
Figure 4. Maximum penetration particle size (MPPS) vs. face velocity.
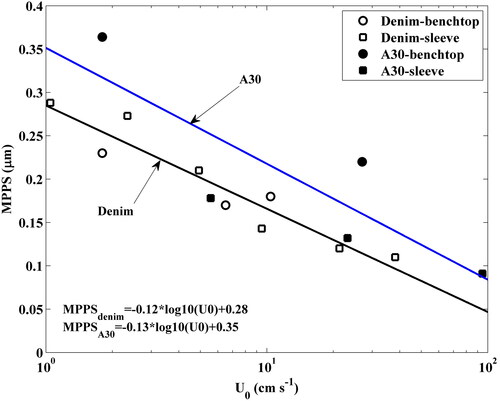
For both tested fabrics, the MPPS decreases with increasing face velocity. With increasing face velocity, the collection efficiencies of larger size particles increase due to inertial impaction, while the collection efficiencies of small size particles decrease because of diffusion. As a result, the penetration peak shifts to smaller size with increasing face velocity. The MPPSs from denim measurements, from both benchtop and sleeve setups, largely lie on the best-fit line, but the fabric A30 media MPPS data are seen to have significant scatter, with benchtop MPPS data being mostly larger than the sleeve data. The SEM picture in shows that the A30 fabric fiber diameters are more uniform than that of denim, but the fibers in denim are more uniformly packed compared to A30. The high non-uniformity in fiber distribution in A30 results in significant penetration variability are also shown in later section. In addition to the MPPS, the broadness of the penetration distribution over particle size increases with lower face velocity, that is, the penetration curve becomes flatter with decreasing face velocity. Unlike MPPS, the broadness of the penetration distribution cannot be explained based on filtration theory.
While measurements provide an understanding of the performance of selected test material under a limited number of test conditions, the availability of general theoretical guidance is critical for prediction of fabric filtration performance under a range of conditions. Using the experimental results obtained in this study, we determine whether filtration theory can be used to model fabric filtration.
4. Theoretical prediction
The ability to theoretically model fabric media performance will allow for prediction of fabric sleeves under a range of operating conditions. To model fabric media performance, inhomogeneous fibrous filtration theory is applied. Using the theoretical prediction approach of He, Dhaniyala, and Wagner (Citation2016), first the fabric parameters are optimized, and these parameters are then applied in the inhomogeneous fibrous filtration theory to predict the penetration distribution.
4.1. Fiber parameter optimization
The measured fiber parameters are summarized in . Filters, however, have significant variability in their parameters, such as fiber diameter and packing density. Modeling complex filter structures with simple filtration theories requires the use of effective values for these parameters. In this study, we use the pressure drop and penetration measurements made in benchtop experiments, in conjunction with inhomogeneous filter theory of Dhaniyala and Liu (Citation2001), to calculate effective filter parameters. Because of the high penetration variability at some size channels, only the data with relative variability less than 25% are applied for the optimization. After the optimized parameters are obtained, the measurement data obtained under different experiment setup and flowrates are shown against the theoretical prediction results.
For calculation of equivalent filter parameters, the experimental penetration results are optimized as a function of operating conditions using the expression of Lee and Liu (Citation1982):
(3)
(3)
where is the fabric collection efficiency,
is the Peclet number, R is the interception parameter, and Ku is the Kuwabara hydrodynamic parameter. The details about these parameters and the filtration theory are in the supplementary information of He, Dhaniyala, and Wagner (Citation2016). Optimal values of the combination of fiber diameter Df, packing density
and fabric thickness L are determined by ensuring that the calculated pressure drop (EquationEquation (1)
(1a)
(1a) ) and penetration (EquationEquation (3)
(3)
(3) ) for the entire range of face velocities and particle sizes studied best match measurements. The details of the optimization procedure are described in He, Dhaniyala, and Wagner (Citation2016).
The optimized parameters for each fabric are summarized in . Compared with measured parameters, the optimized values for all three parameters are smaller. The permeability values per unit thickness calculated from the optimized parameters are also shown for comparison. For the A30 fabric, the calculated permeability from the optimized parameters is close to the measured values, while the denim permeability calculated from the optimized parameters is larger than that measured. The mismatch of the permeability obtained from the measurement and optimized parameters indicates that the pressure drop prediction based on the optimized parameters will deviate from the measurement. For denim, the results based on the experiment measurement and the Lee and Liu (Citation1982) curve in EquationEquation (3)(3)
(3) are shown in . The maximum deviation of experimental data from predictions based on optimized parameter values is in the lower end of
values. As detailed in Lee and Liu (Citation1982), the lower end of the curve generally corresponds to data at smaller particle sizes, therefore our optimized parameters will likely over-predict penetration for particles smaller than the MPPS.
Figure 5. The correlation of Lee and Liu (Citation1982) in EquationEquation (3)(3)
(3) compared with experimental results using denim and optimized fiber parameters.
![Figure 5. The correlation of Lee and Liu (Citation1982) in EquationEquation (3)(3) ηPeR1+R=1.6[(1−αKu)13Pe13]+0.6[(1−αKu)13Pe13]3(3) compared with experimental results using denim and optimized fiber parameters.](/cms/asset/1bb72d07-277f-4925-9063-046585b262c7/uast_a_1845297_f0005_b.jpg)
4.2. Penetration prediction
As the filtration theory proposed by Lee and Liu (Citation1982) does not accurately capture the performance of fabric media because of its significant non-uniformity, the inhomogeneous filtration theory of Dhaniyala and Liu (Citation2001) is applied for penetration prediction. Dhaniyala and Liu (Citation1999) observed that real filters are inhomogeneous with respect to packing of fibers, and correspondingly, the packing density distribution must be considered for efficiency calculation. For a given pressure drop across the filter or fabric medium, a distribution of packing densities will result in a distribution of face velocities. A greater fraction of flow will pass through low packing density sections compared to that through the high packing density sections. Considering the distribution of packing densities along with the corresponding distribution of velocities, results in distribution of efficiencies within a single filter section will be expected. The net efficiency of an inhomogeneous filter media must be determined from an area-weighted mean of these efficiencies. If the inhomogeneity in the filter/fabric medium can be characterized accurately, then the efficiency of an inhomogeneous filter media can be estimated accurately.
To use the theory of Dhaniyala and Liu (Citation2001), an additional parameter, the geometric standard deviation of packing density needs to be determined from experimental data. Following the single fiber filtration theory and the optimization procedure described in He, Dhaniyala, and Wagner (Citation2016), the optimal value of
can be determined as a function of face velocity for the two fabrics under different test conditions (). Compared with the values of
for a typical fibrous media (He, Dhaniyala, and Wagner Citation2016), the larger
values calculated for the fabric media indicate their significantly larger inhomogeneity. Comparing the two fabrics, the A30 has comparatively larger non-uniformity of fiber packing for all the test conditions than denim, which results in larger penetration fluctuation during measurement.
Table 3. Optimized geometric standard deviation of packing density obtained using inhomogeneous filtration theory.
While the varying as a function of face velocity indicates that the effect of non-uniformity on filter behavior is a function of face velocity, the inhomogeneous filtration theory of Dhaniyala and Liu (Citation2001) requires the use of a single
value for a selected media. To improve the application of the inhomogeneous filtration theory, a constant value of
was obtained through the optimization method proposed in He, Dhaniyala, and Wagner (Citation2016). Similarly, as the fiber parameter optimization, only data from benchtop test with relative standard deviation less than 25% are chosen for the optimization.
The theoretical predictions of penetration distribution compared with benchtop experimental results are shown in for denim and for A30. The constant values of for denim and A30 are 2.15 and 2.92, respectively. The weighted error,
is introduced to quantify the quality of comparison. Here Pi,exp and Pi,predict are penetration at ith particle size channel from experiment and prediction, respectively, and N is the total size channels. The weighted error for different operation conditions are summarized in . For denim, the theoretical predictions with a constant value of
largely match with experimental measurements under the corresponding face velocity. For comparison, the theoretical predictions at 1.8 and 10.4 cm s−1 with the
values shown in are displayed in . The theoretical predictions with the velocity-dependent
values shown in are better matched with experimental data than when a constant value of
is used. The under-prediction at 1.8 cm s−1 (low face velocity) and over-prediction at 27 cm s−1 (high face velocity) result from the use of a single, optimized value of
for all velocities.
Figure 6. Measured and theoretical penetration from benchtop setup: (a) denim 1.8 and 6.5 cm/s; (b) denim 10.4 and 27 cm/s; (c) A30 1.8 and 6.5 cm/s; and (d) A30, 10.4 and 27 cm/s.
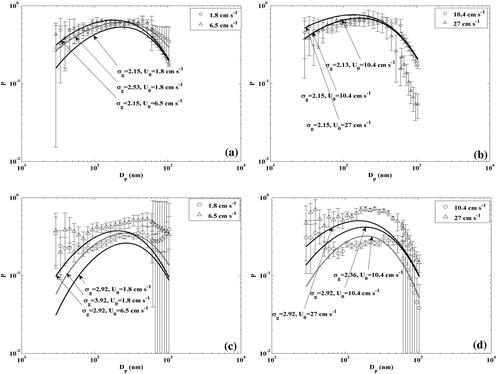
Table 4. Weighted error, between the experiment measurements and theoretical predictions.
Compared to denim, the discrepancy between theoretical predictions and experimental measurements are larger for the A30, at both low and high face velocities, as seen in . The A30 penetration measurements have high variability at larger sizes because of the low concentrations of these test particles in this size range. The broad distribution of size-dependent penetration deteriorates the theoretical prediction accuracy. Because of the larger range of with the A30 than denim, theoretical predictions with a constant
value for this fabric does not match well with experimental results for all face velocities.
4.3. Theoretical predictions using optimized parameters
Theoretical predictions based on optimized fiber parameters and constant value for each of the fabrics are made for different test conditions and compared against experimental results.
4.3.1. Theoretical prediction for sleeve setup
The theoretically predicted penetrations for the sleeve setup are shown in . The face velocities for the different free stream velocities are given in . The penetration results for denim are shown in , and for A30 in . For denim, theoretical predictions match experimental results under most free stream velocities. At low flows (3.0 and 9.1 m s−1), the theoretical prediction diverges from experimental results at particle sizes where large variability in penetration is observed. For higher wind speeds (18.3 and 36.6 m s−1), experimental penetration is largely unchanged for almost all particle sizes studied. At the largest particle sizes, the penetration at the higher free stream velocity (36.6 m s−1) is reduced, and at these sizes, theoretical predictions are not matched with experimental results. This discrepancy is because, at high face velocity and large particle size, inertial impaction is the dominant particle collection mechanism and the existing impaction filtration theory (Stechkina, Kirsch, and Fuchs Citation1969) has been found not to be always accurate (He, Dhaniyala, and Wagner Citation2016).
Figure 7. Measured and theoretical penetration from sleeve setup: (a) denim 3.0 and 9.1 m/s; (b) denim 18.3 and 36.6 cm/s; (c) A30 3.0 and 9.1 cm/s; and (d) A30, 18.3 and 36.6 cm/s.
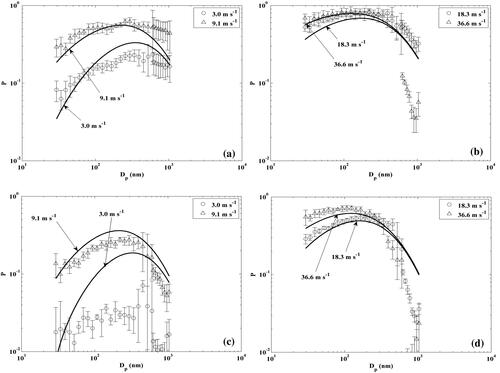
For A30, similar to the benchtop test results, the sleeve tests also show that theoretical predictions deviate significantly from experimental results at low face velocities. At low free stream velocity (3.0 m s−1), the experimental penetration results have a broad distribution with particle size, with relative variability in penetration greater than 25% for almost all sizes. At higher face velocities, it is observed that the theoretical predictions match reasonably with the experimental results. At high free stream velocities (18.3 and 36.6 m s−1), the experimental penetrations decrease significantly for larger particles, and similar to the observations with denim.
4.3.2. Combination of two fabrics
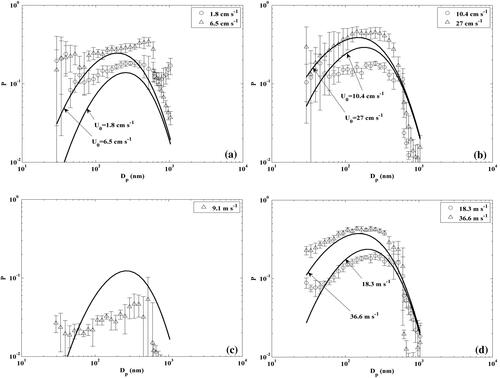
Often, occupational workers use multiple layers of clothing and their combined performance must be understood. The penetration for the two fabrics, A30 and denim, sandwiched together, was measured with both benchtop and sleeve setups. The benchtop results are shown in , while the sleeve results are shown in . Consistent with the results from the individual fabric tests, a large variability in particle penetrations is observed at small sizes. For theoretical penetration predictions, it is assumed that the penetration of the two layers is the product of the penetrations of each of the layers at the corresponding face velocity. The benchtop test results mostly follow the trend of theoretical predictions except at low face velocity conditions (1.8 and 6.5 cm s−1). At low face velocity, a large discrepancy is observed between theoretical predictions and experimental measurements and this is primarily because of the prediction problems with A30 at low face velocities, as seen in . Theoretical predictions are, however, seen to match well with the experimental results at higher face velocities (10.4 and 27 cm s−1) for particles smaller than ∼500 nm. In the sleeve tests, the penetrations at a free stream velocity of 3.0 m s−1 are seen to be low and highly variable, thus, not analyzed here. Consistent with the large variability of the measurement results with individual fabric at low free stream velocity (9.1 m s−1), the relative variability in penetration at almost all sizes are larger than 25%. At free stream velocity of 9.1 m s−1, another reason for the large deviation between theoretical predictions and experimental results is the limited application range of A30 optimized parameters for penetration prediction. At this low free stream velocity (9.1 m s−1), the face velocity is only 1.44 cm s−1 which is lower than the smallest velocity studied in our benchtop tests. Under high free stream flow operations (18.3 and 36.6 m s−1), theoretical predictions largely match with the experimental results. Under combination fabric test, the face velocity is much lower than that with individual fabric under constant free stream velocity (shown in ); therefore, the contribution of inertial impaction effect on the filtration is comparatively lower, and the theoretical predictions at large sizes match with the experimental results better.
Figure 8. Measured and theoretical penetration for the combination of denim and A30: (a) benchtop 1.8 and 6.5 cm/s; (b) benchtop 10.4 and 27 cm/s; (c) sleeve 9.1 m/s; and (d) sleeve 18.3 and 36.6 m/s.
4.3.3. Penetration test under different angle
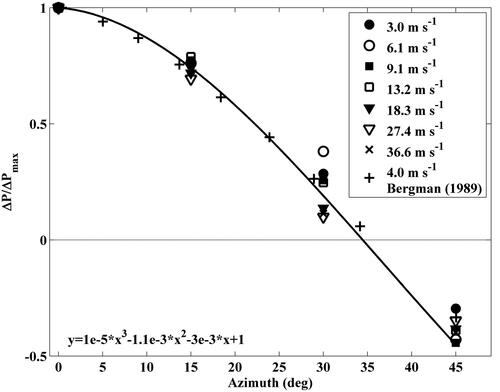
All the above experimental results were obtained at a zero degree of azimuth, that is, with the sample probe in the “stagnation point,” if the sleeve were solid. For a sleeve, the net penetration depends on the integral of penetration over all azimuths around the sleeve cylinder. The azimuth-dependent penetration measurements were made by rotating the sampling inlet location. The pressure drop across the fabric was measured at each of the azimuth sampling location. For a selected free stream flow velocity, the pressure drop across the fabric is maximal at zero-degree azimuth, and correspondingly the face velocity is also the maximum. When the sampling inlet is at ∼35° azimuth, the pressure drop is almost zero, that is, there will be no aerosol flow penetration through the fabric at the angle larger than 35°. For different azimuths, the pressure drop across the denim fabric normalized by the pressure drop at zero azimuth is shown in . It is found that the normalized pressure drops at different angles are almost independent of free stream flow velocity and can be fitted by a cubic polynomial expression and consistent with the published data (Bergman et al. Citation1989). In the work of Bergman et al. (Citation1989), a different fabric (protective clothing) at 4.0 m s−1 was tested. Based on the pressure drop measured at different angles, the corresponding face velocities are linearly related to the pressure drop and can be calculated according to EquationEquation (1)(1a)
(1a) .
Figure 9. Normalized pressure drop for 10 oz denim vs. separation angle.
Under different free stream flow velocities, the denim penetration was measured under azimuth 15° and 30°, shown in . The measured and predicted penetrations under the free stream velocities of 9.1 and 36.6 m s−1 with the two angles are shown in , respectively. For a free stream velocity of 9.1 m s−1, the penetration distributions for the two angles are very broad, with penetration seeming to be almost independent of particle size. Under this free stream flow velocity, it is also found that there is little difference between the penetrations measured under 15° and 30°. When operated under higher free stream flow velocity, the penetrations measured at 30° are consistently lower than that measured at 15°. For larger sizes, the penetrations decrease significantly with increasing free stream. Based on the measured pressure drops under the different sampling inlet azimuths and the linear relation between pressure drop across the fabric and face velocity in , the face velocities under different angles can be calculated and used in theoretical prediction of particle penetration. Using the optimized fiber parameters and geometric standard deviation of packing density obtained from benchtop test, penetration predictions are made for different free stream flow velocities and azimuths. When the free stream flow velocity is 9.1 m s−1 and the azimuth is zero degree, the theoretical prediction matches the experimental results well, however, divergences were observed between the theoretical prediction and experimental measurements when the azimuth is adjusted to 15° or 30°. The divergences cannot be completely attributed to low face velocity because the prediction matches well with the experimental results when the free stream flow velocity is 3.0 m s−1, shown in . At higher free steam flow velocity, the theoretical predictions of penetration with 15° match with the corresponding experimental results well. At channels corresponding to sizes larger than ∼ 500 nm, the difference between theoretical prediction and experimental results increase with increasing free stream flow velocity. Generally, the theoretical prediction cannot match experimental results well for an azimuth of 30°.
Figure 10. Measured and theoretical penetration for denim with sleeve setup at 15° and 30° under free stream velocity: (a) 9.1 m/s and (b) 36.6 m/s.
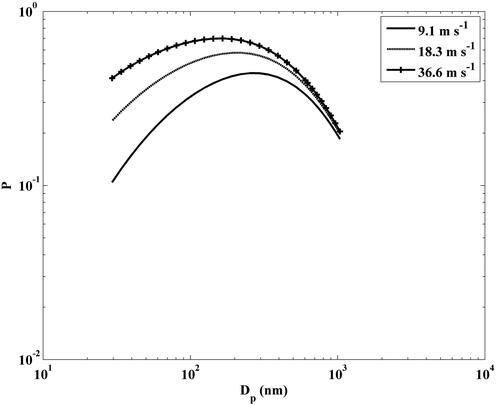
Often, rather than penetrations at discrete azimuths, the net penetration through a sleeve may be of interest. To calculate the net penetrations for a selected free stream flow velocity, the pressure drop across the fabric at zero azimuth should be first measured. Then using the expression shown in , the pressure drop at any azimuth can be calculated and the corresponding face velocity is calculated using Equation (1) and the benchtop results in . The penetration at any azimuth could then be calculated. By averaging the predicted penetrations over azimuth with positive pressure drop, the net penetration over the sleeve can be estimated. For denim, using the optimized fabric parameters and the geometric standard deviation of packing density, the net predicted penetration over the denim sleeve setup under different free stream flow velocities is shown in . For particles smaller than 100 nm, the penetration decreases with decreasing free stream flow velocity, while for larger sizes, the penetration is largely unchanged with free stream flow velocity. The MPPS of the net sleeve penetration is seen to decrease with increasing free stream flow velocity.
Figure 11. Predicted net penetration through 10 oz denim sleeve based on the optimized parameters and inhomogeneous filtration theory.
5. Conclusions
As fabric clothing is a critical component of an individual protective equipment, it is important to have a predictive knowledge of their particle penetration characteristics. In this study, we tested two fabrics, 10 oz denim and A30, in three different patterns: a single layer denim, a single layer of A30, and a two-layer sample consisting of denim and A30. The benchtop experiments are conducted with flat fabric pieces to characterize the filtration- and flow-related parameters such as permeability, equivalent fiber diameter, and packing density. The experimental results show that the most penetrating particle size linearly decreases with increasing face velocity in the logarithmic scale, and the penetration distribution of A30 is wider than that of denim. The benchtop test results were also used to obtain optimal fiber parameters which were applied for theoretical penetration prediction in both benchtop and sleeve tests. The inhomogeneous filtration theory with a constant packing density distribution was found reasonably predicting fabric particle penetration in benchtop and sleeve configurations. Using the optimized fiber parameters, the particle penetrations of fabric sleeves under single- and multiple-layer configurations can be predicted around the circumference, and the net penetration through a sleeve can be estimated. While additional work is required to fully validate the predictions of net penetration of a sleeve component, this study suggests that penetration through a large-scale component, such as the full human body, can be estimated from simple benchtop experiments, particularly in sizes around the MPPS.
Supplemental Material
Download MS Word (973.6 KB)Acknowledgment
We acknowledge the invaluable support from JJ Armstrong at RED Inc., Jim Hanley at RTI International, Nicholas Stiegman at the US Navy, Tom Cao, Jim Hanzelka, Andrew Neafsey, and Richard Phan at Dugway Proving Ground. The valuable assistance of Mr. Rod Pursell, Ms. Wendy Todd, Mr. Jackson Shannon, and Mr. Christian Egbert is gratefully acknowledged.
Additional information
Funding
References
- Bergman, W., P. D. Fedele, R. McCallen, and S. Sutton. 1986. Hydrodynamically Induced Aerosol Transport, Proceedings of the 1985 Scientific Conference on Chemical Defense Research. Aberdeen Proving Ground, MD.
- Bergman, W., J. Garr, D. Fearon, and P. Gerdner. 1989. Aerosol penetration measurements through protective clothing in small scale simulation tests. Proceedings of the 3rd International Symposium on Protection against Chemical Warfare Agents. Umea, Sweden, June 11–16.
- Darcy, H. 1856. Les fontaines publiques de la ville de Dijon. Paris: Dalmont.
- Davies, C. N. 1953. The separation of airborne dust and particles. Proc. Ins. Mech. Eng. Part B 167 (1b):185–213. doi:https://doi.org/10.1177/002034835316701b13.
- Dhaniyala, S., and B. Y. H. Liu. 1999. Investigations of particle penetration in fibrous filters part I. Exp. J. IEST 42 (1):32–40. doi:https://doi.org/10.17764/jiet.42.1.k71lm163x574w701.
- Dhaniyala, S., and B. Y. H. Liu. 2001. Theoretical modeling of filtration by nonuniform fibrous filters. Aerosol Sci. Technol. 34 (2):170–8. doi:https://doi.org/10.1080/027868201300034763.
- Gao, P., P. A. Jaques, T.-C. Hsiao, A. Shepherd, B. C. Eimer, M. Yang, A. Miller, B. Gupta, and R. Shaffer. 2011. Evaluation of nano- and submicron particle penetration through ten nonwoven fabrics using a wind-driven approach. J. Occup. Environ. Hyg. 8 (1):13–22. doi:https://doi.org/10.1080/15459624.2010.515554.
- He, M., and S. Dhaniyala. 2012. Vertical and horizontal concentration distributions of ultrafine particles near a highway. Atmos. Environ. 46:225–36. doi:https://doi.org/10.1016/j.atmosenv.2011.09.076.
- He, M., and S. Dhaniyala. 2013. A multiple charging correction algorithm for scanning electrical mobility spectrometer data. J. Aerosol Sci. 61:13–26. doi:https://doi.org/10.1016/j.jaerosci.2013.03.007.
- He, M., S. Dhaniyala, and M. Wagner. 2015. Aerosol filtration with mobility-classified particles: role of multiply charged particles in skewing penetration measurements. Aerosol Sci. Technol. 49 (9):705–16. doi:https://doi.org/10.1080/02786826.2015.1062467.
- He, M., S. Dhaniyala, and M. Wagner. 2016. Characterization of filter performance under low-pressure operation. Aerosol Sci. Technol. 50 (5):417–28. doi:https://doi.org/10.1080/02786826.2016.1162902.
- Hill, M. A., T. A. Ghee, J. Kaufman, and S. Dhaniyala. 2013. Investigation of aerosol penetration through individual protective equipment in elevated wind conditions. Aerosol Sci. Technol. 47 (7):705–13. doi:https://doi.org/10.1080/02786826.2013.783899.
- Hinds, W. C. 1999. Aerosol technology: Properties, behavior, and measurement of airborne particles, 2nd ed. New York: Wiley-Interscience.
- Hodson, L., M. Methner, and R. D. Zumwalde. 2009. Approaches to safe nanotechnology: Managing the health and safety concerns associated with engineered nanomaterials. National Institute for Occupational Safety and Health. http://cdc.gov/niosh/docs/2009-125/
- Lee, K. W., and B. Y. H. Liu. 1982. Theoretical study of aerosol filtration by fibrous filters. Aerosol Sci. Technol. 1 (2):147–61. doi:https://doi.org/10.1080/02786828208958584.
- Ling, T. Y., J. Wang, and D. Y. H. Pui. 2012. Numerical modeling of nanoparticle penetration through personal protective garments. Sep. Purif. Technol. 98:230–9. doi:https://doi.org/10.1016/j.seppur.2012.07.015.
- Lockman, P. R., M. O. Oyewumi, J. M. Koziara, K. E. Roder, R. J. Mumper, and D. D. Allen. 2003. Brain uptake of thiamine-coated nanoparticles. J. Control Release 93 (3):271–82. doi:https://doi.org/10.1016/j.jconrel.2003.08.006.
- Oberdörster, G., J. Ferin, and B. E. Lehnert. 1994. Correlation between particle size, in vivo particle persistence, and lung injury. Environ. Health Perspect. 102 (suppl 5):173–9. doi:https://doi.org/10.1289/ehp.102-1567252.
- Stechkina, I. B., A. A. Kirsch, and N. A. Fuchs. 1969. Studies on fibrous aerosol filters. IV. Calculation of aerosol deposition in model filters in the range of maximum penetration. Ann. Occup. Hyg. 12 (1):1–8. doi:https://doi.org/10.1093/annhyg/12.1.1.