
 ?Mathematical formulae have been encoded as MathML and are displayed in this HTML version using MathJax in order to improve their display. Uncheck the box to turn MathJax off. This feature requires Javascript. Click on a formula to zoom.
Abstract
Atmospheric soot is an air pollutant and a climate forcer. Its environmental impacts are altered when fractal soot particles change their composition and morphology during atmospheric processing by coagulation, surface oxidation, and vapor condensation. Previously, we have shown that supersaturated vapor condensation can produce two different coating distributions on soot aggregates and developed a qualitative analytical model to predict the condensation outcome based on a single dimensionless parameter χ. In this study, we refine our model by introducing rigorous treatments of the condensate surface curvature and condensation rate. The model is solved numerically to evaluate the distribution of condensate on soot aggregates composed of monodisperse spheres that can be further used to predict their morphology. Hence, this study serves as a step toward developing of a multiphysics model for restructuring soot aggregates.
Copyright © 2020 American Association for Aerosol Research
EDITOR:
1. Introduction
Atmospheric soot is a major environmental pollutant, which has a negative impact on human health, being a carrier of toxic chemical agents causing cancer, respiratory diseases, and cardiovascular dysfunctions (Broday and Rosenzweig Citation2011; Brugge, Durant, and Rioux Citation2007). Furthermore, soot significantly affects Earth’s climate. Airborne soot particles absorb solar radiation (Jacobson Citation2010) and decrease cloudiness in tropics (Ackerman et al. Citation2000). After deposition to the Earth’s surface, soot reduces the reflectivity of snow and ice, enhancing melting (Jacobson Citation2010) and leading to rapid glacier retreat (Xu et al. Citation2009). Due to these effects, soot is the second most significant climate warming agent after carbon dioxide.
The light absorbing and scattering properties of soot aerosol (Zhang et al. Citation2008) and its transport properties strongly depend on the particle morphology, which is rather complex. Immediately after formation, soot nanoparticles are branched fractal aggregates of spherical graphitic monomers, but experiments show that the condensation of vapors on these aggregates often causes their restructuring to compact globules, (Chen et al. Citation2016). Many works have advanced the hypothesis that the surface tension and volume of the liquid coating formed around the soot aggregate are principle factors controlling its restructuring (Kütz and Schmidt-Ott Citation1992; Mikhailov et al. Citation2001; Schnitzler, Gac, and Jäger Citation2017; Slowik et al. Citation2007). However, several studies suggest that factors other than the surface tension govern the restructuring process (Chen et al. Citation2018, Citation2016; Miljevic et al. Citation2012).
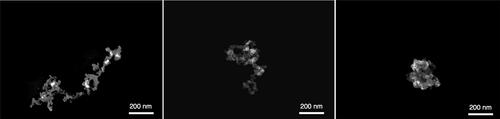
Figure 1. Scanning electron microscopy micrographs of 350 nm initial mobility diameter soot aggregates: fresh soot, coated with anthracene, coated with phenanthrene. While the anthracene coating does not affect the branched fractal structure of the aggregate, the phenanthrene causes its restructuring to a globule.
In particular, our previous work (Chen et al. Citation2018, Citation2016) has shown that restructuring did not depend on the surface tension and could be induced by a very small amount of condensate, corresponding to less than monolayer effective surface coverage. This observation suggested that in certain cases the coating material is not distributed uniformly over the aggregate surface, but instead is preferentially located in small-angle gaps (junctions) between monomers. Thus, the restructuring outcome can be predicted based on the relative rates of condensation in the gaps (“capillary condensation”) versus on the surface of the spheres. Whereas for the vapor condensation on a sphere the treatment of condensation rate is well established under free-molecular, continuum, and transition regimes (Seinfeld and Pandis Citation2006), for capillary condensation the majority of work (e.g., Butt and Kappl (Citation2009) and references cited therein) focused primarily on the equilibrium geometries of menisci and associated capillary forces. Available kinetic work considering capillary condensation (Kohonen, Maeda, and Christenson Citation1999) typically dealt with larger systems, where the process was controlled by diffusion and vapor supersaturation was slightly negative, so that the filling angle of the meniscus remained small, allowing to introduce several simplifying approximations.
To our knowledge, there have been no studies that investigated the competition between capillary condensation and condensation on a sphere. Thus, in the preceding work (Chen et al. Citation2018), we introduced a model for vapor condensation on a soot aggregate made of two spherical primary particles (monomers) that considered two condensation scenarios, with liquid condensate layer (“droplet”) forming either on the surface of the spheres or in the gap between spheres. Which of the two cases is realized depends on the dimensionless parameter χ. This parameter contains information about the diameter of monomer spheres in the aggregate, the supersaturation of condensing vapor, and the molar volume and surface tension of the condensate. It was shown that when the vapor condenses mostly on the surface of the spheres, and the aggregate remains fractal until a thick condensate layer is produced. If
the vapor condenses preferentially in the gap between the spheres, and the soot aggregate restructures promptly. In either case, restructuring is nearly complete when the gap becomes half filled, corresponding to the filling angle of 45° (Chen et al. Citation2018).
Our analytical solution (Chen et al. Citation2018) was derived based on the assumption that the liquid meniscus between the spheres can be approximated by a cylinder for the calculation of its volume and surface area. For the meniscus curvature, the circular approximation was used (Butt and Kappl Citation2009), where only one radius of the two (the smaller, negative radius of curvature) is accounted for. Although common (Kohonen, Maeda, and Christenson Citation1999), this approximation gives an accurate result only when the filling angle is small, leading to deviations from the true curvature at intermediate and larger angles. Since the curvature of the liquid–vapor interface has a significant impact on the rate of condensation, a more rigorous treatment may be required for the meniscus and that is the main focus of this article. Furthermore, although our previous theoretical results were in a qualitative agreement with experimental measurements corresponding to low and high χ, it is not evident whether the approximations would remain valid and the method can be used for quantitative predictions for the cases with intermediate χ.
Here, we introduce and test more accurate approximations of the liquid–vapor interface, the globoid and catenoid, which take into account both radii of the meniscus. These solid shapes can be obtained by rotating an arc of a circle and a catenary curve, respectively, around the axis connecting the centers of two spherical monomers. The main difference between these two shapes is that the catenoid is a constant curvature surface that corresponds to the minimum of energy, whereas the globoid is not. We analyze how using several different approximations affects the rate of condensation, and since capillary forces that induce mechanical loads are very sensitive to the curvature of the interface, we discuss the implications of the choice of the meniscus shape to the aggregate restructuring process.
2. Methods
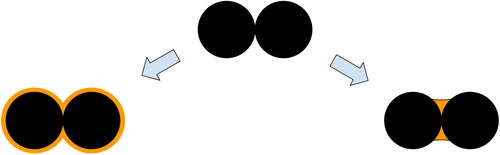
Following our previous work (Chen et al. Citation2018), we consider an aggregate of two spherical monomers in a vapor. This model leads to the two possible scenarios of condensation, which are also the two limiting cases shown in : condensate is distributed uniformly over the entire surface of the dimer or condensate is located in the gap between the two monomers, forming a meniscus. In the latter case, only a small amount of condensate (few percents of the aggregate volume) is needed to fill the gap and induce restructuring, whereas in the former case the gap is filled fully only when the condensate volume fraction reaches about 50% (Chen et al. Citation2018).
Figure 2. Two limiting cases of condensation: formation of a uniform film on the surface of the spheres, and “capillary condensation” – filling the gap between the spheres. The second case is more likely to cause the restructuring of lightly coated soot aggregates.
For the majority of atmospheric soot, the monomer diameter is in the 10–50 nm range (Olfert and Rogak Citation2019), which is smaller than the mean free path of vapor molecules in the vapor-air medium. For instance, Chen et al. (Citation2018) worked with soot aggregates having an average monomer diameter of 28 ± 3 nm. Hence, the condensation takes place in the free-molecular (or kinetic) regime. The rate of growth of a liquid shell or meniscus (referred to as droplet) by vapor condensation will be determined by the following material balance equation:
(1)
(1)
where
(2)
(2)
(3)
(3)
In EquationEquation (2)
(2)
(2) , N is the number of molecules in the droplet,
is the number density of the liquid phase, and V is the volume of the droplet. EquationEquation (3)
(3)
(3) describes the free-molecular flux to the surface of the growing droplet, where α is the molecular accommodation coefficient,
is the mean thermal velocity of the molecules, n0 is the unperturbed vapor number density far from the droplet,
is the number density of saturated vapor near the droplet surface, and A is the area of the droplet. It should be noted that A and V are different for the two cases of condensation considered here. EquationEquation (3)
(3)
(3) suggests that the scenario of condensation is defined by the interplay between surface area A and concentration difference
Obviously
but as shown below,
Thus, the main question is in how the product of the two factors compares for the case of the sphere and the gap.
The pressure of saturated vapor near the droplet surface depends on surface curvature κ according to the Kelvin equation
(4)
(4)
In the above equation
is the saturated vapor pressure at the flat surface (
), γ is the vapor-liquid surface tension,
is the Boltzmann constant, T is the absolute temperature. Assuming the vapor is an ideal gas we can rewrite EquationEquation (4)
(4)
(4) as
(5)
(5)
where
is the number density of the saturated vapor at the flat surface and
the characteristic Kelvin length defined as
(6)
(6)
When
the Kelvin equation can be linearized:
(7)
(7)
The curvature κ, as well as the area A and the volume V are the geometric characteristics of the droplet calculated separately for each scenario. For example, if we consider condensation on a droplet with the shape of a sphere, then its curvature will be equal to
where R is a radius of the sphere. The curvature of the droplet in the gap is discussed in Section 2.2.
Substituting in EquationEquations (2)(2)
(2) and Equation(3)
(3)
(3) and using linearied EquationEquation (7)
(7)
(7) , we can rewrite the material balance EquationEquation (1)
(1)
(1) in the form:
(8)
(8)
where the supersaturation ζ is defined as
(9)
(9)
Moreover, following Chen et al. (Citation2018), we introduce a dimensionless parameter
(10)
(10)
where
is the monomer sphere radius. Thus, EquationEquation (8)
(8)
(8) can be re-written as:
(11)
(11)
In the following, we consider separately solutions of EquationEquation (11)
(11)
(11) for condensation on the sphere and condensation in the gap between two spheres, using different approximations for the curvature to understand what factors control the evolution of the system in each case. The interplay between the three terms (
in EquationEquation (11)
(11)
(11) will determine the dominant regime of condensation, leading to two different outcomes, as depicted in .
2.1. Model for vapor condensation on a sphere
We start with the case of vapor condensation on a sphere (Seinfeld and Pandis Citation2006), where parameters A and in EquationEquations (2)
(2)
(2) and Equation(3)
(3)
(3) and κ in EquationEquation (5)
(5)
(5) are given by the area, volume, and curvature, respectively, of a spherical shell:
(12)
(12)
(13)
(13)
(14)
(14)
Further, for convenience we use dimensionless variables denoting them with a tilde:
(15)
(15)
As one can see, parameters n0,
α,
became incorporated in
Similar to the dimensionless radius, we can introduce the dimensionless area, volume, and curvature:
(16)
(16)
Substituting EquationEquations (15)
(15)
(15) and Equation(16)
(16)
(16) in EquationEquation (11)
(11)
(11) allows us to rewrite it in the dimensionless form:
(17)
(17)
Note that all the physical parameters of the problem are contained in the dimensionless parameters χ and
Here parameter χ determines the scenario of condensation (sphere versus gap) and, therefore, the evolution of the soot aggregate with respect to condensation-induced restructuring (Chen et al. Citation2018). On the other hand, parameter
controls the characteristic rate of condensation.
In the case of condensation on a sphere, the geometrical parameters of the system (EquationEquations (12)–(14)(12)
(12) ) can be rewritten as:
(18)
(18)
(19)
(19)
(20)
(20)
Then, EquationEquation (17)
(17)
(17) can be rewritten bearing in mind EquationEquations (18)–(20)
(18)
(18) as
(21)
(21)
With the natural initial condition
the solution of EquationEquation (21)
(21)
(21) is
(22)
(22)
EquationEquation (22)
(22)
(22) relates time to the radius in an explicit form,
Inverting this dependence to
would describe the evolution of the radius of the droplet growing on a surface of the sphere as a result of condensation.
Since we compare the two limiting regimes of condensation () based on the amount of condensed liquid, N, for convenience, we also express N in the reduced amount formulation
(23)
(23)
In EquationEquation (23)
(23)
(23) , parameter ν is the number of molecules in a droplet in the gap when it is entirely filled (see EquationEquations (26)
(26)
(26) and Equation(27)
(27)
(27) ). Using EquationEquations (2)
(2)
(2) and Equation(19)
(19)
(19) we can rewrite
as:
(24)
(24)
Combining EquationEquations (22)
(22)
(22) and Equation(24)
(24)
(24) , we obtain the time dependence of reduced amount of liquid
which can be compared to the other limiting case presented in Section 3.
2.2. Model for vapor condensation in the gap between the spheres
EquationEquation (11)(11)
(11) obtained above determines the rate of droplet growth irrespective of the droplet geometry. Section 2.1 demonstrates its solution for the condensation on a sphere, while here we focus on the condensation in the gap between two spheres. Unlike the straightforward expressions for volume, area, and curvature for a spherical droplet, this case is more complex.
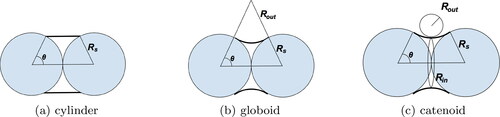
shows the three model geometries for the meniscus at the vapor–liquid interface. The simplest representation is the cylindrical meniscus, which can be easily described in analytical form, and thus further referred to as analytical approximation. However, when we assume that the droplet has a simple rectangular cylinder shape (), this geometry does not take into account the nearly zero contact angle at the solid-liquid interface, which should correspond to the perfect wetting typical of organic liquids on soot (Chen et al. Citation2018). A more realistic meniscus geometry with the correct wetting angle can be achieved assuming that the droplet is a globoid, a body formed by the rotation of an arc of a circle around the line connecting the centers of the monomer spheres, as shown in (Rose Citation1958). However, the curvature of a globoid is not constant throughout its surface, so it does not represent an equilibrium configuration with the minimal surface energy. Therefore, we also introduce the meniscus in the shape of a catenoid, a body arising by rotating a catenary curve about an axis, as a more physical representation which has a constant curvature κ at any point (). For the catenoid, κ is a combination of two varying curvatures related to the two radii:
(25)
(25)
Figure 3. Two-dimensional projections of the three model droplet geometries considered in this work for condensation in the gap. A cylindrical droplet is presented in (a). A more complex case that takes into account the nearly zero contact angle at the solid–liquid interface is illustrated in (b) as a globoid. (c) presents the most realistic shape, a catenoid with the minimal surface area of the fluid in the gap.
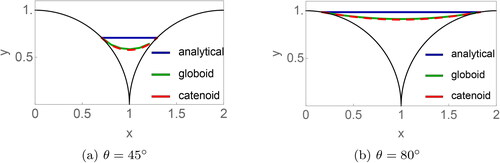
Two-dimensional projections of the three shapes are compared in for the two different values of the filling angle and 80°. The former value was chosen because previous experimental data suggest that restructuring does not require the complete filling of the gap, and likely to occur at 45° (Chen et al. Citation2018). The 80° is chosen to represent a nearly filled gap.
Figure 4. A two-dimensional projection of the liquid profiles for the three approximations considered (analytical, globoid, catenoid) for the angles and
The analytical approximation uses the shape of the cylindrical meniscus but with circular approximation for curvature. The reduced amounts of liquid for 45° are
(analytical),
(globoid, catenoid); for 80°:
(analytical),
(globoid, catenoid).
Irrespective of the approximation chosen for the meniscus, the droplet’s volume is defined by the difference between the volume of the corresponding body and the volumes of the two spherical caps
(26)
(26)
(27)
(27)
where the angle θ is defined between the centers of the two spheres and the three phase contact point. Parameters A, V and κ unambiguously describe each of the geometries in . As in the previous case in Section 2.1, we use dimensionalized parameters of the system (
), taking into account EquationEquations (15)
(15)
(15) , Equation(16)
(16)
(16) , and Equation(23)
(23)
(23) . In the limiting cases θ = 0 (empty gap) and
(completely filled gap), the volumes of all three bodies are equal. Below we derive the expression for
as a function of
which will be further compared to
given by EquationEquations (22)
(22)
(22) and Equation(24)
(24)
(24) , thus comparing the two condensation scenarios.
2.2.1. Analytical approximation: cylindrical shape with circular curvature
The simplest geometry to represent the condensate in the gap would be a cylinder, in which case parameters and
can be readily defined (see ):
(28)
(28)
(29)
(29)
Unlike in the case of condensate on a sphere, the surface of the meniscus formed between two spheres must have a negative curvature. A cylindrical meniscus will not support capillary condensation because its surface curvature is positive. Hence, following our previous work (Chen et al. Citation2018), we used the circular approximation (Butt and Kappl Citation2009) by taking curvature as
() to account for the Kelvin effect, while using the cylindrical shape for
and
Furthermore, following Rose (Citation1958), the curvature can be expressed as a function of the filling angle θ:
(30)
(30)
We refer to this approximation as “analytical” because unlike for other approximations, for this one EquationEquation (17)
(17)
(17) can be solved analytically, giving a closed-form expression for
EquationEquations (18)
(18)
(18) and Equation(19)
(19)
(19) in Chen et al. (Citation2018).
2.2.2. Globoid shape
A more realistic approximation of the droplet shape than the cylinder is globoid, a body formed by rotation of arcs of circles around a line containing the centers of the spheres. For this body, shown in , we obtain the following expressions for geometrical parameters and
(Rose Citation1958):
(31)
(31)
(32)
(32)
For
we used two different approximations. The first follows Rose (Citation1958) and hence is identical to that in the analytical case (EquationEquation (30)
(30)
(30) ). In the second approximation, κ is defined by EquationEquation (25)
(25)
(25) , like in catenoid (), but unlike in catenoid,
is constant, and hence the curvature varies along the meniscus surface. To overcome this issue, we calculated a single curvature for each filling angle θ by averaging over the entire range of
Irrespective of the approximation used for the curvature, for the geometry described by EquationEquations (31)
(31)
(31) and Equation(32)
(32)
(32) , we could not find a closed-form solution of EquationEquation (17)
(17)
(17) .
2.2.3. Catenoid shape
The use of catenoid geometry for the meniscus gives a surface of the minimum energy and constant curvature (), which is a combination of two varying curvatures related to the two radii and
in EquationEquation (25)
(25)
(25) .
Figure 5. A surface of the fluid in the gap between two spheres forms a catenoid (a). For calculation of the curvature of its surface, we use a cylindrical coordinate system – (b). The two radii of curvature, describing the shape, are shown here: inside and outside
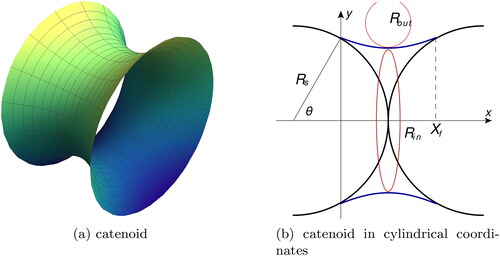
We use cylindrical coordinates to describe the fluid profile () and normalize all the quantities by As a result, we express the curvature of the system as a second-order differential equation with boundary conditions that depend on θ:
(33)
(33)
(34)
(34)
where
For each given θ, the shape y(x) is given by the numerical solution of EquationEquation (33)
(33)
(33) with the boundary condition EquationEquation (34)
(34)
(34) , which is further used to get
and
Prior to presenting the resulting solutions of the equations for kinetics of condensation, we would like to emphasize the consistency of the equations used as a starting point here with the earlier work on the meniscus geometry. In particular, our EquationEquations (31)(31)
(31) and Equation(32)
(32)
(32) are equivalent to EquationEquations (2)
(2)
(2) and Equation(3)
(3)
(3) by Rose (Citation1958) for globoid. They are also similar to the globoid case (EquationEquation (16)
(16)
(16) ) in Butt and Kappl (Citation2009), but not equivalent as Butt and Kappl (Citation2009) considered a meniscus between a sphere and a flat surface. Our equation for the catenoid (EquationEquation (33)
(33)
(33) ) is exactly the same as EquationEquation (2)
(2)
(2) in Lian, Thornton, and Adams (Citation1993) and EquationEquation (2)
(2)
(2) in Duriez and Wan (Citation2017).
3. Results
In the previous section, we introduced two limiting cases of vapor condensation on a model soot aggregate: condensation on a sphere (Section 2.1) and condensation in a gap (Section 2.2). While the former case is straightforward, in the latter case the meniscus shape can be described using three different approximations (analytical, globoid, and catenoid), which may lead to different condensation rates. According to EquationEquation (11)(11)
(11) , the rate of condensation is determined by the interplay between the three major parameters:
and κ. The dependence of these parameters on the filling angle θ within each of the three approximations is shown in .
Figure 6. The key parameters that determine the kinetics of vapor condensation: droplet area (a), volume
(b), derivative of volume
(c), and surface curvature
(d), calculated using different approximations, i.e., circular (for analytical and globoid-circular), globoid, and catenoid.
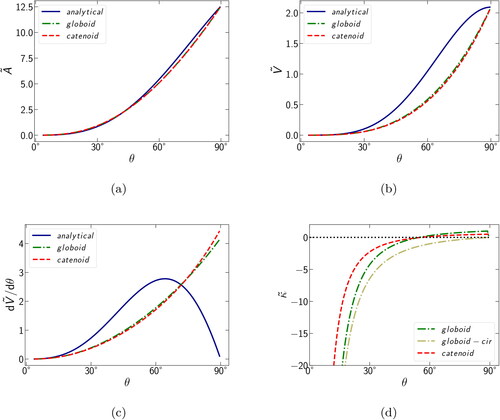
The most striking feature is the excellent agreement between meniscus areas () and volumes () calculated by globoid and catenoid approximations over the entire range of filling angles. The analytical approximation, employing the cylindrical meniscus geometry, produced only a small deviation in the area (for θ between 60° and 85°), but an appreciable deviation in the volume (θ in the range of 30°–90°). In the latter case, the dependence of volume on the filling angle showed sigmoidal rather than exponential profile, resulting in a drastically different behavior of the volume derivative (), that is, whereas the catenoid and globoid approximations predicted a monotonic increase in over the entire range of θ, the analytical approximation produced a maximum at 64° and then a decrease to nearly zero at 90°. Such a significant difference in meniscus volumes between cylindrical and other more realistic approximations can be easily understood by inspecting the two-dimensional projections shown in . At both 45° and 80° filling angles, there is an appreciable concavity in globoid and catenoid menisci, reducing their volume relative to that of the cylinder. However, as the filling angle approaches 90°, menisci of the former two flatten and their volumes catch up with the cylinder. Furthermore, the flat meniscus of the cylinder gains progressively less volume as the filling angle approaches 90°, resulting in the decreasing volume derivative. The globoid and catenoid produce an excellent agreement in their volume derivatives, diverging slightly and only at filling angles in excess of 80°.
For the curvatures calculated using the three different approximations (circular, globoid, and catenoid), the trends are similar, but curves show a noticeable offset with respect to the filling angle (). Also, at a filling angle of the globoid and catenoid curvatures become positive, whereas the circular approximation curvature remains negative, approaching zero when the gap is completely filled (a 90° filling angle). This behavior can be readily explained based on EquationEquation (25)
(25)
(25) . When the filling angle approaches
the values of
and
become comparable, resulting in a zero net curvature. At higher filling angles, as the liquid meniscus nearly fills the gap, the absolute value of
becomes significantly larger than
(the meniscus becomes flat with respect to
), leading to positive κ. Indeed, we estimated that under the constrain of constant κ in EquationEquation (25)
(25)
(25) , at a 10°, 45°, and 80° filling angle, the ratio
is 0.1, 0.7, and 5.1, respectively. However, under the circular approximation,
is always infinitely larger than
resulting in κ that is always negative, asymptotically approaching zero from below. At zero or positive curvatures, capillary condensation cannot be sustained, unless the vapor is supersaturated.
In the following, we compare predictions of the reduced amount of condensate formed as a function of reduced time on the sphere and in the junction between spheres, using different approximations. The predictions were made by solving the material balance EquationEquation (17)(17)
(17) numerically (Mathematica/Python).
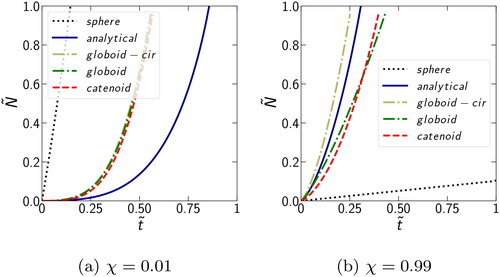
shows the condensation behavior for the two vastly different values of χ = 0.01 and 0.99. Clearly, a significant difference is observed between the “sphere” and “gap” cases irrespective of the approximation used for the fluid profile in the gap. When corresponding to
the highly supersaturated vapor condenses uniformly on the surface of the sphere and
reaches 1 well before any notable condensation in the gap can occur. Although the analytical solution deviates appreciably from globoid and catenoid solutions, it does not matter which type of approximation we use for the condensate in the gap, as the condensation on the sphere is the fastest. In the other limit of
when the supersaturation is low, the vapor condenses preferentially in the gap. In this case, the difference between the most accurate catenoid and the least accurate analytical approximation is small when compared to the difference in the case of
. Also, the analytical approximation is bounded by the most accurate catenoid and globoid approximations on the one side and moderately accurate globoid with circular curvature on the other. This occurs due to a partial cancelation of errors in the terms responsible for the curvature and volume contributions to the condensation rate in the analytical approximation. Thus, in the limiting cases of
and
the simple analytical approximation for the condensate in the gap is sufficient for a reasonably accurate qualitative description of the problem.
Figure 7. Comparison of the dependence of the reduced amount of fluid on reduced time
for condensation on the sphere or in the gap using different meniscus shape approximations: analytical (cylinder + circular), globoid-cir (globoid + circular), globoid, and catenoid.
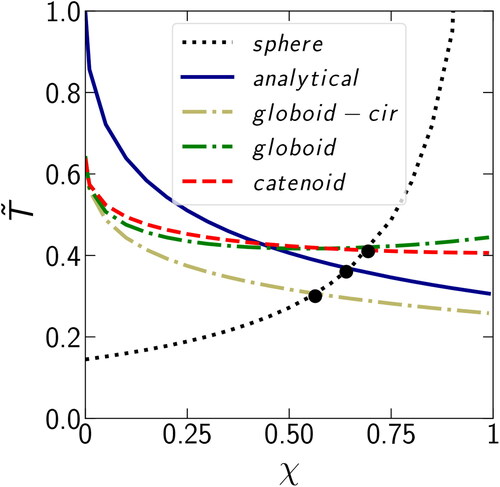
In addition to the limiting cases, we are interested in the intermediate case where the condensation in the two regions occurs at comparable rates, corresponding to the time when the curves representing condensation on the sphere and in the gap cross. The threshold value corresponding to equal amounts of the condensate on the sphere and in the gap can be highly dependent on the chosen approximation for meniscus profile. To determine this threshold value, we introduce dimensionless time
which is the time to condense the amount of vapor corresponding to
shows
as a function of χ. Depending on the approximation, the threshold
varies from 0.56 (globoid with circular curvature) to 0.65 (analytical) and 0.70 (globoid and catenoid). Also, for the limiting case of
both globoids and the catenoid produce similar values of
which are different from the value obtained with the analytical profile. In the case of
the analytical profile falls in between of other curves and all of the curves diverge from one another because condensation in the gap between monomers prevails over condensation on the surface, making the solution sensitive to the meniscus profile.
Figure 8. Dependence of the dimensionless condensation time in the case of completely filled gap (
) for different χ for the two cases of condensation: in the gap or on the sphere. The condensation in the gap is represented using four different approximations: analytical (cylinder with circular curvature), globoid with circular curvature, globoid, and catenoid.
As we mentioned before, three geometrical parameters affect the meniscus’ growth rate κ, A, and For the catenoid and globoid approximations, at higher values of the filling angle κ becomes positive and acts to suppress condensation, but in the two cases that rely on the circular approximation (analytical and globoid-circular), κ remains negative throughout the entire range of the filling angles. The other parameter
shows a nearly opposite effect, decreasing appreciably in the case of analytical approximation when the gap becomes nearly filled, but remaining large in the case of catenoid and globoid approximation. On that basis, one could conclude that for high χ, the curvature effect is higher than the effect of volume change. We would also like to mention that using a more accurate curvature with the analytical approximation (e.g., catenoid or globoid instead of circular) would have defeated the purpose by eliminating error cancelation and producing the largest deviation from the accurate solution (i.e., from the catenoid).
Based on this comparison, we can conclude that the approximation introduced earlier (Chen et al. Citation2018) describes the system sufficiently well to determine the threshold value of with an accuracy of 7%. The accuracy refers to the relative difference between the
predicted by the analytical solution and the catenoid, the most realistic approximation for the shape of the meniscus.
4. Discussion
The evolution of soot aggregates in the atmosphere is complex and involves several processes taking place concurrently, including vapor condensation, generation of stresses at the solid–liquid interfaces, and mechanical response to the stresses that results in restructuring of the aggregates. While some successful efforts to model the mechanical evolution of aggregates have been recently made using different approaches (Laube et al. Citation2018; Schnitzler, Gac, and Jäger Citation2017), the kinetic treatment of vapor condensation on airborne aggregates remains inadequately addressed (Bekki et al. Citation2000; Coelho et al. Citation2000). Our recent work (Chen et al. Citation2018) has shown that an accurate evaluation of vapor condensation kinetics is crucial for predicting the changes in morphology of soot aggregates. In the current work, we further advanced the approach proposed earlier (Chen et al. Citation2018), making it more quantitative. In the following, we discuss some of the assumptions made in our study and their implications.
Our model, as presently formulated, works only for supersaturated vapor. While the initial EquationEquations (1)(1)
(1) , Equation(2)
(2)
(2) , Equation(3)
(3)
(3) , and Equation(5
(5)
(5) ) are applicable for negative supersaturations, we limited the range of supersaturations in EquationEquation (8)
(8)
(8) when introduced the combination
and in EquationEquation (15)
(15)
(15) when introduced the dimensionless time proportional to
The former parameter is commonly used in describing transport to a growing aerosol particle at supersaturated conditions (Grinin, Gor, and Kuni Citation2011; Grinin et al. Citation2004), however, it introduces a discontinuity at ζ = 0, and nonphysical time at
in EquationEquation (15)
(15)
(15) . Thus, our model can be extended to negative supersaturations, but in order to extend the solution, the problem would need to be rewritten in different variables.
Here we describe other assumptions and approximations. We assumed the free-molecular regime for the droplet growth. This is valid when the radius of the droplet is significantly smaller than the mean free path which is the case for a droplet with diameter of the order of the soot monomer (ca. 10 nm). However, the solution presented here can be readily generalized for the transition and continuum regimes.
Next, we assumed that the monomers are spherical in shape and that they are connected with one another in the aggregate at single points (point-touch contacts). This is a common approximation (Chen et al. Citation2018; Laube et al. Citation2015, Citation2018; Leroch and Wendland Citation2013; Schnitzler, Gac, and Jäger Citation2017), and many studies have reported electron microscopy micrographs where soot aggregates were made of almost perfectly spherical monomers in point-touch with one another (Faeth and Köylü Citation1995; Ishiguro, Takatori, and Akihama Citation1997; Megaridis and Dobbins Citation1990; Sarpong et al. Citation2020). The spherical shape is also supported by Monte Carlo simulations of the monomer growth (Kazakov and Frenklach Citation1998; Mitchell and Frenklach Citation1998). However, under certain conditions, such as when soot aggregates are formed during continuing surface growth upon collisions of the monomers that are not yet fully graphitized (Johansson et al. Citation2018), the gaps in soot aggregates can be filled by graphite-like material in the form of necks, and the point-touch approximation may not hold. The degree of necking may depend on the soot source and flame conditions, ranging from significant (Park et al. Citation2003) to negligible (Sarpong et al. Citation2020). The presence of graphitic necks is expected to reduce the amount of condensate.
In our model, we considered condensation on a single monomer and compared it to the condensation in a single gap, while an aggregate includes monomers and
gaps between them. Since in a typical aggregate there are tens to hundreds of monomers,
and
so consideration of the competition between a single monomer and a single gap is fully justified. We consider monodisperse monomers. While the monomers differ in their sizes between different types of soot, the size distribution for a given type of soot is typically very narrow (Olfert and Rogak Citation2019). When the amount of the condensate is small, the forces that drive restructuring are determined by individual menisci between the monomer pairs, that is, single gaps. To investigate the number of monomer connections in realistic soot aggregates, we generated an ensemble of fractal aggregates characterized by a prefactor of 1.3, a fractal dimension of 1.8, and composed of 120 monomers each, using the Fracmap code (Chakrabarty et al. Citation2009). Analysis of these fractal aggregates showed that most of the monomers (47%) had only two neighbors, 28% had one neighbor, and only 22% had three neighbors and 2% had four. Thus, our two-monomer assumption for the gap holds for 75% of monomers (those with one and two neighbors), as long as the filling angle is below 90°. However, when the amount of the condensate increases, menisci can spread over more than one monomer pair, and for the monomers with three or more neighbors this will occur when the filling angle reaches about 30°. Furthermore, the number of contacts will certainly increase as the aggregate restructures and becomes more compact. These effects may have a significant impact and will be considered in future work.
Presently, we consider perfect wetting, that is, a contact angle of zero. This assumption is based on the experimental work (Chen et al. Citation2018), which shows that all the condensates considered here, mostly organic liquids, show nearly complete wetting of graphite surfaces. The equilibrium configurations of menisci formed during the interaction of subsaturated water vapor with a pair of graphitic spheres with different wetting angles have been previously addressed by Crouzet and Marlow (Citation1995).
We assumed that condensation only occurs either on the sphere or in the gap between the monomers. However, at the intermediate values the condensation should be taking place simultaneously in both regions. Thus, a more rigorous solution should include a superposition of the two processes, which is not presently considered. Also, the atmosphere contains thousands of different condensable vapors, hence in future work multi-component vapors and multi-component liquid menisci must be considered.
When discussing the competition between condensation on the monomer surface and in the gap, we compared the times necessary to reach a full gap (). However, the curvature does not change significantly at higher filling angles and also soot aggregates become nearly completely restructured already at
(Chen et al. Citation2018), corresponding to
Hence, we repeated the calculation described in Section 2 for the gap filling of
and found that
is less dependent on the choice of the fluid profile at lower filling angles. shows the time
to fill the gap to
as a function of χ, obtained using different approximations. The values of
here are closer to each other (with a maximum span of 0.11) than in the case of
where the maximum span was 0.13 (). Thus, the conclusions drawn here are not sensitive to the choice of the gap filling angle.
Figure 9. The condensation time as a function of the parameter χ (at
) for condensation in the gap between two monomers and on the sphere. A scenario of condensation in the gap is illustrated using different approximations: analytical (a cylinder with circular curvature), globoid (with circular curvature), globoid, and catenoid.
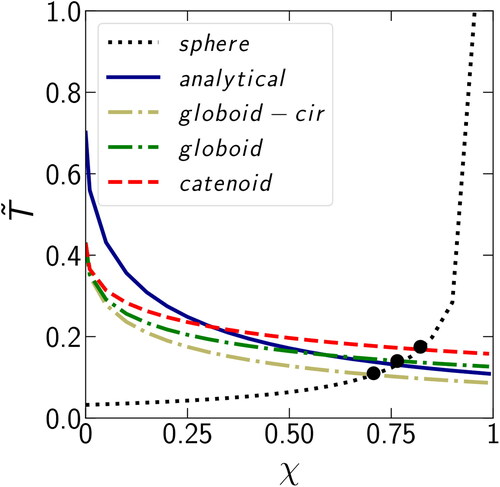
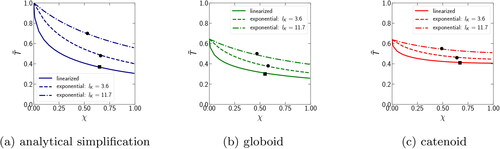
Figure A1. The dependence of the dimensionless condensation time on the dimensionless parameter χ for the linearized (solid line) and exponential (dashed line) representations of the Kelvin term. The dashed curves correspond to the boundary values
and 11.7. Condensation between monomers is described using three different approximations of the meniscus profile: (a) analytical approximation; (b) globoid; (c) catenoid. Bold black dots correspond to the transition value of the parameter
when the amounts of condensate formed in the gap and on the sphere are equal.
One more assumption is the linearization of the Kelvin equation (EquationEquation (7)(7)
(7) ) that is valid only in the case of
when the radius of the drop noticeably exceeds the Kelvin length. The choice of the free-molecular regime for condensation constrains R from above, whereas the linearization imposes a constrain from below, narrowing down the valid range of droplet sizes in our model. Also, the linearized form cannot be used to investigate cases with negative χ, for example, when the vapor is subsaturated (
). When the Kelvin equation is linearized, the system can be described by a single dimensionless parameter χ, but if we keep EquationEquation (7)
(7)
(7) in the exponential form, then it is necessary to introduce a second parameter to fully define the system:
(35)
(35)
The condensation on a sphere, described in Section 2.1 by EquationEquation (21)
(21)
(21) can be written for the non-linearized case as:
(36)
(36)
The presence of an additional parameter Λ here, in comparison with its linearized form EquationEquation (21)
(21)
(21) , does not allow to obtain an analytical solution. However, Λ is fixed for each considered system, since it represents the ratio of the Kelvin length
(which can be estimated for each vapor (see Table 1 in Chen et al. [Citation2018]) to the radius of the monomer
Thus, for each vapor, EquationEquation (36)
(36)
(36) can be considered as a one-parameter equation. By comparing non-linearized and linearized cases, we found that the linearization of the Kelvin equation does not appreciably affect the predictions of the condensation time (see the appendix for details). This means that the results presented by Chen et al. (Citation2018) remain valid over a wide range of
However, an advantage of using the non-linearized equation is that it is applicable to cases with negative χ, for example, when the condensing vapor is subsaturated and ζ < 0.
Continuing our recent work (Chen et al. Citation2018), the current study makes another step toward developing a complete model for soot aggregate restructuring by introducing a more accurate description of the meniscus curvature in evaluating the kinetics of vapor condensation. The next step will be the quantification of forces induced by the condensate located in the gaps and on the monomer surfaces. Previous work has identified three scenarios of aggregate restructuring (Kütz and Schmidt-Ott Citation1992). In the first scenario, liquid condensate in the gaps changes the interaction between the monomers, so that they can slide and roll relative to each other, altering the shape of the original fractal aggregate (Kütz and Schmidt-Ott Citation1992). The second scenario concerns with menisci that are sufficiently large to span over several monomers, resulting in stronger forces that minimize the condensate surface free energy by producing more compact aggregates (Khalizov et al. Citation2009; Kütz and Schmidt-Ott Citation1992). The last scenario is the “aggregate in a drop”, where restructuring occurs during condensate evaporation and the contracting droplet shell induces the full compaction of the aggregate (Ma et al. Citation2013). Note that our present work considered only the individual menisci corresponding to the first scenario, a situation that applies to lightly coated aggregates.
5. Conclusion
Experiments show that soot aggregates can restructure as a result of the deposition of a small amount of condensate on their surface (Chen et al. Citation2016). If that amount were to be distributed uniformly, then the thickness of the condensate film would have been less than a monolayer. This observation suggests that the condensate causing restructuring is localized in the gaps between spherical monomers. In this work we considered the model for competitive condensation of supersaturated vapor on a soot nanoparticle aggregate composed of monodisperse spheres, which is perfectly wetted by the condensate. We studied two limiting condensation scenarios that occurred either on a single spherical monomer or between two monomers, hypothesizing that only the latter results in the restructuring of lightly coated aggregates. The transition between these two cases can be evaluated using the parameter χ, as proposed in our previous study (Chen et al. Citation2018): leads to the condensation on the sphere and
corresponds to the condensation in the gap. By calculating the dependence of the reduced amount of liquid versus reduced time, we evaluated a threshold
separating the two cases of condensation. In order to make the model more quantitative and consider the intermediate values of χ, we tested several approximations for the curvature of the condensate in the gap that ranged from circular approximation to more rigorous globoid and catenoid approximations. The rigor comes at the cost of the lack of closed-form solutions. However, by solving the problem numerically, we found that the least rigorous analytical approximation introduced earlier (Chen et al. Citation2018) did not deviate significantly from the most rigorous model. Thus, the analytical approximation is often sufficient for the analysis of experimental data and qualitative predictions.
Acknowledgments
We would like to thank Ogochukwu Enekwizu for the images of soot used in , as well as for multiple fruitful discussions. We thank Divjyot Singh for performing statistical analysis of the monomer neighbors in fractal aggregates.
Additional information
Funding
References
- Ackerman, A. S., O. Toon, D. Stevens, A. Heymsfield, V. Ramanathan, and E. Welton. 2000. Reduction of tropical cloudiness by soot. Science 288 (5468):1042–7. doi:https://doi.org/10.1126/science.288.5468.1042.
- Bekki, S., C. David, K. Law, D. M. Smith, D. Coelho, J.-F. Thovert, and P. M. Adler. 2000. Uptake on fractal particles: 2. Applications. J. Geophys. Res. 105 (D3):3917–28. doi:https://doi.org/10.1029/1999JD900816.
- Broday, D. M., and R. Rosenzweig. 2011. Deposition of fractal-like soot aggregates in the human respiratory tract. J. Aerosol Sci. 42 (6):372–86. doi:https://doi.org/10.1016/j.jaerosci.2011.03.001.
- Brugge, D., J. L. Durant, and C. Rioux. 2007. Near-highway pollutants in motor vehicle exhaust: a review of epidemiologic evidence of cardiac and pulmonary health risks. Environ. Health 6 (23):1–12. doi:https://doi.org/10.1186/1476-069X-6-23.
- Butt, H.-J., and M. Kappl. 2009. Normal capillary forces. Adv. Colloid Interf. Sci. 146 (1–2):48–60. doi:https://doi.org/10.1016/j.cis.2008.10.002.
- Chakrabarty, R. K., M. A. Garro, S. Chancellor, C. Herald, and H. Moosmüller. 2009. FracMAP: A user-interactive package for performing simulation and orientation-specific morphology analysis of fractal-like solid nano-agglomerates. Comput. Phys. Commun. 180 (8):1376–81. doi:https://doi.org/10.1016/j.cpc.2009.01.026.
- Chen, C., O. Y. Enekwizu, X. Fan, C. D. Dobrzanski, E. V. Ivanova, Y. Ma, G. Y. Gor, and A. F. Khalizov. 2018. Single parameter for predicting the morphology of atmospheric black carbon. Environ. Sci. Technol. 52 (24):14169–79. doi:https://doi.org/10.1021/acs.est.8b04201.
- Chen, C., X. Fan, T. Shaltout, C. Qiu, Y. Ma, A. Goldman, and A. F. Khalizov. 2016. An unexpected restructuring of combustion soot aggregates by subnanometer coatings of polycyclic aromatic hydrocarbons. Geophys. Res. Lett. 43 (20):11,080–9. doi:https://doi.org/10.1002/2016GL070877.
- Coelho, D., S. Bekki, J.-F. Thovert, and P. M. Adler. 2000. Uptake on fractal particles: 1. Theoretical framework. J. Geophys. Res. 105 (D3):3905–16. doi:https://doi.org/10.1029/1999JD900815.
- Crouzet, Y., and W. H. Marlow. 1995. Calculations of the equilibrium vapor pressure of water over adhering 50–200-nm spheres. Aerosol Sci. Technol. 22 (1):43–59. doi:https://doi.org/10.1080/02786829408959727.
- Duriez, J., and R. Wan. 2017. Contact angle mechanical influence in wet granular soils. Acta Geotech. 12 (1):67–83. doi:https://doi.org/10.1007/s11440-016-0500-6.
- Faeth, G., and Ü. Ö. Köylü. 1995. Soot morphology and optical properties in nonpremixed turbulent flame environments. Combust. Sci. Technol. 108 (4–6):207–29. doi:https://doi.org/10.1080/00102209508960399.
- Grinin, A. P., G. Y. Gor, and F. M. Kuni. 2011. On the theory of aerosol particle growth: Non-steady transport problems. Atmos. Res. 101 (3):503–9. doi:https://doi.org/10.1016/j.atmosres.2010.10.007.
- Grinin, A. P., A. K. Shchekin, F. M. Kuni, E. A. Grinina, and H. Reiss. 2004. Study of nonsteady diffusional growth of a droplet in a supersaturated vapor: Treatment of the moving boundary and material balance. J. Chem. Phys. 121 (1):387–93. doi:https://doi.org/10.1063/1.1740752.
- Ishiguro, T., Y. Takatori, and K. Akihama. 1997. Microstructure of diesel soot particles probed by electron microscopy: First observation of inner core and outer shell. Combust. Flame 108 (1-2):231–4. doi:https://doi.org/10.1016/S0010-2180(96)00206-4.
- Jacobson, M. Z. 2010. Short-term effects of controlling fossil-fuel soot, biofuel soot and gases, and methane on climate, arctic ice, and air pollution health. J. Geophys. Res. 115 (D14). doi:https://doi.org/10.1029/2009JD013795.
- Johansson, K., M. Head-Gordon, P. Schrader, K. Wilson, and H. Michelsen. 2018. Resonance-stabilized hydrocarbon-radical chain reactions may explain soot inception and growth. Science 361 (6406):997–1000. doi:https://doi.org/10.1126/science.aat3417.
- Kazakov, A., and M. Frenklach. 1998. Dynamic modeling of soot particle coagulation and aggregation: Implementation with the method of moments and application to high-pressure laminar premixed flames. Combust. Flame 114 (3–4):484–501. doi:https://doi.org/10.1016/S0010-2180(97)00322-2.
- Khalizov, A. F., R. Zhang, D. Zhang, H. Xue, J. Pagels, and P. H. McMurry. 2009. Formation of highly hygroscopic soot aerosols upon internal mixing with sulfuric acid vapor. J. Geophys. Res. 114 (D5):1–15. doi:https://doi.org/10.1029/2008JD010595.
- Kohonen, M., N. Maeda, and H. Christenson. 1999. Kinetics of capillary condensation in a nanoscale pore. Phys. Rev. Lett. 82 (23):4667–70. doi:https://doi.org/10.1103/PhysRevLett.82.4667.
- Kütz, S., and A. Schmidt-Ott. 1992. Characterization of agglomerates by condensation-induced restructuring. J. Aerosol Sci. 23:357–60. doi:https://doi.org/10.1016/0021-8502(92)90423-S.
- Laube, J., V. Baric, S. Salameh, L. Madler, and L. C. Ciacchi. 2018. A new contact model for the discrete element method simulation of tio2 nanoparticle films under mechanical load. Granular Matter. 20 (2):28. doi:https://doi.org/10.1007/s10035-018-0799-9.
- Laube, J., S. Salameh, M. Kappl, L. Madler, and L. Colombi Ciacchi. 2015. Contact forces between tio2 nanoparticles governed by an interplay of adsorbed water layers and roughness. Langmuir 31 (41):11288–95. doi:https://doi.org/10.1021/acs.langmuir.5b02989.
- Leroch, S., and M. Wendland. 2013. Influence of capillary bridge formation onto the silica nanoparticle interaction studied by grand canonical monte carlo simulations. Langmuir 29 (40):12410–20. doi:https://doi.org/10.1021/la402002f.
- Lian, G., C. Thornton, and M. J. Adams. 1993. A theoretical study of the liquid bridge forces between two rigid spherical bodies. J. Colloid Interf. Sci. 161 (1):138–47. doi:https://doi.org/10.1006/jcis.1993.1452.
- Ma, X., C. D. Zangmeister, J. Gigault, G. W. Mulholland, and M. R. Zachariah. 2013. Soot aggregate restructuring during water processing. J. Aerosol Sci. 66:209–19. doi:https://doi.org/10.1016/j.jaerosci.2013.08.001.
- Megaridis, C. M., and R. A. Dobbins. 1990. Morphological description of flame-generated materials. Combust. Sci. Technol. 71 (1–3):95–109. doi:https://doi.org/10.1080/00102209008951626.
- Mikhailov, E. F., S. S. Vlasenko, L. Krämer, and R. Niessner. 2001. Interaction of soot aerosol particles with water droplets: Influence of surface hydrophilicity. J. Aerosol Sci. 32 (6):697–711. doi:https://doi.org/10.1016/S0021-8502(00)00101-4.
- Miljevic, B., N. C. Surawski, T. Bostrom, and Z. D. Ristovski. 2012. Restructuring of carbonaceous particles upon exposure to organic and water vapours. J. Aerosol Sci. 47:48–57. doi:https://doi.org/10.1016/j.jaerosci.2011.12.005.
- Mitchell, P., and M. Frenklach. 1998. Monte carlo simulation of soot aggregation with simultaneous surface growth-why primary particles appear spherical. Proc. Combust. Inst. 27 (1):1507–14. doi:https://doi.org/10.1016/S0082-0784(98)80558-4.
- Olfert, J., and S. Rogak. 2019. Universal relations between soot effective density and primary particle size for common combustion sources. Aerosol Sci. Technol. 53 (5):485–92. doi:https://doi.org/10.1080/02786826.2019.1577949.
- Park, K., F. Cao, D. B. Kittelson, and P. H. McMurry. 2003. Relationship between particle mass and mobility for diesel exhaust particles. Environ. Sci. Technol. 37 (3):577–83. doi:https://doi.org/10.1021/es025960v.
- Rose, W. 1958. Volumes and surface areas of pendular rings. J. Appl. Phys. 29 (4):687–91. doi:https://doi.org/10.1063/1.1723251.
- Sarpong, E., D. Smith, R. Pokhrel, M. N. Fiddler, and S. Bililign. 2020. Refractive indices of biomass burning aerosols obtained from African biomass fuels using RDG approximation. Atmosphere 11 (1):62. doi:https://doi.org/10.3390/atmos11010062.
- Schnitzler, E. G., J. M. Gac, and W. Jäger. 2017. Coating surface tension dependence of soot aggregate restructuring. J. Aerosol Sci. 106:43–55. doi:https://doi.org/10.1016/j.jaerosci.2017.01.005.
- Seinfeld, J. H., and S. N. Pandis. 2006. Atmospheric chemistry and physics: From air pollution to climate change. 2nd ed. New York: John Wiley & Sons.
- Slowik, J. G., E. S. Cross, J.-H. Han, J. Kolucki, P. Davidovits, L. R. Williams, T. B. Onasch, J. T. Jayne, C. E. Kolb, D. R. Worsnop, et al. 2007. Measurements of morphology changes of fractal soot particles using coating and denuding experiments: Implications for optical absorption and atmospheric lifetime. Aerosol Sci. Technol. 41 (8):734–50. doi:https://doi.org/10.1080/02786820701432632.
- Xu, B., J. Cao, J. Hansen, T. Yao, D. R. Joswia, N. Wang, G. Wu, M. Wang, H. Zhao, W. Yang, et al. 2009. Black soot and the survival of Tibetan glaciers. Proc. Natl. Acad. Sci. USA 106 (52):22114–8. doi:https://doi.org/10.1073/pnas.0910444106.
- Zhang, R., A. F. Khalizov, J. Pagels, D. Zhang, H. Xue, and P. H. McMurry. 2008. Variability in morphology, hygroscopicity, and optical properties of soot aerosols during atmospheric processing. Proc. Nat. Acad. Sci. 105 (30):10291–6. doi:https://doi.org/10.1073/pnas.0804860105.
Appendix
Here, we present a numerical calculation for the non-linearized case of EquationEquation (36)(36)
(36) , describing the kinetics of condensation on a particle. As mentioned in Section 4, EquationEquation (36)
(36)
(36) contains two parameters, χ and Λ, where the latter can be calculated from the Kelvin length
and the radius of the sphere
(e.g., Table 1 in Chen et al. [Citation2018]):
Thus, for any given type of soot (
) and condensing vapor (
), the kinetics of condensation depends only on χ.
The result of the numerical calculation is presented as where
is the dimensionless time needed to completely fill the gap between two monomers, that is,
The calculation is performed via the following steps:
Using
and
Using χ and τ, calculate the dependence
Solve EquationEquation (2)
Using the data from steps (II) and (III), obtain the numerical dependence
Obtain
The results of our numerical calculations are presented in , which compares the linearized case against the non-linearized (“exponential”) case for the two extreme values of from Chen et al. (Citation2018): 3.6 nm and 11.7 nm. Based on , we can analyze the effect of linearization on the accuracy of the condensation rate predictions for different meniscus profile approximations. The use of linearization in the analytical approximation () leads to a significant deviation from non-linearized curves. For a fixed χ, the value of
for the exponential and linearized cases can differ almost twice. However, when using more accurate liquid meniscus profiles, globoid () and catenoid (), there is a better agreement between the linearized and non-linearized cases not only for small, but also for large values of
Overall, among the three cases, linearizing the Kelvin term has the least impact on the accuracy for the catenoid.