
 ?Mathematical formulae have been encoded as MathML and are displayed in this HTML version using MathJax in order to improve their display. Uncheck the box to turn MathJax off. This feature requires Javascript. Click on a formula to zoom.
Abstract
During respiration-based activities, possibly ejected microorganisms such as viruses pass from an infected subject to a target person through aerosol droplets. Research focused mostly on the mechanisms of aerosol generation, the droplet size, initial velocity, velocity and size distribution, the indoor aerosol propagation. We here consider the saliva aerosol associated with breath and light cough chosen since they are the standard and much common, gentle respiratory activities. We study the propagation in stagnant air of such aerosols from a point placed ahead of the mouth at a distance from it such that we can approximate the ejecta as a non-turbulent flux. We focus on different outdoor environments for selected weather conditions. We analyze the free fall of droplets (diameter, 5 µm to 200 µm), verifying whether they evaporate, or they impact on the ground, for different environment temperature, pressure, and relative humidity values. We provide a two-dimensional description of the evaporation path and of the dynamics of droplets (diameter, 5 µm to 100 µm) either moving within the air flux associated with the aerosol, or settling out of it and experiencing free fall through air. Calculated droplet propagation distances with the boundary conditions for the considered environments can be useful when discussing prevention measures to limit airborne transmission of pathogens.
Copyright © 2020 American Association for Aerosol Research
EDITOR:
Introduction
Associated to human respiratory activities, which, besides breathing, include talking, coughing, sneezing, saliva droplets are ejected predominantly from the mouth, being scattered within a volume of air. The investigation of exhaled aerosol indicates since long (Wells Citation1934) that it consists of a mixture of saturated water vapor and droplets spanning a wide range of sizes, number densities and initial velocities. Experimental observations that rely on different techniques, mostly based on imaging (Scharfman et al. Citation2016) and on scattering of laser radiation by emissions produced both by healthy and by infected subjects confirm, adopting realistic protocols (Dudalski et al. Citation2020; Kwon et al. Citation2012) the aerosol nature of such emissions. Data for the volume of ejected gas (Gupta, Lin, and Chen Citation2009), the total number of droplets (Anfinrud et al. Citation2020), the associated size distribution (Lindsley et al. Citation2015), the initial emission velocity of the aerosol (Gupta, Lin, and Chen Citation2009) are available. Recent studies (Bourouiba, Dehandschoewercker, and Bush Citation2014) demonstrate that, in the case of sneeze and of a violent cough, all the stages of flux propagation are turbulent. Here we specifically concentrate on normal breath and light cough, that we define as one produced during a single, mild throat clearing cough. We focus on the above couple of respiratory activities to which is associated a faint ejected air flux. Although considered low risk by the layman who neglects prevention practices, such activities are widespread, thus the cumulative risk of airborne transmission of a disease may be consistent. The problem of droplet amount, size and size evolution during aerosol propagation was studied and modeled (Duguid Citation1945; Fuchs, Pratt, and Sabersky Citation1960; Höppe Citation1981; Johnson et al. Citation2011; Loudon and Roberts Citation1967; Morawska et al. Citation2009) in particular because it is considered relevant for an understanding of the transport and spread of a virus released from an infected person via inter person close distance contact (Dudalski et al. Citation2020; Fabian et al. Citation2011; Lindsley et al. Citation2012; Vansciver, Miller, and Hertzberg Citation2011; Wang et al. Citation2005; Xie et al. Citation2007; Yang et al. Citation2007). For an overview on droplet physics as related to pathogen transmission see (Drossinos and Stilianakis Citation2020). Apart from direct subject-to-subject transmission of infective secretions, the spread is believed to occur either via large droplets, or via small droplets, down to droplet residues (Siegel et al. Citation2007). A small droplet is transported in the air flux through a thermal bath at constant temperature (T) and relative humidity (RH), while it evaporates undergoing temperature and mass changes, up to complete drying at a distance where only its residue, if any, remains (Morawska et al. Citation2009). A large droplet earlier, or later, depending on its size, settles out of the air flux and experiences a gravity driven, ballistic, comparatively short-range, free fall trajectory through a viscous medium. Again, depending on the size, it will, or it will not completely dry before impacting on the ground. An estimate of the average sizes of droplets emitted during respiratory activities is delicate. Early experiments on the abundance and average size of exhaled species relied on counting droplets after their deposition on a glass slide, or on a culture plate placed in front of the mouth (Duguid Citation1945; Wells Citation1934). Alternatively, by high speed dark field technique pictures of the droplets were taken (Jennison Citation1942). The belief that the size of most of human generated droplets lie in the few-to-several microns range (Duguid Citation1945) was later attributed to the insensitivity of the detection techniques to small (less than 1 µm) particles. Recent studies, despite the use of more sensitive techniques, such as aerodynamic particle sizing, based on laser interferometry and diffraction (Morawska et al. Citation2009; Yang et al. Citation2007), optical particle counting (Johnson et al. Citation2011; Papineni and Rosenthal Citation1997), wide range particle spectrometry (Lindsley et al. Citation2012) met large variations in the number, the size and the size distribution of aerosol particles ejected by individuals (Lindsley et al. Citation2012; Scharfman et al. Citation2016). This can explain the different thresholds proposed to define large droplets, ranging from diameters larger than 100 µm (Wells Citation1934), to larger than 5 µm (Mangili and Gendreau Citation2005). There is a further source of uncertainty associated to define a large droplet, since it is assumed to propel a short distance from the source person before being deposited possibly on the host’s conjunctivae, or nose mucosa, or mouth. Such a distance is placed at 1 to 2 m (Embil et al. Citation2003; Langley Citation2005; Xie et al. Citation2007). Here, we assume that droplets in the human aerosols of our concern span the range of diameters from 1.0 µm to 200 µm.
As to the composition and the physical properties of the droplets, considering saliva droplets a variability is reported that results in different evaporation kinetics, thermal conductivity, and heat absorptivity of the droplets. In most studies saliva is modeled as a water solution with an initial salt (NaCl) concentration ranging from 0.3% to 0.9% mass fraction (Schipper, Silletti, and Vingerhoeds Citation2007).
The number density of large droplets is higher in ejecta associated to violent coughing, or sneezing, (Han, Weng, and Huang Citation2013) being possibly deposited onto mucous membranes. A small droplet acts as airborne infector carrier that experiences a thermodynamic history, basically including evaporation, temperature and mass changes while it flies in the air flux through a thermal bath at constant temperature and relative humidity until it reduces to a residue (Xie et al. Citation2009). Although a virus possibly carried by the residue can survive different times, mostly depending on environment conditions and on the specific disease, here we neglect the fate of residues. For airborne transmitted diseases, the risk of infection is considerable with asymptomatic, infected subjects (Fox, Hall, and Elveback Citation1972).
Taking the recent case of SARS-CoV-2 infection as a relevant, but not exclusive example it was ascertained that although the virus diameter ranges from 50 to 200 nm (Guzman Citation2020) the infection spreads through inhalation, or ingestions of contaminated droplets (Morawska and Cao Citation2020). Again for SARS-CoV-2, over a cohort of 500 adults from the Milan, Bergamo, Cremona and Lodi areas (Lombardy, Italy) males (about 40%) and females (about 60%), aged from 25 to 70, according to different antibody tests (IgG and IgM; ACRO Rapid test, ACRO Biotech, INC; Cellex Q rapid Test; LIAISON®RSARS-CoV-2 S1/S2 IgG test) performed in late May, 2020, 6% were positive (n = 34), while uncertain results were 4% (n = 17). Over the same population 1% at the most were positive according to laboratory test, while fully asymptomatic (R. Mantegazza, email to P.M. Ossi, June 10, 2020). Although this fraction is rather small, there is a further important risk of infection associated with the incubation time. For SARS-CoV-2, the latter is estimated to range between 2.0 days and 6.4 days (Backer, Klinkenberg, and Wallinga Citation2020), with large variations among patients, up to reported outliers of 24 days (Guan et al. Citation2020). For a number of viruses, during the incubation there is a time interval when the infected person is presymptomatic and is already contagious. For SARS-CoV-2 such a time window if there is, is presently unknown. Besides adopting masks, social distancing is recommended, with the aim to significantly reduce the probability of disease transmission. Again, for SARS-CoV-2 the practical rule of 1 m (or 3 ft) inter-person distance is presently adopted (Deller et al. Citation2008) since airborne transmission is one of the relevant paths of virus spread (Zhang et al. Citation2020). The above measures are particularly effective since there is growing evidence that the virus, unlike, e.g., flu, propagates via a superspreading mechanism that results in clusters of infection (Adam et al. Citation2020), in which the environmental factors play a relevant role.
In most studies on exhaled aerosol propagation, indoor environments are considered, under temperature and relative humidity conditions fixed and constant upon the introduction of air conditioning (+18 °C < T < +20 °C; 30% < RH < 70%) (Gupta, Lin, and Chen Citation2009; Xie et al. Citation2007). Temperature and relative humidity were analyzed also on wider ranges (+5 °C < T < +35 °C; 10% < RH < 90%) but the effect of the two parameters was considered separately (Li et al. Citation2018). To contribute to a realistic evaluation of useful parameters to be adopted when defining criteria of mitigation measures for outdoor activities of healthy, or asymptomatic individuals, we performed a numerical investigation on the propagation of the aerosol produced by normal breathing and by light coughing in different representative outdoor environments where people gatherings are likely to occur. When holiday activities are considered with the associated relaxation of the individual and social perception of danger, the spread of airborne-transmitted diseases is a real risk. We analyzed a broad range of temperatures and relative humidity, in stagnant air, using data retrieved by public weather stations. We explored the range of distances that droplets of different sizes can fly together with the exhaled air flux, possibly acting as infectious disease transmitters. We show the combined effect of T and RH and their relative weight on the trajectories of the respiratory droplets. We take into account parameters specific of a Summer and of an Autumn day for a city in the North of Italy (Milan), of a Summer and of Winter day for a village located in the Italian Alps (Gressoney St. Jean, Aosta Valley, Italy), and of a Summer day for a small town on the seaside (Levanto, Eastern Liguria coast). Although our choice can appear highly specific, such conditions are devised to consider a typical working day, as well as a Summer and a Winter vacation day throughout regions interested by warm and temperate Mediterranean climate, temperate and warm continental climate and tundra climate. As such they find wider applicability than to Italy.
The physical model for droplet propagation
In normal breath and light cough, a flow consisting of an intimate mixture of saturated water vapor and liquid saliva droplets with an initial size distribution is expelled predominantly from the open mouth. We neglect ejecta from the nose. The flow is ejected with an initial velocity from a virtual source (VS in ) that we assume to be placed 0.1 m behind the position of the mouth (M in ) (xVS = −0.1 m), taken as the coordinate origin.
Figure 1. schematic of the mutual position of the virtual source (VS), the mouth (M), the origin (O); droplet trajectories were calculated from O; the dashed-dotted lines enclose the region through which the aerosol spreads out, as defined by the ejected flux angle θ = 25°. Blue lines, marked c (cough) and b (breath) indicate the space dependent velocity of the ejected flux at the instant tO when the peak of the flux velocity crosses O.
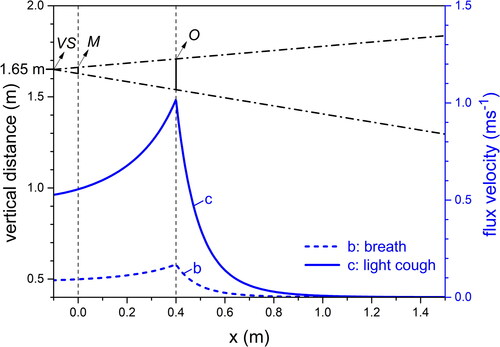
We analyze the velocity and size evolution of the droplets on an xy plane with the x axis parallel and the y axis normal to the ground, respectively. Our analysis starts from an origin (O in ) located 0.4 m ahead of M on the x axis (xO = +0.4 m). This distance corresponds to the onset of the “far field” conditions of propagation (Dudalski et al. Citation2020). Being our analysis confined to normal breath and light cough, a low speed of the associated flux characterizes these respiratory activities. Indeed, the maximum throughput of a light cough is approximately half of that of an average cough (Gupta, Lin, and Chen Citation2009). We neglect turbulence fluctuations because of the low initial velocity we take for both breath and light cough, that is further reduced from the onset of the far field onwards. By contrast, in a high intensity cough, turbulence is important for the spreading of droplets, in particular the small ones, that are transported by eddies (Wei and Li Citation2015). The root mean square of the turbulence fluctuations is about 20% of the mean centerline velocity of the flux (Wei and Li Citation2015). On moving away from the source (mouth) the velocity of the flux reduces. Thus, turbulence fluctuations are more intense in the region close to the mouth, between VS and O (Bourouiba, Dehandschoewercker, and Bush Citation2014). In the dashed-dotted lines that originate from VS define the ejected flux angle θ = 25° (Gupta, Lin, and Chen Citation2009). We consider that the aerosol can spread through the region
(1)
(1)
where hM is the vertical coordinate of the M point (+1.65 m, taken as an average value for humans), xO is the x coordinate of O (+0.4 m) and y the vertical coordinate; the mouth is idealized, with circular shape and diameter 0.02 m (Gupta, Lin, and Chen Citation2009). We assume that the droplets have spherical shape, unaltered along their life and they are mutually non-interacting. The flux propagates ahead of M, it accelerates up to a maximum velocity, then it progressively slows down while expanding through a viscous medium (air) until it asymptotically stops. Exhalations occur from M at different initial velocities: we take a velocity of 1 ms−1 (Xie et al. Citation2007) for normal breathing and of 6 ms−1 (Gupta, Lin, and Chen Citation2009) for light cough. The latter was estimated from the flow rate peak in a second, sequential cough (Gupta, Lin, and Chen Citation2009). We disregard on purpose any role of wind since we are interested in the intrinsic properties of the aerosol propagation. We expect that the presence of wind in the same direction as the aerosol flux will increase the range of distances traveled by the droplets (Feng et al. Citation2020), while an upwind respiratory activity will reduce the droplet range and re-direct them to the source subject.
We calculate the trajectories of saliva droplets of different diameters, by introducing a system of coupled equations following the approach formerly used to study droplet histories in indoor conditions (Xie et al. Citation2007) as follows
(2)
(2)
EquationEquation (2)(2)
(2) describes the variation of the droplet diameter (d) during evaporation, with Mw the water molecular weight, D* the modified (by a coefficient C) binary diffusion coefficient of water into air, pa the air pressure, ρd the droplet mass density, R the gas constant, Tf the absolute temperature of air far from the droplet, pS the partial water vapor pressure at the surface of the droplet, pf the partial water vapor pressure far from the droplet. The evaporation rate is a function of the environment conditions, namely Tf, pa and pf. Sh is the dimensionless Sherwood number that depends on the droplet velocity with respect to that of the surrounding air. We consider that saliva contains dissolved ions and proteins that affect its physicochemical properties of interest (Schipper, Silletti, and Vingerhoeds Citation2007): in particular, the surface tension and thus the viscosity increase, while the evaporation rate decreases with respect to pure water (Zhang Citation2011). The presence of ions and proteins in solution are expected to induce a freezing-point depression. Hence, moving from the measured difference of evaporation rate between water and saliva (Zhang Citation2011) we introduce in EquationEquation (2)
(2)
(2) the factor F = 0.96 to keep into account the different behavior of the two liquids.
We included in the calculation of the evaporation rate () the density variation with temperature of the above modified water. We describe the temperature variation of the droplet (that we consider homogeneous throughout the entire volume) as
(3)
(3)
EquationEquation (3)(3)
(3) provides a balance between the droplet evaporation enthalpy, and the heat exchanged with air across the surface of the droplet (Ka is the thermal conductivity of air). The enthalpic term is approximated by considering the latent heat of evaporation of water, ΔHW. The thermal conduction of the flying droplet to air is adjusted by the Nusselt number Nu that includes the velocity of the droplet with respect to air. Td is the temperature and Cd the heat capacity of the droplet. At variance to (Xie et al. Citation2007) we neglect the Boltzmann radiative heat transfer contribution because in our conditions it is negligible. We assume as the initial droplet temperature +37 °C, coincident with the temperature of the interior of the human body.
We describe pS as a function of Td as (Kukkonen, Vesala, and Kulmala Citation1989)
(4)
(4)
Our version of EquationEquation (4)(4)
(4) is simplified with respect to the original one (Kukkonen, Vesala, and Kulmala Citation1989), yet the pS(H2Oliq) values that we get from EquationEquation (4)
(4)
(4) agree with the experimental pS(H2Oliq) data (Beltramino et al. Citation2020).
The vertical (y) acceleration of the droplet is derived from Newton mechanics
(5)
(5)
with vyd the y component of the droplet velocity, g the gravity acceleration, ρa the air mass density, Fd the aerodynamic friction coefficient of the droplet, vya the y component of air velocity.
We assume vyd = 0 at the initial time at point O.
Similarly, the horizontal (x) acceleration of the droplet is
(6)
(6)
with vxd the x component of the droplet velocity and vxa the x component of air flux velocity. EquationEquations (5)
(5)
(5) and Equation(6)
(6)
(6) describe the droplet velocity along y and x respectively, as resulting from the combined effect of gravitational acceleration (g) and aerodynamic friction (Fd). While flying, the droplet progressively shrinks with respect to its initial diameter d0, so that the relative weight of gravity and aerodynamic friction continuously changes. This couples the equations of motion (Equation5
(5)
(5) ) and (Equation6
(6)
(6) ) with the thermodynamic balance described by EquationEquations (2)
(2)
(2) and Equation(3)
(3)
(3) . The values of C, Sh, Nu, Fd are from (Xie et al. Citation2007) (here we use Fd instead of Cd, to avoid confusion with the symbol we adopt for the droplet heat capacity) and the values of D and Ka are from (Kukkonen, Vesala, and Kulmala Citation1989).
Unlike most studies that consider the moving fluid as a stationary jet (Wang et al. Citation2005; Wei and Li Citation2015; Xie et al. Citation2007), we treat both breath and light cough as an intermittent fluid injection, time and space dependent. In particular, since breathing is characterized by a time lag that separates the end of each respiratory act (exhalation and inhalation) from the beginning of the following one, we focus on one exhalation considered singularly and taken as representative. The behavior of the aerosol gas component (air) is described as a propagation through a stagnant atmosphere with a first stage of fast velocity increase, up to a maximum velocity vm, followed by a progressive velocity decrease. We perform a two-dimensional analysis of gas velocity referring to points VS, M, O in , assuming that gas propagation occurs parallel to the ground and that there are no vertical velocity gradients along y in the region enclosed within the flux angle. We neglect buoyancy effects due to the density difference between the aerosol and atmosphere air. These can result in upward, or downward deviations of the flux that were observed to affect the latter mostly in the turbulent regime (Bourouiba Citation2016; Xie et al. Citation2007). We slightly simplified a recent model that empirically describes the propagation of realistic coughs of any intensity from a distance of at least 15 times the mouth diameter (Dudalski et al. Citation2020). With specific focus on point O (that we placed at a distance from M equal to 20 times the mouth diameter), the maximum air flux velocity vam(x) is:
(7)
(7)
with vM the air flux velocity at M and x0 the coordinate parallel to the ground of O (see ). The time tm required to reach vam is
(8)
(8)
The initial air flux velocity along x at M, vM reduces at O (vO) both for breath and for light cough, as shown in , where the time (tO) required to the peak of the velocity distribution of the air flux to travel from M to O is also reported for the two cases.
Table 1. Air flux velocity at M and O for breath and light cough; tO, calculated time required to the air flux to travel from M to O.
We obtain the time dependence of the air flux velocity both for the initial expansion stage,
(9a)
(9a)
and for the late stage
(9b)
(9b)
At the initial time tO, vdx = vax(xO, tO) = vO. The previous assumption vdy = 0 at tO at point O is a reasonable approximation for small droplets that are dragged by the air flux, while it is rough for increasingly larger droplets that settle out of the flux. The air flux velocity dependence on x, vax(x) at tO is displayed in for breath (curve b) and for light cough (curve c). Following (Wei and Li Citation2015), we estimated the root mean square turbulence velocity fluctuation σ at O, obtaining σ ∼ 0.2 ms−1 for light cough and σ ∼ 0.03 ms−1 for breath. In the case of a cough of considerable intensity with the associated initial velocity of 10 ms−1 (Wei and Li Citation2015) at the exit of the mouth σ ∼ 2 ms−1, 10 times higher than for light cough. Given the low values of the turbulence fluctuation intensities, we deliberately neglect their effect.
Numerical simulations
We solved numerically the set of EquationEquations (2)(2)
(2) , Equation(3)
(3)
(3) , Equation(5)
(5)
(5) , Equation(6)
(6)
(6) and (Equation7
(7)
(7) ) − (Equation9 b
(9b)
(9b) ) by using the Mathematica® software (Wolfram Research Citation2019).
We considered five representative outdoor environments and the associated different weather conditions (temperature, pressure, relative humidity) as retrieved from official data collections of public weather stations, as listed in .
Table 2. Weather conditions for the considered outdoor environments. Data retrieved from CF VDA, Centro Funzionale Regione Autonoma Valle d’Aosta; Arpal, Agenzia Regionale per la Protezione dell’Ambiente Ligure; ARPA Lombardia Servizio Meteorologico Regionale.
To evaluate the atmospheric pressure variation associated to the different altitude of the mountain village (1380 m above sea level, environments c, e in ) we used
(10)
(10)
where p0a is the standard air pressure at sea level, h is the altitude, M the air molar mass (2.9 × 10⁻² kg mol−1). The change of the atmospheric pressure due to altitude has a minor effect on D* and ρa which in turn affects the friction between air and droplets.
Droplet trajectories are calculated from O. The evaporation-fall curves for saliva droplets experiencing free fall are reported in (red, full lines).
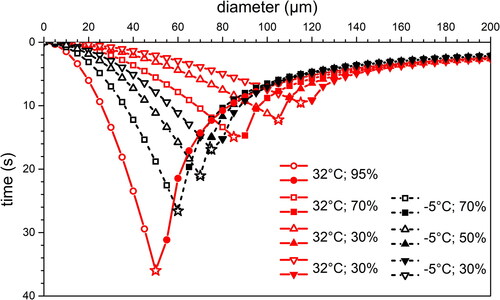
Figure 2. Calculated time required by differently sized (diameter between 5 µm and 200 µm) saliva droplets to fully evaporate, or to fall on the ground under free fall conditions in stagnant air. Red full lines correspond to a city and a seaside small town in Summertime (environments a and b, ); black, dashed lines, correspond to a mountain village in Winter (environment e, ). Open symbols are for droplets that completely evaporate in air; full symbols are for droplets that impact on the ground at the end of their flight; stars are for droplets that evaporate just impacting on the ground.
They refer to outdoor environments (a), (b) and (e) in and to a set of realistic RH values. Notwithstanding our simplification of EquationEquations (2)(2)
(2) , Equation(3)
(3)
(3) , Equation(5)
(5)
(5) , Equation(6)
(6)
(6) we obtain results (not displayed) that superimpose to those in (Xie et al. Citation2007) if we resume the same conditions (height, 2 m; T = +18 °C, pure water, RH = 0%, initial Td = 33 °C) adopted there. For the low temperature curves (black symbols, dashed lines) we neglect the possible liquid-solid phase transition of saliva droplets. Indeed, we performed a simple experiment to check that no droplet freezing occurs in the more unfavorable conditions of normal breathing when smaller droplets are ejected from M at lower velocity. We used a climatic chamber (Model MKF-720, Binder® GMbH, Tuttlingen, Germany) with working temperature range −40 °C < T < +180 °C and RH from 10% to 98%, setting the temperature at −5 °C and RH at 70%, then exhaling with the mouth in contact with a port of the chamber, several well separated, normal breaths directed inside the chamber. We recorded the exhaled vapor on a glass slide placed within the chamber in front of the mouth at a distance of 0.4 m. We did never observe any trace of solidification of vapor constituents. This experimental evidence is rationalized by considering that according to the saturated vapor pressure pS approximation, at temperatures below 0 °C the maximum difference pS(H2Oliq) - pS(H2Oice,Ih) is as low as 30 Pa over the range between −20 °C and 0 °C (Murphy and Koop Citation2005). On these grounds we treat saliva droplets at low (-5 °C) temperature as a supercooled water-like liquid.
We also considered the air component of the aerosol and its temperature variation. A digital thermometer, working between +300 °C and −50 °C, with refresh rate 1 s, placed in the chamber in front of the mouth at a distance of 0.4 m did not record any temperature variation in all the tests with respect to the chamber reference temperature (−5 °C). Thus, air flux thermalization with the atmosphere surrounding O can be assumed even for the most critical condition we tested. Hence, we take that at O the air flux thermalization is complete for all environments.
For droplets between 5 and 200 µm in diameter, free falling from y = +1.65 m, the results of the evaporation histories d(t) are displayed in . In the figure we use the same symbol for the same RH value at both considered temperatures. As expected, at both temperatures, increasing RH progressively reduces the critical droplet size at which the droplet dries out on impacting the ground (stars): the critical diameter shrinking is nearly the same on moving from RH = 70% to RH = 95% as it is moving from RH = 30% to RH = 70%. Considering droplets of the same size, at higher temperature they evaporate faster than at lower temperature. The trend is more evident for smaller droplets, roughly up to 60 µm in diameter, while we observe a superposition of asymptotic behaviors of large droplets (above 130 µm), irrespective of temperature and RH values.
In are shown the trajectories of droplets of different sizes, propagating with aerosols that diffuse in the five different outdoor environments we consider. Here we limit the droplet diameter to the range 5 to 100 µm because droplets with larger size than this threshold fall on the ground at progressively smaller distances from O. In all figures, distances are calculated from O. As expected, for all conditions the qualitative trend of exhaled droplets is the same both for breath and for light cough, with a separation between small, light droplets and large, heavy ones. In all figures we chose a few values of droplet diameter for which we represent the trajectories and the evaporation (impact on ground) points as big full dots (red online). The limiting points, marking evaporation (impact), of droplets with different diameters are shown as open (full) black dots connected by a thin dashed line that encloses the locus of the points where droplet trajectories end.
Figure 3. Calculated trajectories parallel to the ground, starting from O, of differently sized droplets for propagation in outdoor environment typical of a city in Summertime (see , environment a). (b) Breath; (c) light cough. Continuous lines, trajectories of droplets with selected diameters (data in µm; red symbols); open (full) points mark the distance where the droplet evaporates (falls on the ground); dashed-dotted lines indicate the contour of the region through which the aerosol spreads (see text for details).
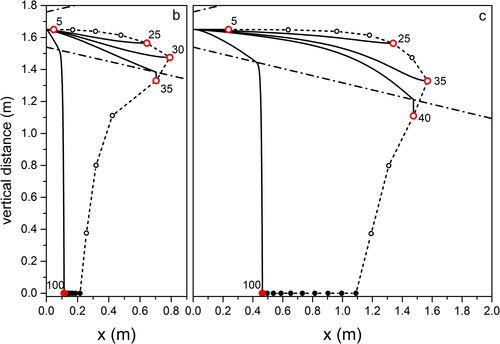
Figure 4. Same as for , for droplet propagation in outdoor environment typical of Seaside in Summertime.
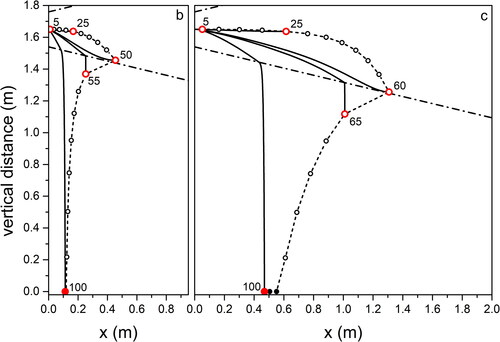
Figure 5. Same as for , for droplet propagation in outdoor environment typical of Mountain in Summertime.
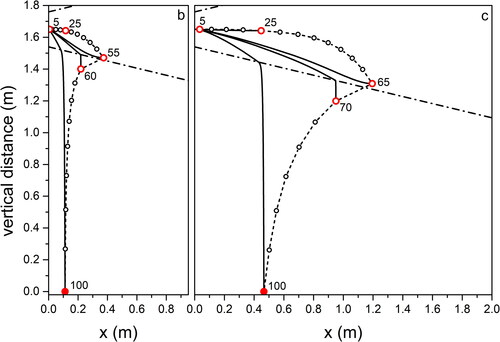
Figure 6. Same as for , for droplet propagation in outdoor environment typical of City in Autumn.
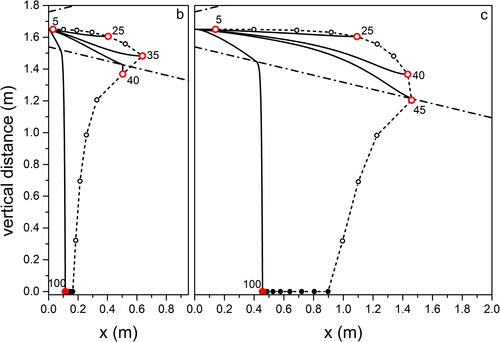
Figure 7. Same as for , for droplet propagation in outdoor environment typical of Mountain in Wintertime.
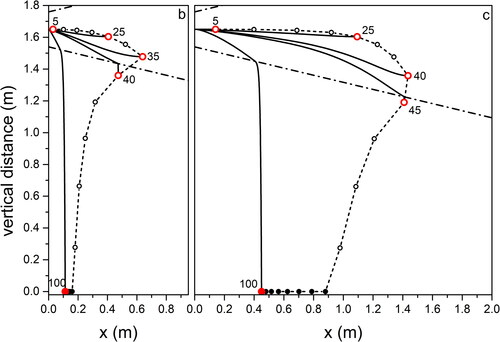
Focusing on light coughs, the maximum traveled distance is found for environment (Summer, city; ) corresponding to high temperature and RH, while the minimum is for environment (Summer, mountain; ) when low RH favors fast droplet evaporation. We obtain almost the same maximum distances traveled by the droplets in environments (Summer, seaside; ) and (Summer, mountain; ). This offers an example of the combined effect of temperature and relative humidity on the droplet evolution. In environment (Summer, mountain; ) the longer evaporation time due to the temperature lower by 7 °C than in environment (Summer, seaside; ) is compensated by the lower RH (50% with respect to 70% in environment [Summer, seaside; ]) that favors evaporation. We remark that considering environment (Summer, mountain; ) we obtain a maximum traveling distance of 1.6 m from the mouth for the 65 µm droplets at the point where they completely dry out. This is very close to the result obtained in (Li et al. Citation2018) for a cough that expands under environmental conditions identical to ours, with a velocity profile quickly vanishing in quiescent air. Droplets with size comparable to ours travel a distance between 1.5 and 1.7 m. Also, in a CFD cough simulation performed with ambient temperature lower than our by 20% (T = 20 °C) (Dbouk and Drikakis Citation2020), the maximum distance droplets can fly does not exceed 2 m at the impact on ground. In all environments, droplets of about 100 µm impact on the ground at about 0.5 m from O on coughing (light), and at about 0.1 m on breathing. Droplets up to about 30 µm fly practically rectilinear in all environments. The maximum distance, about 1.6 m, is traveled by droplets of increasing size with decreasing RH, from environment (Summer, city; ) to (Winter, mountain; ) to (Summer, mountain; ). For a modest temperature decrease, as we observe moving from environment (Summer, city; ) to (Summer, mountain; ), the near halved RH leads to about the same percent size increase (from 35 to 65 µm) of droplets flying the largest distance. The same observations, rescaled to smaller droplet sizes and shorter trajectories, hold for breaths in the different environments, to . Taking into account droplets with 20 µm diameter, about the same for which the highest number density was observed in a cough (18 µm) (Bourouiba, Dehandschoewercker, and Bush Citation2014), we notice that they fly about 1.2 m (Summer, city; ), 0.5 m (Summer, seaside; ), 0.3 m (Summer, mountain; ), 0.9 m (Autumn, city; and Winter, mountain; ) from O.
For droplets propagating up to the largest distances in Winter conditions at low temperature (Winter, mountain; ) we calculated the propagation time from O: 35 µm droplets in a breath fly about 9 s to evaporate at 0.6 m, while 45 µm droplets in a light cough need about 15 s to arrive at 1.4 m. Over such times, that are similar to those required for free fall of equally sized droplets under the same conditions (see ) freezing is not likely to occur. Our results indicate that considering breath, transport of droplets occurs over comparably long distances from the mouth at high temperature and humidity (+32 °C; 95% RH) (about 1.2 m), as well as at low temperature and high humidity (−5 °C; 70% RH) (about 1 m). In terms of social behavior when performing outdoor activities, the above difference appears not relevant. In an analogous way, for a light cough, the longest distances traveled by droplets in the same environments as before increase to about 2 m and 1.8 m, respectively. Again, the difference appears irrelevant. We remark that the assumptions we made on purpose (flux propagation parallel to the ground, absence of wind, absence of turbulence fluctuations) are not fully realistic. In particular, in the case of cough of considerable intensity (Wei and Li Citation2015), and even more for sneeze (Bourouiba, Dehandschoewercker, and Bush Citation2014), the random fluctuations due to turbulence are to be taken into account.
Conclusions
In conclusion, we performed numerical simulations of trajectories of human saliva droplets ejected during normal breathing and light coughing in outdoor Summer, Autumn and Winter conditions. We focused on environment conditions (temperature and relative humidity) typical of a continental Europe city, a small town on the Ligurian Sea and on a village on the Italian Alps.
Our analysis was performed under some simplifying conditions that we recapped at the end of the preceding section. The results show that much attention in social distancing is required in a city in Summer and in Autumn, while Winter outdoor activities in mountain resorts appear particularly delicate. Indeed, people crowding of mounting facilities favors droplet transmission over inter person distances well below the limits calculated here. This is due to limited forced ventilation and exiguous recirculation of outside air in the close environment: gondola lifts and cableways are critical examples. A further source of concern are refreshment places such as bars, huts, restaurants characterized by low ceilings and small windows to avoid heat dispersion, where again air recirculation is deliberately limited, while people gathering is highly likely. Again, referring to the SARS-CoV-2 example, since airborne transmission of the virus is likely to occur (Morawska and Milton Citation2020) the above scenarios are particularly worrying.
Acknowledgments
We are grateful to Dr. R. Mantegazza, Fondazione I.R.C.C.S. Istituto Neurologico “C. Besta”, Milan (Italy) for having made available unpublished results of an ongoing research.
References
- Adam, D. C., P. Wu, J. Y. Wong, E. H. Y. Lau, T. K. Tsang, C. Simon, G. M. Leung, and B. J. Cowling. 2020. Clustering and superspreading potential of SARS-CoV-2 infections in Hong Kong. Nat. Med. Advance online publication. doi:https://doi.org/10.1038/s41591-020-1092-0.
- Anfinrud, P., V. Stadnytskyi, C. E. Bax, and A. Bax. 2020. Visualizing speech-generated oral fluid droplets with laser light scattering. N. Engl. J. Med. 382 (21):2061–3. doi:https://doi.org/10.1056/NEJMc2007800.
- Backer, J. A., D. Klinkenberg, and J. Wallinga. 2020. Incubation period of 2019 novel Coronavirus (2019- nCoV) infections among travellers from Wuhan, China, 20 28 January 2020. Eurosurveillance 25 (5):1–6. doi:https://doi.org/10.2807/1560-7917.ES.2020.25.5.2000062.
- Beltramino, G., L. Rosso, R. Cuccaro, S. Tabandeh, D. Smorgon, and V. Fernicola. 2020. Accurate vapor pressure measurements of supercooled water in the temperature range between 252 K and 273 K. J. Chem. Thermodyn. 141:1–7.
- Bourouiba, L. 2016. Images in clinical medicine. A Sneeze. N. Engl. J. Med. 375 (8):e15. doi:https://doi.org/10.1056/NEJMicm1501197.
- Bourouiba, L., E. Dehandschoewercker, and J. W. M. Bush. 2014. Violent expiratory events: On coughing and sneezing. J. Fluid Mech. 745:537–63. doi:https://doi.org/10.1017/jfm.2014.88.
- Dbouk, T., and D. Drikakis. 2020. On coughing and airborne droplet transmission to humans. Physics of Fluid 32 (5):053310. doi:https://doi.org/10.1063/5.0011960.
- Deller, B., G. Stolarsky, L. Tietjen, and D. Lewison. 2008. Preventing the transmission of Avian or pandemic influenza in health care facilities with limited resources. Jhpiego: An affiliate of John Hopkins University.
- Drossinos, Y., and N. I. Stilianakis. 2020. What aerosol physics tells us about airborne pathogen transmission. Aerosol Sci. Technol. 54 (6):639–43.
- Dudalski, N., A. Mohamed, S. Mubareka, R. Bi, C. Zhang, and E. Savory. 2020. Experimental investigation of far field human cough airflows from healthy and influenza-infected subjects. Indoor Air. 30 (5):966–977.
- Duguid, J. P. 1945. The numbers and the sites of origin of the droplets expelled during expiratory activities. Edinb. Med. J. 52:385–401.
- Embil, J., D. Dyck, J. McLeod, K. Olekson, and D. Ormiston. 2003. Cleaning house: how to prevent office infections. Canadian J. Continuing Med. Educ. 15:127–36.
- Fabian, P., J. Brain, E. A. Houseman, J. Gern, and D. K. Milton. 2011. Origin of exhaled breath particles from healthy and human rhinovirus-infected subjects. J. Aerosol Med. Pulm. Drug Deliv. 24 (3):137–47. doi:https://doi.org/10.1089/jamp.2010.0815.
- Feng, Y., T. Marchal, T. Sperry, and H. Yi. 2020. Influence of wind and relative humidity on the social distancing effectiveness to prevent COVID-19 airborne transmission: A numerical study. J. Aerosol Sci. 147:105585–19.
- Fox, J. P., C. E. Hall, and L. R. Elveback. 1972. Epidemiology, man and disease. London: The MacMillan Co.
- Fuchs, N. A., J. N. Pratt, and R. H. Sabersky. 1960. Evaporation and droplet growth in gaseous media. Trans. ASME, J. Appl. Mech. 27 (4):759–60.
- Guan, W., Z. Ni, Y. Hu, W. Liang, C. Ou, J. He, L. Liu, H. Shan, C. Lei, D. S. C. Hui, B. Du, et al. 2020. Clinical characteristics of Coronavirus Disease 2019 in China. N. Engl. J. Med. 382 (18):1708–20. doi:https://doi.org/10.1056/NEJMoa2002032.
- Gupta, J. K., C. H. Lin, and Q. Chen. 2009. Flow dynamics and characterization of a cough. Indoor Air. 19 (6):517–25. doi:https://doi.org/10.1111/j.1600-0668.2009.00619.x.
- Guzman, M. 2020. Bioaerosol Size Effect in COVID-19 Transmission. Preprints 2020:1–10. doi:https://doi.org/10.20944/preprints202004.0093.v1).
- Han, Z. Y., W. G. Weng, and Q. Y. Huang. 2013. Characterizations of particle size distribution of the droplets exhaled by sneeze. J. R Soc. Interface 10 (88):20130560. doi:https://doi.org/10.1098/rsif.2013.0560.
- Höppe, P. 1981. Temperatures of expired air under varying climatic conditions. Int. J. Biometeorol. 25 (2):127–32. doi:https://doi.org/10.1007/BF02184460.
- Jennison, M. W. 1942. Atomizing of mouth and nose secretions into the air as revealed by high-speed photography. Aerobiology 17:106–128.
- Johnson, G. R., L. Morawska, Z. D. Ristovski, M. Hargreaves, K. Mengersen, C. Y. H. Chao, M. P. Wan, Y. Li, X. Xie, D. Katoshevski, et al. 2011. Modality of human expired aerosol size distributions. J. Aerosol Sci. 42 (12):839–51.
- Kukkonen, J., T. Vesala, and M. Kulmala. 1989. The interdependence of evaporation and settling for airborne freely falling droplets. J. Aerosol Sci. 20 (7):749–63.
- Kwon, S. B., J. Park, J. Jang, Y. Cho, D. S. Park, C. Kim, G. N. Bae, and A. Jang. 2012. Study on the initial velocity distribution of exhaled air from coughing and speaking. Chemosphere 87 (11):1260–4. doi:https://doi.org/10.1016/j.chemosphere.2012.01.032.
- Langley, J. M. 2005. Adenoviruses. Pediatr. Rev. 26 (7):244–9. doi:https://doi.org/10.1542/pir.26-7-244.
- Li, X., Y. Shang, Y. Yan, L. Yang, and J. Tu. 2018. Modelling of evaporation of cough droplets in inhomogeneous humidity fields using the multi-component Eulerian-Lagrangian approach. Build. Environ. 128:68–76. doi:https://doi.org/10.1016/j.buildenv.2017.11.025.
- Lindsley, W. G., T. A. Pearce, J. B. Hudnall, K. A. Davis, S. M. Davis, M. A. Fisher, R. Khakoo, J. E. Palmer, K. E. Clark, I. Celik, et al. 2012. Quantity and size distribution of cough-generated aerosol particles produced by influenza patients during and after illness. J. Occup. Environ. Hyg. 9 (7):443–9. doi:https://doi.org/10.1080/15459624.2012.684582.
- Lindsley, W. G., Pearce, T. A. Hudnall, J. B. Davis, K. A. S. Fisher, M. M. A. Khakoo, R. Palmer, J. E. Clark, K. E. Coffey, C. C. Blachere, et al. 2015. Viable influenza A virus in airborne particles from human coughs. J. Occup. Environ. Hyg. 12 (2):107–13. doi:https://doi.org/10.1080/15459624.2014.973113.
- Loudon, R. G., and R. M. Roberts. 1967. Relation between the airborne diameters of respiratory droplets and the diameter of the stains left after recovery. Nature 213 (5071):95–6. doi:https://doi.org/10.1038/213095a0.
- Mangili, A., and M. A. Gendreau. 2005. Transmission of infectious diseases during commercial air travel. Lancet 365 (9463):989–96. doi:https://doi.org/10.1016/S0140-6736(05)71089-8.
- Morawska, L., and J. Cao. 2020. Airborne transmission of SARS-CoV-2: The world should face the reality. Environ. Int. 139:105730 doi:https://doi.org/10.1016/j.envint.2020.105730.
- Morawska, L., G. R. Johnson, Z. D. Ristovski, M. Hargreaves, K. Mengersen, S. Corbett, C. Y. H. Chao, Y. Li, and D. Katoshevski. 2009. Size distribution and sites of origin of droplets expelled from the human respiratory tract during expiratory activities. J. Aerosol Sci. 40 (3):256–69.
- Morawska, L., and D. K. Milton. 2020. It is time to address airborne transmission of Coronavirus disease 2019 (COVID-19). Clinical Infectious Diseases. doi:https://doi.org/10.1093/cid/ciaa939.
- Murphy, D. M., and T. Koop. 2005. Review of the vapour pressures of ice and supercooled water for atmospheric applications. Q. J. R. Meteorol. Soc 131 (608):1539–65.
- Papineni, R. S., and F. S. Rosenthal. 1997. The size distribution of droplets in the exhaled breath of healthy human subjects. J. Aerosol Med. 10 (2):105–16. doi:https://doi.org/10.1089/jam.1997.10.105.
- Scharfman, B. E., A. H. Techet, J. W. M. Bush, and L. Bourouiba. 2016. Visualization of sneeze ejecta: steps of fluid fragmentation leading to respiratory droplets. Exp Fluids 57 (2):1–9.
- Schipper, R. G., E. Silletti, and M. H. Vingerhoeds. 2007. Saliva as research material: Biochemical, physicochemical and practical aspects. Arch. Oral Biol. 52 (12):1114–35. doi:https://doi.org/10.1016/j.archoralbio.2007.06.009.
- Siegel, J. D., E. Rhinehart, M. Jackson, and L. Chiarello. and the 2007. Healthcare Infection Control Practices Advisor Committee. Guidelines for isolation precautions: preventing transmission of infectious agents in healthcare settings. Atlanta: Centers for Disease Control and Prevention.
- Vansciver, M., S. Miller, and J. Hertzberg. 2011. Particle image velocimetry of human cough. Aerosol Sci. Technol. 45 (3):415–22.
- Wang, B., A. Zhang, J. L. Sun, H. Liu, J. Hu, and L. X. Xu. 2005. Study of SARS transmission via liquid droplets in air. J. Biomech. Eng. 127 (1):32–8. doi:https://doi.org/10.1115/1.1835350.
- Wei, J., and Y. Li. 2015. Enhanced spread of expiratory droplets by turbulence in a cough jet. Build. Environ. 93 (2):86–96.
- Wells, W. F. 1934. On air-borne infection: Study II. Droplets and droplet nuclei. American Journal of Epidemiology 20 (3):611–8.
- Wolfram Research, I. 2019. Mathematica.
- Xie, X.,. Y. Li, A. T. Y. Chwang, P. L. Ho, and W. H. Seto. 2007. How far droplets can move in indoor environments-revisiting the Wells evaporation-falling curve. Indoor Air. 17 (3):211–2256. doi:https://doi.org/10.1111/j.1600-0668.2007.00469.x.
- Xie, X., Y. Li, H. Sun, and L. Liu. 2009. Exhaled droplets due to talking and coughing. J. R. Soc. Interface 6 (suppl_6):S703–S714. doi:https://doi.org/10.1098/rsif.2009.0388.focus.
- Yang, S., G. W. M. Lee, C. M. Chen, C. C. Wu, and K. P. Yu. 2007. The size and concentration of droplets generated by coughing in human subjects. J Aerosol Med 20 (4):484–94. doi:https://doi.org/10.1089/jam.2007.0610.
- Zhang, T. 2011. Study on surface tension and evaporation rate of human saliva, saline and water droplets. M.Sc. Diss. West Virginia University.
- Zhang, R., Y. Li, A. L. Zhang, Y. Wang, and M. J. Molina. 2020. Identifying airborne transmission as the dominant route for the spread of COVID-19. Proc Natl Acad Sci U S A 117 (26):14857–63. doi:https://doi.org/10.1073/pnas.2009637117.