
 ?Mathematical formulae have been encoded as MathML and are displayed in this HTML version using MathJax in order to improve their display. Uncheck the box to turn MathJax off. This feature requires Javascript. Click on a formula to zoom.
Abstract
The benefits of nanofibrous media have been extensively explored in laboratory-scale research but are less clear in real filtration applications. Thus, this study investigated the links between the size-resolved filtration efficiency of nanofibrous media mounted in portable air cleaners in a chamber test and results from the media mounted in a cone-shape filter holder in a more conventional duct test. Results showed a similar trend for the filtration efficiency curves for these two experimental tests, despite differences in test type, challenge aerosol, instrumentation, and the calculation of filtration efficiency. Long-term operation, surface area blockage, and isopropyl alcohol treatment adversely impacted the filtration efficiency of the tested nanofibrous media in the chamber test, with a different magnitude of impact for three different media tested. The filtration efficiencies were lower than most of the previously reported data in the literature, which may be due to the differences in medium type, fiber diameter, filter thickness, porosity, face velocity, filter charge, and the number of filter layers. This study suggests the needs for determining the performance of nanofibrous media in terms of filtration efficiency and quality factor in real environmental systems.
Copyright © 2021 American Association for Aerosol Research
Keywords:
1. Introduction
People spend 90% of their time indoors, mostly at home (Dales et al. Citation2008; Franck et al. Citation2003; Klepeis et al. Citation2001), where they are exposed to indoor particulate matter (PM). Over 95% of airborne particles are nanoparticles (Whitby Citation1978). These airborne nanoparticles not only directly cause adverse health effects but also function as carriers of toxic elements (Elsaesser and Howard Citation2012; Ferreira et al. Citation2013; McKenna et al. Citation2008; Oberdörster et al. Citation2005; Wang and Pui Citation2011). The resultant diseases include cardiovascular diseases, respiratory diseases, allergies, and cancers (Lin et al. Citation2009; Mengersen et al. Citation2011). Nanoparticles, as one of the most hazardous pollutants, are generated from a variety of sources, including combustion (Donaldson et al. Citation2005; Kennedy Citation2007), oil and gas refineries (Miller et al. Citation2010), and nanotechnology applications (Allen and Cullis Citation2004; Jawahar and Reddy Citation2012; Tiwari et al. Citation2012). Common indoor combustion-based sources include cigarette smoking and cooking (Kumar et al. Citation2013). Another example is the use of scent products, either combustion-based scent sources (Derudi et al. Citation2014; Lasher Citation1999; Lee and Wang Citation2004; Manoukian et al. Citation2013) or ultrasonic oil diffusers (Diaz Lozano Patiño et al. Citation2018).
There is a growing demand for high-efficiency, cost-effective, and energy-efficient air filters worldwide because air filtration is a common approach for removing nanoparticles from the air. It is believed that nanofibrous filters improve service life and contaminant holding capacity when compared to conventional filters (Grafe and Graham Citation2003; Graham et al. Citation2002). Nanofibers are an order of magnitude smaller than conventional filter fibers and have higher filtration efficiencies because of the slipping effect (Graham et al. Citation2002) and their large specific surface area (Wang and Otani Citation2013).
Electrospinning is widely used to produce high-quality nanofibrous materials for air filtration (Givehchi et al. Citation2016). In a typical electrospinning process, polymer fibers are deposited randomly on a substrate. The morphology and properties of electrospun nanofibrous filters such as fiber diameter, solidity, and thickness can be controlled by adjusting the properties of the polymer solution, electrospinning system configuration, and ambient air condition (Kim et al. Citation2021). Filtration using nanofibrous filters is characterized by surface loading instead of depth loading (Yoon et al. Citation2008). It has been shown that fiber diameter, basis weight (Hung and Leung Citation2011), and packing density (Leung et al. Citation2010) of nanofibrous filters affect filtration efficiency. It has been also shown that both filtration efficiency and filter quality factor were greatly increased by multi-layer nanofibrous filters by stacking thin nanofibrous filters (Givehchi et al. Citation2016), composite with micrometer fibers (Leung et al. Citation2009; Omori et al. Citation2019; Przekop and Gradoń Citation2008; Wang et al. Citation2008), or composite filter media of commercial heating, ventilation, and air-conditioning (HVAC) electret media with a nanofiber layer (Tang et al. Citation2018).
Numerous researchers have investigated the performance of nanofibrous filters fabricated with various polymers; these filter samples are typically mounted in a cone-shaped filter holder in a laboratory setting (Bian et al. Citation2020; Cho et al. Citation2013; Givehchi et al. Citation2016; Liu et al. Citation2015; Citation2020; Podgórski et al. Citation2006; Wang et al. Citation2014; Yun et al. Citation2007, Citation2010). The size-resolved filtration efficiencies reported in these studies varied from 0 to 100% for submicron particles; the efficiency greatly depended on the filter properties, including the number of nanofiber layers, fiber material, fiber diameter, filter porosity, filter basis weight, and filter thickness. Another study showed the feasibility of nanofibrous filters mounted in a chamber to capture PM2.5 particles emitted from fused deposition modeling 3D printing (Rao et al. Citation2017). Recently, electrospun nanofibrous filters were employed in a small-scale wind tunnel to capture PM2.5 emitted from incense (Xia and Chen Citation2020). Their filtration efficiencies of PM2.5 were in the range of 20–100%, depending on particle loading In addition, it is believed that nanofibrous filters have a great potential for applications in HVAC systems and air cleaners to reduce the energy consumption (Xia et al. Citation2018). However, most published research is limited to media tests in laboratory, and few, if any, focus on the performance of nanofibrous filters for the removal of nanoparticles in real environmental systems.
Another factor that potentially affects the long-term performance of nanofibrous filters is particle loading. Although a number of studies determined the effects of loading on the filtration efficiency of micron-sized fibers in both experimental and theoretical, limited studies were found for this effect on nano-sized fibrous filters (Leung and Hung Citation2012; Xia et al. Citation2018). In the case of the real systems, there is also limited research in the evaluation of the long-term performance of portable air cleaners for air filtration. For a HEPA-based portable air cleaner (PAC), the clean air delivery rate (CADR) reduced because of a reduction in airflow rate, even though particle filtration efficiency also increased due to particle loading (Zuraimi et al. Citation2017). That was not the case in the same study for an electrostatically filter-based PAC where both CADR and filtration efficiency reduced due to dust loading and filter discharge or charge masking.
The objective of this study is to investigate the size-resolved filtration efficiency of nanofibrous media in actual air cleaners. Three electrospun nanofibrous media mounted in mechanical portable air cleaners (PACs) are challenged with nanoparticles generated by an ultrasonic essential oil diffuser. Then, the filtration efficiencies of these nanofibrous media were determined in a more conventional duct test when challenged with salt aerosols. Following this procedure, we investigated the effects of the experimental setup, sample variation, filter medium, air face velocity, electrical charge, and dust loading on filtration efficiency. The results of this study allow us to understand the linkage between results obtained using real air cleaners and laboratory tests.
2. Materials and methods
summarizes the specifications of three types of commercial nanofibrous media tested in this study. They vary with the substrate, basis weight, fiber diameter, pressure drop, and air permeability. Pressure drops were reported for 20 cm2 of tested surface at an air speed of 5 m/min (0.83 cm/s), and the flow resistances of the filter media were evaluated by the air permeability that was measured for 20 cm2 media samples.
Table 1. Specifications for three tested nanofibrous media.
Two different sets of experiments were carried out to determine the performance of nanofibrous media for the filtration of airborne nanoparticles. In the first set of experiments, the filtration efficiency of circular media with a diameter of 127 mm mounted in a portable air cleaner (PAC) was determined using nanoparticles generated by an ultrasonic oil diffuser in the chamber (Chamber Test). In the second sets of experiments, the filtration efficiencies of circular media samples with a diameter of 25 mm mounted in a grounded cone-shaped filter holder were measured for sub-150 nm NaCl nanoparticles (Duct Test).
summarizes a series of tests exploring different aspects of media efficiency. Initial tests of efficiency and sample variation were conducted on three samples from each media type. The repeatability of the tests was determined by three replicate tests on a single sample of each media type. A single sample of media M3 was naturally loaded in an indoor environment to explore the effect of loading on filtration performance. In addition, a sample of each medium was tested before and after being dipped in isopropyl alcohol to study the effects of electrostatic discharge. Furthermore, the outlet of the portable air cleaner was progressively blocked to restrict airflow to explore the relationship between face velocity and filtration efficiency. The details of each test type are described below.
Table 2. Experimental approach for Chamber Test (CT) and Duct Test (DT).
2.1. Chamber test (CT)
shows the schematic diagram of the Chamber Test (CT) for the filtration efficiency test. In this test, nanofibrous media were mounted on a mechanical PAC housed in a 1.3-m3 sealed acrylic chamber (with the negligible air exchange rate) for nanoparticle removal. The goal of this first set of experiments was to test the filtration efficiency of a nanofibrous media in an air cleaner using the clean air delivery rate (CADR) method. CADR test began with emitting nanoparticles into the chamber, followed by stopping the emission to observe the decay rate of nanoparticles. All the interior surface of the chamber was wiped with isopropanol laboratory wipes between experiments to minimize contamination from one test to another; this treatment also reduces electrostatic deposition. All chamber tests were conducted in the Building Science Laboratory at the University of Toronto, Canada.
Figure 1. Schematic diagram of the Chamber Test (CT) apparatus for portable air cleaner media efficiency testing.
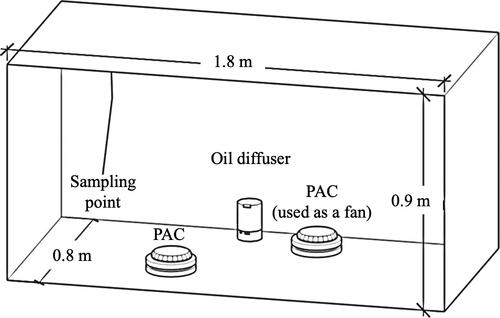
The challenging nanoparticles were generated using an ultrasonic essential oil diffuser, which uses ultrasonic vibration to vaporize an emulsion of water and essential oil. Two to four droplets of eucalyptus or lavender spearmint were added into 100 ml of distilled water, and the ultrasonic oil diffuser was running for 10 min to generate nanoparticles (, see the online supplmentary information [SI]). A portable air cleaner (PAC), without any media inside, was used as a fan for air mixing. As shown in , the filtration efficiencies of the PAC without filter inside are negligible, and thus do not affect the efficiency results in our current study. Air sampling tubes were placed 0.4 m away from the PAC and 0.7 m above the bottom of the chamber. For each test, two rounds of experiments were conducted. For the first round, nanoparticles were generated for 10 min and then decay happened until the particle concentration reached the background concentrations – this is referred to as natural decay. The second round was similar to the first one, but the PAC with nanofibrous media installed inside was running during the whole experiment in both emission and decay stages – this is referred to as PAC decay. An electrical/optical particle counter (GRIMM Aerosol Technik Mini-WRAS, Model 1371) was used to measure particles in real-time in the range of 10–30 µm in diameter, with an interval of 1 min. The air temperature and relative humidity (RH) inside the chamber were measured with an Onset U12-012 data logger.
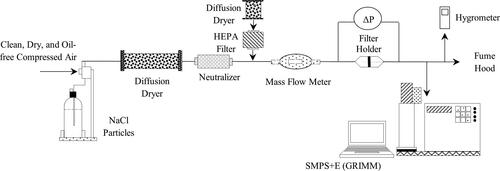
Figure 2. Schematic diagram of the Duct Test (DT) apparatus for media efficiency testing.
Nonlinear (decay phase) regression method was used to estimate the emission and loss rates of nanoparticles from scent products; this method was explained in a previous study (Diaz Lozano Patiño et al. Citation2018), and it is briefly explained here. The loss term (L) was estimated as follows:
(1)
(1)
where Ct, tgen, Ctgen are particle concentration as a function of time, particle generation time, particle concentration at the end of the generation, respectively. The effective loss rate (Leff) for the PAC was determined as the difference between the rate of contaminant reduction in the test chamber when the PAC is on and the rate of natural decay when the PAC is off. The clean air delivery rate (CADR) of the PAC is calculated as follows:
(2)
(2)
where Vcis the volume of the chamber. The filtration efficiency of the nanofibrous media mounted on the PAC was determined as the ratio of CADR to the measured airflow rate (Q) of the PAC as follows:
(3)
(3)
The flow rate passing through the nanofibrous media mounted on the PAC was measured using a calibrated fan and digital manometer (Energy Conservatory Duct Blaster Model B with Micro Leakage Meter (MLM) and DG-500 digital pressure gauge). The outlet of the PAC was connected to the top of a flow measurement box with an airtight connection. The Duct Blaster/MLM was used to zero out the pressure in the flow measurement box relative to the room so all the air flow from the air cleaner was going through the Duct Blaster/MLM. The air flow rate (Q) was then calculated using the measured fan pressure (ΔP) as follows:
(4)
(4)
where the values of C and n are given in the manual based on the orifice installed in the MLM.
The uncertainty for the efficiency calculation in the Chamber Test were calculated by the propagation of the uncertainties from the flow rate and the CADR. Uncertainty in flow rate was the manufacturer’s reported uncertainty of ±5% or the standard deviations from three replicate tests, whichever was greater. The uncertainty in CADR was calculated based on the propagation in standard errors from the nonlinear regression analyses, and typically varied in the range of 0–2% for each particle size bin.
2.2. Duct test (DT)
The experimental setup to determine the filtration efficiencies of media in the Duct Test are shown in . A filtered air supply (TSI, Model 3074) was used to provide dry filtered air at a regulated pressure. NaCl (Sigma-Aldrich, Canada) was mixed with fresh distilled water at a NaCl concentration of 0.1 g/l. Polydisperse NaCl particles, typically greater than 10 nm, were generated using a constant output atomizer (TSI Model 3076) and passed through a diffusion dryer (TSI, Model 3062). A radioactive neutralizer (Staticmaster Model P-2031) was used to ensure that aerosols reached Boltzmann charge equilibrium. A grounded cone-shape filter holder with an inner diameter of 25 mm was employed and mounted with a tested filter sample. The pressure drop across the filter sample was measured using a differential pressure gauge (Omegadyne, Model DPG409). A hygrometer (Control Model 9020526) was employed to measure the relative humidity and temperature of the air stream. The aerosol flow rate was controlled at 1.5 lpm by a pre-calibrated mass flow meter (TSI Model 4043) and a valve, both upstream of the filter. An isokinetic sampling probe downstream of the filter holder was used for aerosol sampling, which was directed into the SMPS + E (GRIMM Aerosol Technik, Model 7.80) running with a sheath air to sample air flow rate ratio of 10:1. The recommended scan time of 300 s was used for scanning particle number concentration distributions for stable incoming aerosols (Erickson et al. Citation2007). The number concentrations of particles for all the tests were measured downstream of the filter holder without and with the test filter, representing the upstream (Cup) and downstream (Cdown) concentrations, respectively. They were used to calculate the size-resolved filtration efficiency (η) using EquationEquation (3)(3)
(3) . The uncertainty in the filtration efficiency was determined as the standard deviation from three replicate tests.
(3)
(3)
3. Results and discussion
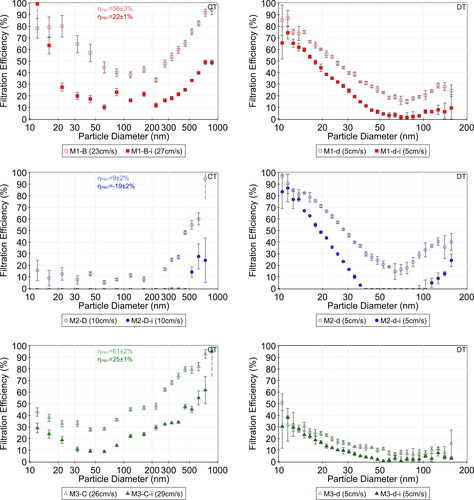
compares the Chamber Test (CT) with the Duct Test (DT) (columns), and the three types of media (rows). Each sub-figure shows the sample variations for the same media. These two tests were different in terms of experimental setup (Duct Test vs. Chamber Test), aerosol detection instrument (SMPS vs. Mini-WRAS), face velocity (5 cm/s vs. variable velocities in the PAC), the charge state of nanoparticles (equilibrium charged vs. possibly highly charged and aerosol type (NaCl vs. oil). shows that the trends of the filtration efficiency curves for these tests were similar as the most penetrating particle sizes (MPPS) are in the range of 50–100 nm, regardless of the differences between the efficiency curves. For smaller diameters, the filtration efficiency increased as the particle size decreased; this is due to strong Brownian diffusion and interception of these particles.
Figure 3. Filtration efficiency of (a) left column: three nanofibrous media in both Chamber Test (CT) and Duct Test (DT), (b) center column: three samples (A, B, C) from each nanofibrous media of M1, M2, M3 in Chamber Test, (c) right column: three samples (a–c) from each nanofibrous media of M1, M2, M3 in Duct Test. ηPM1 is the filtration efficiency based on the monitor-reported mass concentration of >1-micron particles.
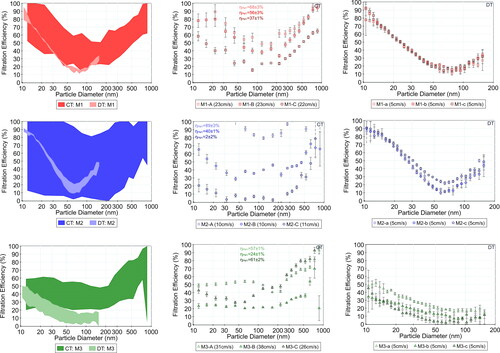
The variations in filtration efficiency tests for different samples from the same media were more substantial for the Chamber Test () when compared to the Duct Test (). One possible reason is that the experimental uncertainty of the Chamber Test is greater than that of the Duct Test. A particular reason for this might be that even though the essential oil diffuser is a consistent source in terms of particle size (Du et al. Citation2020), the charge on the generated aerosol may vary between experimental runs. Another reason may be that at the higher face velocities in the Chamber Test (when compared to 5 cm/s in Duct Test), the filtration efficiency shows more variation. Aerosol type may also affect the differences between the filtration efficiencies of the Chamber Test and the Duct Test. However, it has been previously shown that aerosol type may not be the reason for the efficiency differences because the filtration efficiencies were about the same for NaCl and oil aerosols in the size range of 300–500 nm through nanofibrous media at an air flow rate of 32 lpm (Wang, N., Zhu et al. 2014). On the other hand, the aerosol type (KCl or diesel particles in size range of 30–1000 nm) significantly affects CADR for portable HEPA air cleaners, as it is higher for diesel particles (Peck et al. Citation2016).
Different media also showed different sample variations. These variations may result from the non-homogeneity of media samples due to the differences in fiber diameter, porosity, and filter thickness, which can affect both pressure drop and filtration efficiency. The pressure drop and face velocity of nanofibrous media are linearly proportional to each other (Xia et al. Citation2018); therefore, different fibers can have the same pressure drops (as a result of having the same face velocity), but filtration efficiencies may be different because of the nonhomogeneity of electrospun filter media. For each type of media, the samples of M1 and M2 media have similar face velocities, although they have different filtration efficiencies over the tested particle sizes. However, the samples of M3 media showed a wide range of face velocities and filter efficiencies, suggesting a different type of variation in this media. The variations in filtration efficiencies of the three M2 samples were particularly large. Thus, the M2-A sample was tested for two more times to determine any possible experimental errors; the results are shown in . Similar filtration efficiency results were observed for these repeated tests, and we believe that the variation in the filtration efficiency of M2 media is due to the nonhomogeneity of media, or potentially the charge on the generated aerosol as discussed earlier, rather than an experimental error. The filtration efficiency of M2 media for some particle sizes was larger than unity, which may be due to particle-resuspension, poor mixing in the chamber, nanofiber particle-generation or particle-generation from the motor operation of the PAC. However, as shown in , the particle generation from PAC did not affect the result because the PAC efficiency (without filter media) was almost zero, rather than negative.
In the Duct Test, the filtration efficiencies were approximately the same for all three M1 samples, which shows that selected samples in this media are homogenous with each other for these smaller size samples, although the electrospun fibers were randomly deposited. The measurement of pressure drops across these three-sample media ranged between 22 and 24 Pa, which shows less variation in pressure drop. For M2 media, the efficiency deviated from each other for particles larger than 30 nm (with 10% variation) when pressure drop ranged from 67 to 69 Pa. For M3 media, the variation was about 20% for all the tested particle size when the pressure drop varied from 5 to 12 Pa; this result showed the differences between the samples in the M3 media. These variations in the pressure drop showed the inhomogeneity in fiber packing. For M3-a, both the filtration efficiency and pressure drop were greater compared to other samples. This may be because of the smaller fiber diameter or the smaller porosity of filter because either one leads to higher filtration efficiency.
Comparison among the filtration efficiency of these three media in DT () shows that media M2 and M1 have similar filtration efficiencies, which are higher than that of M3 media. The differences are more substantial for sub-40 nm particles than the larger ones. As particle size decreased, the efficiency difference increased and, for the 10 nm particles, the filtration efficiency varied between 50% and 90%. The filtration efficiency curves for both M2 and M3 media agreed with those for single layer nanofibrous media reported earlier (Givehchi et al. Citation2016; Podgórski et al. Citation2006). The experimental setup for these two mentioned studies were similar to our study herein for the Duct Test. Givehchi et al. (Citation2016) employed single layer Polyvinyl alcohol (PVA) nanofibrous filter media with a mean fiber diameter of 150 nm to remove NaCl nanoparticles in the range of 10–100 nm at a face velocity of 6.7 cm/s. Podgórski et al. (Citation2006) employed nanofibrous filter media with a mean fiber diameter of about 600 nm to remove particles in the size range of 10–500 nm at a face velocity of 8.94 cm/s. However, our results are lower than those of for other studies who employed polyacrylonitrile (PAN) nanofibrous filter media with mean fiber diameters in the range of 270–400 nm to remove sub-100 nm NaCl particles at the face velocity of 5.3 cm/s (Yun et al., Citation2007, Citation2010). The differences among these studies are likely related to the properties of nanofibrous media such as fiber diameter, thickness, and porosity.
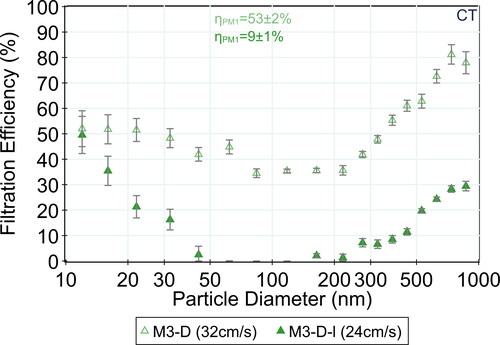
Figure 4. Effects of three months of indoor particle loading (M3-D stands for the initial filter medium and M3-D-l stands for the final medium after long term operation) on filtration efficiency of M3 filter media in Chamber Test (CT). ηƞPM1 is the filtration efficiency based on the monitor-reported mass concentration of >1-micron particles.
Another possibility for the great variations in filtration efficiency in the Chamber Test is the repeatability of results for the same piece of media (see , and ). The filtration efficiencies of one sample from the same media were determined for both types of experimental tests. Results show that the filtration efficiency of each sample were similar to each other (within about 10% difference) for particles in the range of 10–1000 nm in different replicates, demonstrating the repeatability of the experiments. Nonetheless, one limitation of these tests is that the second and third repetitions were with a used sample (loaded with dust from preceding tests) rather than the clean one. However, both the efficiency changes pattern and the stable media pressure drop suggested that a light loading was a negligible factor in these tests.
Figure 5. Filtration efficiency of three filter media before and after exposure to IPA (shown with i in legend) for Chamber Test (CT, left column) Duct Test (DT, right column) for three different media samples (rows) ηPM1 is the filtration efficiency based on the monitor-reported mass concentration of >1-micron particles.
Both dust loading and potential filter discharge must be considered for the evaluation of the long-term performance of the nanofibrous-based PAC. In the current study the long-term performance of nanofibrous-based PAC in terms of size-resolved filtration efficiency was investigated by comparing new and used filter media. shows both the initial and final filtration efficiencies of M3 medium after running for three months in the Building Science Laboratory at the University of Toronto. Both initial and final filtration efficiencies were measured in the Chamber Test. The efficiency for PM1 was 53%, which decreased to 9% after long term operation. This result is different than that reported for HEPA-based portable air cleaner installed in a chamber, which showed negligible changes in filtration efficiency (due to a 25% reduction in both CADR and airflow rate) after 800 h of operation for micron particles (Shaughnessy et al. Citation1994). The most important reason for this discrepancy is the difference in size of tested particles and filter type. The size-resolved filtration efficiency in our study also decreased with particle loading, because it was almost zero for particles in the size range of 50–200 nm. For sub-50 nm particles, the difference between the filtration efficiency of clean media and loaded media also decreased as the particle size decreased. This result suggests that particle loading has a smaller effect on filtration efficiency for smaller particles when compared to larger ones.
The mass of dust collected on the media for this 3-month duration was 25.7 ± 3.7 mg. These dust particles may change the morphology and diminished the favorable features of the nanofibers. The accumulated mass also decreased the pressure drop and lower the face velocity. Earlier studies also showed that particle loading in nanofibrous media increased the pressure drop more rapidly than micron-fibers (Leung and Hung Citation2012). Meanwhile, the face velocity decreased from 32 to 24 cm/s due to particle loading. The lower the face velocity is, the higher the filtration efficiency for smaller particles due to increased residence time for diffusion, and the lower the filtration efficiency for larger particles due to reduced inertial impaction. Therefore, our finding suggests that dust loading adversely compensates the effects of lower face velocity for smaller nanoparticles, which lowers the overall filtration efficiency.
In all of the current experiments, the substrate layer was toward the incoming aerosol, so the dust loading is more uniform when compared to when the nanofiber layers are facing the incoming aerosol (Leung and Hung Citation2012). The uniformity arrangement of dust loading can intensify clogging and as a result decreases the filtration efficiency. In this case, the flow passes through the pathways with higher local porosity, and nanofibers have less chance to capture incoming particles, when compared to a nonhomogeneous arrangement of dust. The filtration efficiency of the substrate may be negligible, as after three months of particle loading, the nanofiber layer was visibly dirtier when compared to substrate that was facing directly toward the incoming aerosols (Figure S6, SI).
Besides particle loading, charge masking or discharge of filters over time may also reduce filtration efficiency (Raynor and Chae Citation2004). To determine the effects of the charge of nanofibrous media on filtration efficiency, samples were dipped in liquid isopropanol alcohol (IPA) for 10 min or so followed by drying to remove electrical charges (Martin Jr and Moyer 2000). Dipping in IPA is generally regarded as an extreme case for charge removal. IPA may change the morphology of fibers, although this topic is controversial (Xiao et al. Citation2014). The scanning electron microscopy (SEM) imaging of micron-sized filters indicated no observable morphological changes after IPA exposure (Kim et al. Citation2009), although we found no studies on nanosized fibers. Additionally, Kerner et al. (Citation2020) demonstrated that IPA had no significant effect on the fibrous structure of two electret micron-sized fibrous filter media samples; however, IPA adversely affected the filtration efficiency as expected (Kerner et al. Citation2020).
shows the drop in filtration efficiency due to IPA dipping for both experimental setups. Results showed that IPA dip increased the face velocity across the media and decreased the filtration efficiencies for both M1 and M3 (up to 30%) media. IPA reduced the filtration efficiency of media M2 for sub-500 nm particles in the chamber test and for particles in the range of 40 to 100 nm in the duct test. Both CT and DT results show negative efficiencies for 40-100 nm particles. This is unexplained and cannot easily be explained by experimental issues given the two very distinct experimental approaches. Overall, IPA decreased the filtration efficiency of tested electrospun nanofibrous media; this may contradict with a previous study, which shows that the filtration efficiencies of nanofibrous filters are independent of the electrostatic charge (Yi et al. Citation2018). This may be attributed to the differences in polymer and the electret elimination process (Lee et al. Citation2017). Overall, IPA likely has a complex impact on the filtration efficiency of nanofibrous media, depending on the fiber diameter and the initial charge states of media.
Comparing the results between the two approaches to filter testing (left vs. right column in ) show that the drops in filtration efficiency in the Chamber Test (CT) was greater than those in Duct Test (DT) for M1 and M3 media, suggesting that IPA discharge plays a more important role in in the CT. Besides the differences between the variables in these two experimental setups, the charge states of tested nanoparticles may also affect the results. For the 25-mm filter media in the Duct Test, equilibrium Boltzmann charged particles were tested, whereas the charge states of oil nanoparticles in a Chamber Test was unknown, although the ultrasonic oil diffusor was expected to generate negatively charged particles (Jörgensen Citation2012). The bottom left graph in shows that the drop in filtration efficiency is less than long-term particle loading in . Therefore, these results prove that the degradation of filtration efficiency after a long-term operation was not only related to discharge of the electrostatic field in nanofibrous media.
Another possibility for the decreases in filtration efficiency shown in is the change in face velocity (see ). In this study, face velocities were controlled by blocking 0, 25%, 50%, and 75% of the filter being tested. The air flow rate decreased as the blocking area of the media increased. Thus, decreases in both air flow rate and surface area of the media could lead to unknown trend for face velocity. Figure S7 (SI) shows that the face velocity increased as the blocked area of the media increased, as shown for both M2 and M3 media; however, it is not the case for M1 media. The face velocity for M1 media was independent of surface area coverage. This behavior may be because of the specific fan used in the portable air cleaner and its response to the increased pressure drop from blocking for the three media types. For all three media, the filtration efficiency decreased as the blocking area increased: this could be due to the higher loading on the uncovered portion of the media, the larger face velocities (for M2 and M3 media), or both. For M2 media, the filtration efficiency decreased as the face velocity increased, but the difference is more dominant for sub-100 nm particles, which is consistent with the results in a previous study (Leung et al. Citation2010). The complexity of face velocity impacts for different media points to the need for mechanistic research on this aspect of real-world use of nanofiber media.
This study explored the efficiencies of nanofibrous filters mounted in portable air cleaners and in a conventional filtration test. Various filtration parameters, including media variation, face velocity, charge disputation, particle loading, and aerosol type impacted the filtration efficiency for both DT and CT, sometimes in different manners. Regardless of the test method, media type is the most important factor in our results. The filtration efficiencies of the filter media tested were lower than those reported in other studies because of differences in media type, fiber diameter, thickness, porosity. Given the potential benefits of nanofibrous filters (e.g., large-scale production, low cost-benefit ratio, and high filtration quality factor), it is worthwhile to determine their performance under real conditions, which may be different from laboratory tests due to the effects of room size, mixing conditions, aerosol type, etc. Therefore, there are two directions for future research. The first one is to fully understand the media application in a real world as shown in . The results of a real-world application suggest doing more realistic experimental studies by considering well-characterized particle loading as well as the charge disruption and the changes in the face velocity. The second direction is to optimize the nanofibrous media characterizations based on the findings in the first direction. The morphology and characteristics of the electrospun nanofibrous filters can be improved by adjusting the applied voltage, polymer type, tip-to-collector distance, spinning time, etc. during the electrospinning process. These parameters directly affect the fiber diameter, fiber size distribution, basis weight, porosity, and thickness of the filter (Givehchi et al. Citation2016).
4. Conclusions
This study shows the feasibility of nanofibrous media mounted in portable air cleaners to remove airborne nanoparticles. Nanofibrous media mounted in both the portable air cleaner (PAC) in a Chamber Test and a cone-shape filter holder in the Duct Test have similar filtration efficiency trends vs. particle sizes. Results showed that different media have different sample variations as a result from the non-homogeneity of electrospun media. The variations in filtration efficiency tests for different samples from the same media are more substantial for the Chamber Test when compared to the Duct Test. Both IPA treatment and particle loading decrease the filtration efficiencies of nanofibrous filters. Overall, the filtration efficiency results obtained through Duct Test can be used as a preliminary assessment for the performance of nanofibrous media in real systems. However, real-world testing of nanofibrous filter media is a critical need. Factors like long-term operation, blocking surface area, and isopropyl alcohol treatment negatively impact the filtration efficiencies of nanofibrous media in the PAC. These parameters directly affect the face velocity, particle loading, and discharge of the media as well as potentially impacting the nanofiber structure for some media. Nonetheless, the impact of these factors on the three different media tested are different from each other. Thus, more research is needed on the performance of nanofibrous filter media for the removal of airborne nanoparticles in real systems.
Supplemental Material
Download MS Word (6.5 MB)Acknowledgments
We would like to thank Raphael Kay for his help in some parts of the experiments.
Additional information
Funding
References
- Allen, T. M., and P. R. Cullis. 2004. Drug delivery systems: Entering the mainstream. Science 303 (5665):1818–22. doi:https://doi.org/10.1126/science.1095833.
- Bian, Y., S. Wang, L. Zhang, and C. Chen. 2020. Influence of fiber diameter, filter thickness, and packing density on PM2. 5 removal efficiency of electrospun nanofiber air filters for indoor applications. Build. Environ. 170:106628. doi:https://doi.org/10.1016/j.buildenv.2019.106628.
- Cho, D., A. Naydich, M. W. Frey, and Y. L. Joo. 2013. Further improvement of air filtration efficiency of cellulose filters coated with nanofibers via inclusion of electrostatically active nanoparticles. Polymer 54 (9):2364–72. doi:https://doi.org/10.1016/j.polymer.2013.02.034.
- Dales, R., L. Liu, A. J. Wheeler, and N. L. Gilbert. 2008. Quality of indoor residential air and health. Can. Med. Assoc. J. 179 (2):147–52. doi:https://doi.org/10.1503/cmaj.070359.
- Derudi, M., S. Gelosa, A. Sliepcevich, A. Cattaneo, D. Cavallo, R. Rota, and G. Nano. 2014. Emission of air pollutants from burning candles with different composition in indoor environments. Environ. Sci. Pollut. Res. Int. 21 (6):4320–30. doi:https://doi.org/10.1007/s11356-013-2394-2.
- Diaz Lozano Patiño, E., A. Mahdavi, and J. A. Siegel. 2018. Particulate matter emission rates from common scent sources. Proceeding of ASHRAE, paper HO-18-C011, Houston, TX, USA.
- Donaldson, K., L. Tran, L. A. Jimenez, R. Duffin, D. E. Newby, N. Mills, W. MacNee, and V. Stone. 2005. Combustion-derived nanoparticles: A review of their toxicology following inhalation exposure. Part. Fibre Toxicol. 2 (1):10–4. doi:https://doi.org/10.1186/1743-8977-2-10.
- Du, B., H. Schwartz-Narbonne, and J. A. Siegel. 2020. Particle Emissions from Essential Oil Diffusers. Indoor Air 2020: Proceedings of the 16th International Conference on Indoor Air and Climate, Paper 210, Seoul, Korea.
- Elsaesser, A., and C. V. Howard. 2012. Toxicology of nanoparticles. Adv. Drug. Deliv. Rev. 64 (2):129–37. doi:https://doi.org/10.1016/j.addr.2011.09.001.
- Erickson, K., M. Singh, and B. Osmondson. 2007. Technical Proceedings of 2007 NSTI Nanotechnology Conference and Trade Show – NSTI Nanotech 2007, Danville, CA, USA.
- Ferreira, A., J. Cemlyn-Jones, and C. R. Cordeiro. 2013. Nanoparticles, nanotechnology and pulmonary nanotoxicology. Rev. Port. Pneumol. (English Ed.) 19 (1):28–37. doi:https://doi.org/10.1016/j.rppnen.2013.01.004.
- Franck, U., O. Herbarth, B. Wehner, A. Wiedensohler, and M. Manjarrez. 2003. How do the indoor size distributions of airborne submicron and ultrafine particles in the absence of significant indoor sources depend on outdoor distributions? Indoor Air. 13 (2):174–81. doi:https://doi.org/10.1034/j.1600-0668.2003.00177.x.
- Givehchi, R., Q. Li, and Z. Tan. 2016. Quality factors of PVA nanofibrous filters for airborne particles in the size range of 10–125 nm. Fuel 181:1273–80. doi:https://doi.org/10.1016/j.fuel.2015.12.010.
- Grafe, T. H., and K. M. Graham. 2003. Nanofiber webs from electrospinning. Nonwovens in Filtration – Fifth International Conference, Stuttgart, Germany. 1–5.
- Graham, K., M. Ouyang, T. Raether, T. Grafe, B. McDonald, and P. Knauf. 2002. Polymeric nanofibers in air filtration applications. 5th Annual Technical Conference & Expo of the American Filtration & Separations Society. Galveston, Texas.
- Hung, C., and W. W. Leung. 2011. Filtration of nano-aerosol using nanofiber filter under low Peclet number and transitional flow regime. Sep. Purif. Technol. 79 (1):34–42. doi:https://doi.org/10.1016/j.seppur.2011.03.008.
- Jawahar, N., and G. Reddy. 2012. Nanoparticles: A novel pulmonary drug delivery system for tuberculosis. J. Pharm. Sci. Res. 4:1901–6.
- Jörgensen, C. 2012. Aromatic nebulizing diffuser. US Patent 8133440B2.
- Kennedy, I. M. 2007. The health effects of combustion-generated aerosols. Proc. Combust. Inst. 31 (2):2757–70. doi:https://doi.org/10.1016/j.proci.2006.08.116.
- Kerner, M., K. Schmidt, S. Schumacher, V. Puderbach, C. Asbach, and S. Antonyuk. 2020. Evaluation of electrostatic properties of electret filters for aerosol deposition. Sep. Purif. Technol. 239:116548. doi:https://doi.org/10.1016/j.seppur.2020.116548.
- Kim, H. B., W. J. Lee, S. C. Choi, K. B. Lee, and M. Lee. 2021. Filter quality factors of fibrous filters with different fiber diameter. Aerosol. Sci. Tech. 55 (2):154–166. doi:https://doi.org/10.1080/02786826.2020.1829535.
- Kim, J., J. P. Hinestroza, W. Jasper, and R. Barker. 2009. Effect of solvent exposure on the filtration performance of electrostatically charged polypropylene filter media. Text Res. J. 79 (4):343–50. doi:https://doi.org/10.1177/0040517508090887.
- Klepeis, N. E., W. C. Nelson, W. R. Ott, J. P. Robinson, A. M. Tsang, P. Switzer, J. V. Behar, S. C. Hern, and W. H. Engelmann. 2001. The National Human Activity Pattern Survey (NHAPS): a resource for assessing exposure to environmental pollutants. J. Expo. Anal. Environ. Epidemiol. 11 (3):231–52. doi:https://doi.org/10.1038/sj.jea.7500165.
- Kumar, P., L. Pirjola, M. Ketzel, and R. M. Harrison. 2013. Nanoparticle emissions from 11 non-vehicle exhaust sources – A review. Atmos. Environ. 67:252–77. doi:https://doi.org/10.1016/j.atmosenv.2012.11.011.
- Lasher, S. W. 1999. Ultra-fine soot investigation in flames. Dissertation from the Massachusetts Institute of Technology.
- Lee, S., and B. Wang. 2004. Characteristics of emissions of air pollutants from burning of incense in a large environmental chamber. Atmos. Environ. 38 (7):941–51. doi:https://doi.org/10.1016/j.atmosenv.2003.11.002.
- Lee, S., H. Cho, Y. Ha, S. Kim, B. Chung, W. K. Son, K. S. Kang, Y. C. Jung, K. Park, and J. Lee. 2017. Enhancing the durability of filtration the ultrafine aerosol by electrospun polymer filter containing quaternary ammonium moiety. Polymer 121:211–6. doi:https://doi.org/10.1016/j.polymer.2017.06.026.
- Leung, W. W., and C. Hung. 2012. Skin effect in nanofiber filtration of submicron aerosols. Sep. Purif. Technol. 92:174–80. doi:https://doi.org/10.1016/j.seppur.2011.02.020.
- Leung, W. W., C. Hung, and P. Yuen. 2009. Experimental investigation on continuous filtration of sub-micron aerosol by filter composed of dual-layers including a nanofiber layer. Aerosol. Sci. Tech. 43 (12):1174–83. doi:https://doi.org/10.1080/02786820903261086.
- Leung, W. W., C. Hung, and P. Yuen. 2010. Effect of face velocity, nanofiber packing density and thickness on filtration performance of filters with nanofibers coated on a substrate. Sep. Purif. Technol. 71 (1):30–7. doi:https://doi.org/10.1016/j.seppur.2009.10.017.
- Lin, L. Y., C. Y. Lin, Y. C. Lin, and K. J. Chuang. 2009. The effects of indoor particles on blood pressure and heart rate among young adults in Taipei, Taiwan. Indoor Air. 19 (6):482–8. doi:https://doi.org/10.1111/j.1600-0668.2009.00612.x.
- Liu, C., P. Hsu, H. Lee, M. Ye, G. Zheng, N. Liu, W. Li, and Y. Cui. 2015. Transparent air filter for high-efficiency PM2.5 capture. Nat. Commun. 6:6205. doi:https://doi.org/10.1038/ncomms7205.
- Liu, Y., X. Qian, H. Zhang, L. Wang, C. Zou, and Y. Cui. 2020. Preparing micro/nano-fibrous filters for effective PM 2.5 under low filtration resistance. Chem. Eng. Sci. 217:115523. doi:https://doi.org/10.1016/j.ces.2020.115523.
- Manoukian, A., E. Quivet, B. Temime-Roussel, M. Nicolas, F. Maupetit, and H. Wortham. 2013. Emission characteristics of air pollutants from incense and candle burning in indoor atmospheres. Environ. Sci. Pollut. Res. Int. 20 (7):4659–70. doi:https://doi.org/10.1007/s11356-012-1394-y.
- Martin, S. B., and E. S. Jr., Moyer. 2000. Electrostatic respirator filter media: filter efficiency and most penetrating particle size effects. Appl. Occup. Environ. Hyg. 15 (8):609–17. doi:https://doi.org/10.1080/10473220050075617.
- McKenna, J. D., J. H. Turner, and J. P. McKenna. 2008. Fine particle (2.5 microns) emissions: regulation, measurement, and control. Hoboken, NJ: John Wiley & Sons.
- Mengersen, K., L. Morawska, H. Wang, N. Murphy, F. Tayphasavanh, K. Darasavong, and N. S. Holmes. 2011. Association between indoor air pollution measurements and respiratory health in women and children in Lao PDR. Indoor Air. 21 (1):25–35. doi:https://doi.org/10.1111/j.1600-0668.2010.00679.x.
- Miller, A., P. L. Drake, P. Hintz, and M. Habjan. 2010. Characterizing exposures to airborne metals and nanoparticle emissions in a refinery. Ann. Occup. Hyg. 54:504–13.
- Oberdörster, G., E. Oberdörster, and J. Oberdörster. 2005. Nanotoxicology: An emerging discipline evolving from studies of ultrafine particles. Environ. Health Perspect. 113 (7):823–39. doi:https://doi.org/10.1289/ehp.7339.
- Omori, Y., T. Gu, L. Bao, Y. Otani, and T. Seto. 2019. Performance of nanofiber/microfiber hybrid air filter prepared by wet paper processing. Aerosol. Sci. Tech. 53 (10):1149–57. doi:https://doi.org/10.1080/02786826.2019.1634243.
- Peck, R., S. Grinshpun, M. Yermakov, M. Rao, J. Kim, and T. Reponen. 2016. Efficiency of portable HEPA air purifiers against traffic related combustion particles. Build. Environ. 98:21–9. doi:https://doi.org/10.1016/j.buildenv.2015.12.018.
- Podgórski, A., A. Bałazy, and L. Gradoń. 2006. Application of nanofibers to improve the filtration efficiency of the most penetrating aerosol particles in fibrous filters. Chem. Eng. Sci. 61 (20):6804–15. doi:https://doi.org/10.1016/j.ces.2006.07.022.
- Przekop, R., and L. Gradoń. 2008. Deposition and filtration of nanoparticles in the composites of nano- and microsized fibers. Aerosol. Sci. Tech. 42 (6):483–93. doi:https://doi.org/10.1080/02786820802187077.
- Rao, C., F. Gu, P. Zhao, N. Sharmin, H. Gu, and J. Fu. 2017. Capturing PM2. 5 emissions from 3D printing via nanofiber-based air filter. Sci. Rep. 7 (1):10. doi:https://doi.org/10.1038/s41598-017-10995-7.
- Raynor, P. C., and S. J. Chae. 2004. The long-term performance of electrically charged filters in a ventilation system. J. Occup. Environ. Hyg. 1 (7):463–71. doi:https://doi.org/10.1080/15459620490467783.
- Shaughnessy, R. J., E. Levetin, J. Blocker, and K. L. Sublette. 1994. Effectiveness of portable indoor air cleaners: Sensory testing results. Indoor Air 4 (3):179–88. doi:https://doi.org/10.1111/j.1600-0668.1994.t01-1-00006.x.
- Tang, M., S. Chen, D. Chang, X. Xie, J. Sun, and D. Y. Pui. 2018. Filtration efficiency and loading characteristics of PM2. 5 through composite filter media consisting of commercial HVAC electret media and nanofiber layer. Sep. Purif. Technol. 198:137–45. doi:https://doi.org/10.1016/j.seppur.2017.03.040.
- Tiwari, G., R. Tiwari, B. Sriwastawa, L. Bhati, S. Pandey, P. Pandey, and S. K. Bannerjee. 2012. Drug delivery systems: An updated review. Int. J. Pharm. Investig. 2 (1):2–11. doi:https://doi.org/10.4103/2230-973X.96920.
- Wang, J., S. C. Kim, and D. Y. Pui. 2008. Figure of merit of composite filters with micrometer and nanometer fibers. Aerosol. Sci. Tech. 42 (9):722–8. doi:https://doi.org/10.1080/02786820802249133.
- Wang, N., X. Mao, S. Zhang, J. Yu, and B. Ding. 2014. Electrospun nanofibers for air filtration. In: Electrospun Nanofibers for Energy and Environmental Applications, 299–323. Berlin, Germany: Springer. doi:https://doi.org/10.1007/978-3-642-54160-5.
- Wang, N., Z. Zhu, J. Sheng, S. S. Al-Deyab, J. Yu, and B. Ding. 2014. Superamphiphobic nanofibrous membranes for effective filtration of fine particles. J. Colloid Interface Sci. 428:41–8. doi:https://doi.org/10.1016/j.jcis.2014.04.026.
- Wang, C., and Y. Otani. 2013. Removal of nanoparticles from gas streams by fibrous filters: A review. Ind. Eng. Chem. Res. 52 (1):5–17. doi:https://doi.org/10.1021/ie300574m.
- Wang, J., and D. Y. H. Pui. 2011. Characterization, exposure measurement and control for nanoscale particles in workplaces and on the road. J. Phys: Conf. Ser. 304:012008. doi:https://doi.org/10.1088/1742-6596/304/1/012008.
- Whitby, K. T. 1978. The physical characteristics of sulfate aerosols. Sulfur in the Atmosphere. Proceedings of the International Symposium. Dubrovnik, Yugoslavia: Pergamon, 135–59.
- Xia, T., and C. Chen. 2020. Toward understanding the evolution of incense particles on nanofiber filter media: Its influence on PM2. 5 removal efficiency and pressure drop. Build. Environ. 172:106725. doi:https://doi.org/10.1016/j.buildenv.2020.106725.
- Xia, T., Y. Bian, L. Zhang, and C. Chen. 2018. Relationship between pressure drop and face velocity for electrospun nanofiber filters. Energy Build. 158:987–99. doi:https://doi.org/10.1016/j.enbuild.2017.10.073.
- Xiao, H., Y. Song, and G. Chen. 2014. Correlation between charge decay and solvent effect for melt-blown polypropylene electret filter fabrics. J. Electrostat. 72 (4):311–4. doi:https://doi.org/10.1016/j.elstat.2014.05.006.
- Yi, Z., P. Cheng, J. Chen, K. Liu, Q. Liu, M. Li, W. Zhong, W. Wang, Z. Lu, and D. Wang. 2018. PVA-co-PE nanofibrous filter media with tailored three-dimensional structure for high performance and safe aerosol filtration via suspension-drying procedure. Ind. Eng. Chem. Res. 57 (28):9269–80. doi:https://doi.org/10.1021/acs.iecr.8b02523.
- Yoon, K., B. S. Hsiao, and B. Chu. 2008. Functional nanofibers for environmental applications. J. Mater. Chem. 18 (44):5326–34. doi:https://doi.org/10.1039/b804128h.
- Yun, K. M., A. B. Suryamas, F. Iskandar, L. Bao, H. Niinuma, and K. Okuyama. 2010. Morphology optimization of polymer nanofiber for applications in aerosol particle filtration. Sep. Purif. Technol. 75 (3):340–5. doi:https://doi.org/10.1016/j.seppur.2010.09.002.
- Yun, K. M., C. J. Hogan, Jr., Y. Matsubayashi, M. Kawabe, F. Iskandar, and K. Okuyama. 2007. Nanoparticle filtration by electrospun polymer fibers. Chem. Eng. Sci. 62 (17):4751–9. doi:https://doi.org/10.1016/j.ces.2007.06.007.
- Zuraimi, M., M. Vuotari, G. Nilsson, R. Magee, B. Kemery, and C. Alliston. 2017. Impact of dust loading on long term portable air cleaner performance. Build. Environ. 112:261–9. doi:https://doi.org/10.1016/j.buildenv.2016.11.001.