
 ?Mathematical formulae have been encoded as MathML and are displayed in this HTML version using MathJax in order to improve their display. Uncheck the box to turn MathJax off. This feature requires Javascript. Click on a formula to zoom.
Abstract
Heterogeneous condensation of supersaturated water vapor on submicron particles is an important phase transition process. Particle surface topography has a great influence on the whole condensation process. When water vapor condenses on a smooth SiO2 particle, only one embryo drop occurs randomly on the particle surface of a certain edge. By contrast, on rough particles with irregular surfaces, the number of embryo drops is arbitrary. The word “rough” mentioned in this article refers to the change of macro roughness caused by the change of surface morphology, rather than micro-scale surface roughness. Furthermore, the location of the embryo drop is no longer at any random position, but at the protuberance of the particle’s surface. The concept of Gibbs free energy change is presented to interpret the formation of the embryo drop. Fractal dimension is then proposed as a parameter by which to characterize irregular structure of rough particles’ surface. The number of nucleation sites in the condensation process is greatly affected by the surface morphology of SiO2 particles. The experimental results show that nucleation sites increase significantly with increasing surface fractal dimensions. The views of the apparent contact angle and the minimum nuclear radius are proposed to interpret nucleation site distributions. Moreover, the critical temperature of the cold stage required to activate the condensation process is shown to increase with increasing surface fractal dimension. Irregular structure of rough particles’ surface is helpful in reducing the value of the critical supersaturation.
Copyright © 2021 American Association for Aerosol Research
EDITOR:
1. Introduction
Heterogeneous condensation is an important phase transition in which vapor condenses on particle surfaces to form embryo droplets (Chen and Tao Citation2000; Yang et al. Citation2010; Tammaro et al. Citation2012; Xu et al. Citation2017; Yu, Zhang, and Zhong Citation2019). Cloud formation in the atmospheric environment is a typical heterogeneous condensation process. It is also a common phenomenon in industrial dust removal technology, where heterogeneous condensation is considered as a preconditioning technique for sub-micron particle collection (Chen, Hung, and Hsu Citation1993; Fan et al. Citation2009). This technology was applied in a novel process to remove fine particles in a wet flue gas desulfurization (WFGD) system. The results showed that an improvement of at least 40%–60% in particle removal efficiency could be attained by adding 0.08 kg of steam per N m3 of flue gas to create a supersaturated environment (Bao et al. Citation2013). It is usually thought that heterogeneous condensation can be divided into two stages: nucleation and growth (Smorodin and Hopke Citation2006; Fan et al. Citation2013). In the heterogeneous nucleation process, a cap-shaped embryo drop model was presented by Fletcher (Citation1958), which is currently the most widely used nucleation theory. This classic theory assumed that the nucleation base was a spherical particle with a smooth surface. However, particles discharged from practical coal-fired power plants are actually complex with irregular surface properties (Bao et al. Citation2013; De Joannon et al. Citation2013; Cui et al. Citation2018). Thus it is important to study the relationship between surface topography and the heterogeneous condensation process.
Many researches have investigated the effects of surface properties on vapor condensation. McCormick and Westwater (Citation1965) studied dropwise condensation based on microscope photographs and found that droplets appeared not only at the natural cavities of materials’ surface but also at those heterophilic parts caused by needles and by erosion. Lammel and Novakov (Citation1995) investigated nucleation properties of water vapor on carbon black and diesel soot particles with and without chemical modification, and the results showed that nucleation ability could be improved by increasing the soluble mass fraction through chemical modification. Heidenreich et al. (Citation2000) presented a cascade of packed columns to separate submicron particles from gases and studied the effects of surface roughness on vapor condensation. The results showed that the critical supersaturation required for nucleation on rough particles was lower, and surface roughness could reduce the nucleation free energy barrier and increase the nucleation rate considerably. Yan et al. (Citation2009) numerically predicted nucleation behavior of supersaturated vapor on coal-fired fine particles and found that particles’ heterophilic properties could reduce the Gibbs free energy of embryo formation and lead to an obvious reduction of the critical supersaturation. Nucleation capabilities were enhanced greatly for heterophilic particles. While these studies demonstrate that surface properties of condensation materials can affect heterogeneous condensation, they are based on numerical analysis and lack verification by direct visualization results. Moreover, these studies focus on the effects on heterogeneous nucleation, but water vapor continues to condense and grow into droplets after nucleation. Relatively few studies focus on how surface characteristics influence droplet growth.
Glicksman and Hunt (Citation1972) investigated nucleation, growth, coalescence and renucleation of droplets ranging in size from minimum nucleating droplets to departing droplets by numerical simulation. Their results showed that nucleation site density was significantly related to surface properties of condensation materials. Zhang et al. (Citation2015) fabricated various hydrophobic coatings such as Polyphenylene sulfide (PPS), polytetrafluoroethylene (PTFE) and self-assembled micro/nano silver (SAMS) using surface treatments, and examined fabricated surfaces by condensation heat transfer experiments. The results indicated that surface morphologies and wetting behaviors directly affected droplet sizes and population densities. However, it is not accurate to investigate the relationship between surface topography and condensation process by examining only the population density. Mu et al. (Citation2008) carried out condensation experiments on magnesium surfaces with different topographies and applied fractal dimensions to characterize the irregular and complex degree of the condensation surface. The relationship of nucleation site density to surface topography on the nanometer scale was experimentally studied, and the results showed that surface topography had a great influence on nucleation site density: the larger the fractal dimensions, the more nucleation sites. Although Mu et al. focused on dropwise condensation on magnesium surfaces, rather than on heterogeneous condensation on particle surfaces, their study provided a new idea for our research. In this article, based on our previous research (Lv, Zhang, and Xu Citation2020), an Environmental Scanning Electron Microscopy (ESEM) system is used to obtain direct and detailed visualization of the heterogeneous condensation process at the micro level, with fractal dimension being used to characterize particle surface topography. The results are presented here.
2. Preparation of particle surfaces with different topographies
Monodisperse SiO2 particles were chosen for this study because heterogeneous condensation depends on particle composition, and SiO2 is one of the major components of coal-fired fine particles. Smooth SiO2 particles (made in Tianjin Baseline Chromtech Research Centre) were used as comparative tests for rough particles. Surface chemical modification was employed to obtain rough particles. First smooth particles were mixed with deionized water to prepare particle suspensions and dispersed ultrasonically for 10 min. 4-oxo-4-[[3-(triethoxysilyl)propyl]amino]-2-Butenoic acid was selected as a silane reagent for carboxyl groups and mixed with deionized water to prepare silane precursors solutions. Then suspensions containing SiO2 particles were added into precursors solutions and heated for an hour. After dispersing particles by centrifugation, the supernatant was discarded and particles were re-suspended in water. This cleaning process was repeated three times. Finally particles were freeze-dried and heated for subsequent condensation experiments. When a particle’s surface was patterned with rich carboxyl functional groups, irregular structure with a certain roughness can be obtained. The concept of surface roughness mentioned in this article referred to the change of macro roughness caused by the change of surface protuberances structure, rather than micro-scale surface roughness. In the process of surface modification, the most important thing was that the carbon chain which connected carboxyl groups to the surface was lengthened, resulting in a particle surface that was hydrophobic. Therefore, the effect of carboxyl groups on the hydrophilicity of particle surfaces was not considered and the effect of particle surface topography was only considered. In this study, the carboxyl content was altered to prepare four kinds of particle surfaces with different topographies. The corresponding modification parameters are shown in . The morphological information of two typical smooth and rough particles obtained by Transmission Electron Microscopy (TEM) is illustrated in . In the untreated particles are about 1.0 µm in uniform size with a smooth surface. In , the rough particles consist of irregular but almost spherical particles of 1.0-2.0 µm in size.
Figure 1. (a) TEM of smooth particles. (b) TEM of rough particles.
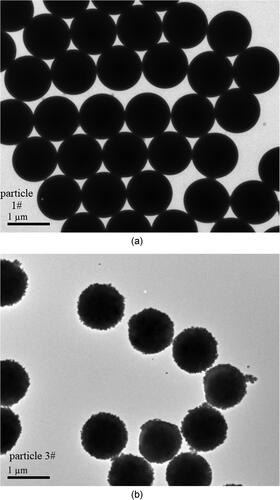
Table 1. Main controlled parameters of surface chemical modification.
3. Determination of surface fractal dimension
Mandelbrot (Citation1982) proposed a new mathematical geometry of fractal structure to represent complex graphics. Fractal dimension can be used to scale the irregularity and complexity of a rough surface quantitatively. The measurement of fractal dimension is determined by a proportional relationship, which is
(1)
(1)
In this formula, Lf is the linear scale of the measurement and Df is the fractal dimension. There are many methods of measuring the fractal dimension of irregular surfaces, such as the perimeter-area method, the box-counting method and the Sandbox method, etc (Mu et al. Citation2008; Yan et al. Citation2009). Due to the characteristically clustered distribution of the particles, the superficies-gyration radius method was used in this work to obtain more accurate fractal dimensions of the particles’ surfaces.
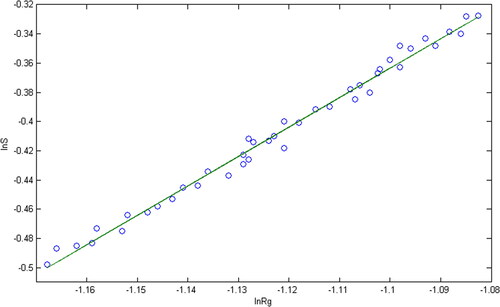
First, the image of was binarized. After removing the aggregates with incomplete boundaries, the superficies M and the gyration radius Rgof each fractal body were then calculated by image pixel analysis. Finally, in the plotting lnM∼lnRg, if there is a straight line, the slope of the straight line is fractal dimension Df, which is illustrated as
(2)
(2)
is the fractal scale of rough particles obtained from the TEM image in . It can be seen that the logarithm between the gyration radius and the superficies has a good linear relationship. According to the slope of the straight line in , Df =2.018 can be obtained. The fractal dimension of the four rough particles in Part 2 is shown in column 5 of . The data suggest that the treated particles samples have obvious fractal characteristics.
Figure 2. Logarithm of gyration radius and superficies.
4. Heterogeneous condensation experiments
An Environmental Scanning Electron Microscopy (ESEM) system (Model Quanta 200, USA) was adopted to investigate the heterogeneous condensation of water vapor on SiO2 particles. Further details are given in our previous work (Lv, Zhang, and Xu Citation2020).
4.1. Preparation before experiment
Due to the spacial limitations of the ESEM system, the sample of SiO2 particles can only be dispersed on a 3.0 × 3.0 mm substrate. However, in this circumstance water vapor would also condense on the substrate. To avoid this interference, a sol-gel method was used to prepare a nano-silica/sol solution. This kind of super-hydrophobic solution was spayed onto a mono-crystalline silicon slice to prepare a super-hydrophobic substrate. Then sample particles were dispersed on this super-hydrophobic substrate to prepare a mixed surface. Here particles were put into the solution of alcohol and then the solution was handled by ultrasonic to disperse the particles. After that, the particles-contained solution was moved to the surface of the super-hydrophobic substrate. The preparation of the hybrid super-hydrophobic/fine particles surface was finished after the alcohol was evaporated completely. The contact angles of the SiO2 particles and the super-hydrophobic substrate were examined by employing the sessile drop method with a contact angle goniometer (Model JC2000D, China), and were found to be ∼40° and ∼160°, respectively. According to the published literature (Fletcher Citation1958; Chen, Hung, and Hsu Citation1993; Tammaro et al. Citation2012), water vapor would preferentially condense on the surface of the particles rather than on the super-hydrophobic substrate.
4.2. Experimental procedure
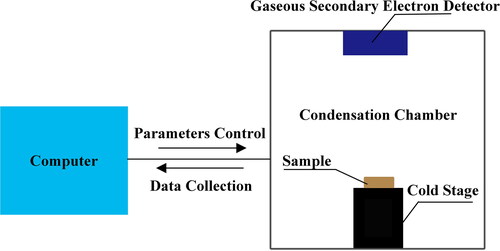
A schematic diagram of the ESEM is shown in . The ESEM system has three modes: High Vacuum, Low Vacuum and ESEM. Before conducting the phase change experiments, the mode switch was set to ESEM. The condensation chamber door was opened and a cold stage installed. The cold stage is a key device for observation of the whole condensation process. Through temperature control of the cold stage, heterogeneous nucleation and droplet growth of water vapor on particles surface can be controlled. Next, a Gaseous Secondary Electron Detector (GSED) was installed. The GSED is used to visualize the condensation process. Finally, the prepared sample was placed onto the cold stage and the chamber door closed to start the experiment. A computer next to the condensation chamber was used for data collection and control of parameters. Through this computer, the chamber pressure was adjusted and the temperature of the cold stage was slowly decreased until embryo drops on the surface of the particles were observed. Video footage of the entire condensation process was recorded for offline analysis.
Figure 3. Schematic diagram of the ESEM.
5. Results and discussion
5.1. The location of the embryo drop
The time-resolved images captured by ESEM video are illustrated below. shows water vapor condensation on the surface of particle 1#, and the particle size is 1.0 µm with a smooth surface. The chamber pressure has been maintained at 600 pa. The temperature of the sample has been slowly decreased and ultimately maintained at −2.3 °C by the cold stage. It can clearly be seen that only one embryo drop forms on the particle surface of a certain edge. As the vapor continues to condense, this embryo drop enlarges in the shape of a spherical cap and subsequently grows into a spherical shape. In order to confirm this phenomenon, a lot of condensation experiments with different vapor pressures and ESEM temperatures are carried out. shows the condensation process on another smooth single particle 2# of 1.0 µm in size. The chamber pressure here is 1000 pa, and the sample temperature has been kept at 7.0 °C. As shown in , only one embryo drop forms randomly on the particle surface, and then keeps growing into a spherical drop. Compared with vapor condensation on smooth particles, there are some differences in the condensation process on rough particles. From the time-resolved images in , the number of the embryo drop is no longer only one, but arbitrarily any.
Figure 4. Time-resolved images of smooth particles.
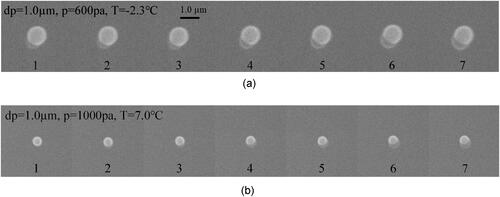
Figure 5. Time-resolved images of rough particles.
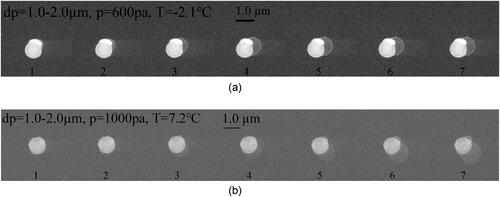
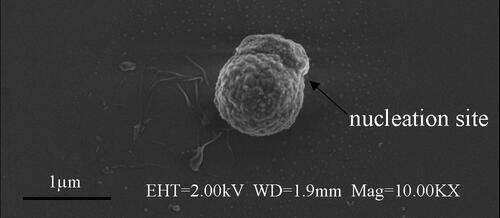
Several embryo drops form simultaneously at several locations on a single rough particle. In , it can be found that there is only one embryo drop on the particle surface. While in , there are two embryo drops. Moreover, the location of the embryo drop is no longer at a random position on the particles’ surface, but at the protuberances position of the surface. In order to obtain specific morphological information of the nucleation site where the embryo drop appears, a special mark was made on the particle in , which was then placed under a higher-resolution microscope by Field Emission Microscopy for observation, as illustrated in . It was found that the nucleation site was located on the protuberance of the particle’s surface.
Figure 6. FEM of SiO2 particle in .
5.2. Topography of the protuberance on the surface
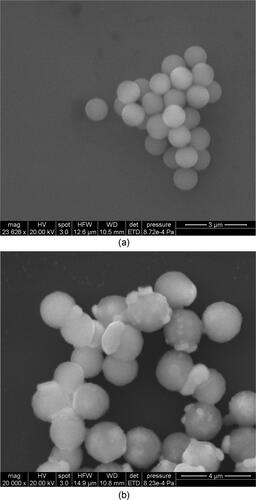
shows the surface topography of typical smooth particle #1 and rough particle #6 as characterized by Scanning Electron Microscopy (SEM). The images clearly indicate that the untreated particles are about 1.0 µm with a smooth surface, while the chemically modified rough particles show protrusions constituting the irregular structure of the surface. It can be seen that water vapor tends to condense into embryo droplets on the protruding parts of the particle surfaces more easily.
Figure 7. (a) SEM of smooth particles. (b) SEM of rough particles.
The theory of Gibbs free energy change can be used to interpret the different positions of nucleation sites for smooth and rough particles. According to Fletcher’s classic nucleation theory (1958), the possibility of embryo drop formation depends on the changes of Gibbs free energy barrier in the system. The free energy change of formation of an embryo drop is
(3)
(3)
where v is the vapor phase, l is the embryo drop, s is the particle, and σij is the interface free energy between phase i and j. ΔGv is the free energy change per unit volume when vapor changes from gas phase to liquid phase and can be obtained by
(4)
(4)
where Vwm is the volume of a single water molecule, kB is the Boltzmann constant, T is the vapor temperature.
In EquationEquation (3)(3)
(3) , Vl is the volume of the embryo drop. Slvand Sslare contact area between the embryo drop and vapor phase, contact area between the embryo drop and particle separately. The calculation of Vl, Slvand Sslare as follows:
(5)
(5)
(6)
(6)
(7)
(7)
r is the size of the embryo drop, R is the size of the particle. Then the angle ϕ, ψ and the distance d between the centers of the particle and the embryo drop could be found
(8)
(8)
(9)
(9)
(10)
(10)
where m is the cosine of the equilibrium contact angle θ0.
(11)
(11)
Substituting EquationEquations (4)–(11) into EquationEquation (3)(3)
(3) , the relationship between free energy ΔG and droplet size r is calculated and illustrated in below. The parameter selection in the calculation process is shown in .
Figure 8. Influence of particle surface topography on free energy.
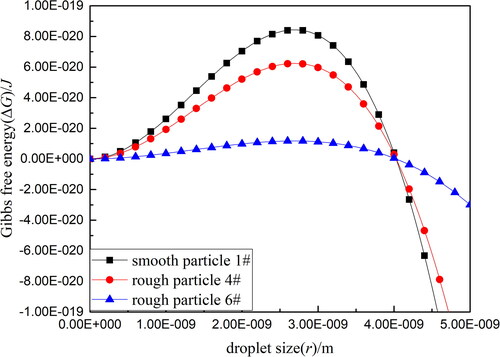
Table 2. The parameter for calculation of ΔG.
In , It can be seen that the free energy change ΔG first increases and then decreases with the enlargement of droplet size during the condensation process. And the extreme value ΔG* could be got, where corresponds to the critical point of droplet size r*. When the embryo drop grows to this critical value r*, the free energy change can also reach the maximum ΔG*. Once this occurs, the free energy barrier drops rapidly as the drop continues to grow into the later condensation process spontaneously. Importantly, the critical free energy ΔG* on the surface of smooth particle 1# is higher than that on the surface of rough particle 4# (Df = 2.094), and the critical free energy ΔG* on the surface of rough particle 4# is higher than that on the surface of rough particle 6# (Df = 2.256). That is to say, the irregular structure of particle surface is beneficial to reduce the free energy barrier of droplet formation and improve the nucleation ability accordingly.
It is also clearly found that only one embryo drop is formed at a random point on the surface of a smooth SiO2 particle because once an embryo drop is formed, the free energy change in the system at this moment is less than that required to form a critical embryo drop. In order to form a new critical embryo, the maximum energy barrier needs to be overcome in a new nucleation system. Thus, water vapor would continue to condense on the initially formed embryo rather than forming a new embryo on other sites of the particle surface (Lv, Zhang, and Xu Citation2020). By contrast, the nucleation site on the rough particles is at the protuberance of the particle’s surface because the gas-liquid surface tension is reduced, thereby reducing the critical free energy change at this position. Thus the protuberance position is more likely to form embryo droplets.
5.3. The number of nucleation sites
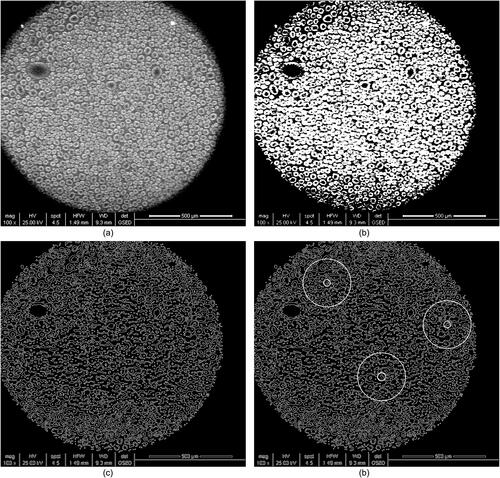
The number of nucleation sites can be obtained experimentally since the condensation nuclei can be recognized based on condensation images. The typical results of smooth particle #1 as an example are shown in . First the distributions of nucleation sites were scanned with an ESEM system after heterogeneous condensation in . A median filter function was used to remove noise and get a smooth image. After binary image processing in , a Canny edge detection method was used to obtain the boundaries of the droplet, cavity, and gap, as illustrated in . Next the outer edge of the droplet was located based on Hough transform as shown in . A circle with a radius of 50 pixels units was drawn at the center of this droplet. Lastly three circles were randomly selected as sampling circles to calculate the average number of nucleation sites Ne.
Figure 9. Distributions of nucleation sites on particle #1 after heterogeneous condensation. (a) ESEM scanned image; (b) image processing after binarization; (c) boundaries acquisition by Canny edge detection; (d) droplet detection based on Hough transform and random selection of three sample circles to calculate the number of droplets.
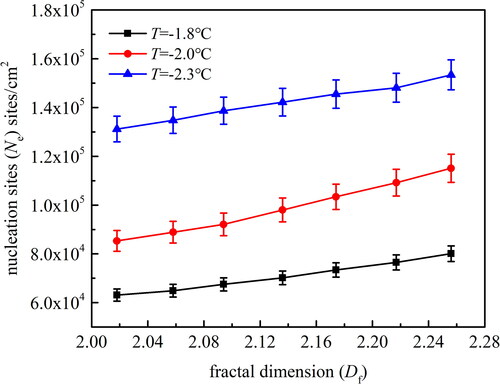
Three sets of experiments on all the particle surfaces at different temperatures of the cold stage were selected. The average results are shown in . In order to better demonstrate the influence of surface fractal dimension on nucleation sites, in addition to the four kinds of particle surfaces with different topographies listed in , the additional three kinds of rough particles with fractal dimensions of 2.058, 2.136 and 2.217 are prepared and the results are also shown in . It can clearly be seen that the number of nucleation sites increases with a decrease in the cold stage temperature. For the rough particle with fractal dimension of 2.058, the corresponding nucleation sites are 6.49 × 10⁴/cm2, 8.89 × 10⁴/cm2 and 1.348 × 10⁵/cm2 when the cold stage temperature is −1.8 °C, −2.0 °C and −2.3 °C, respectively. This is because when the temperature of the cold stage is slowly decreased, the surface subcooling, which is the vapor-to-surface temperature difference, increases, thereby causing the minimum nuclear radius to decrease. Thus the nucleation ability increases and the number of nucleation sites increases accordingly (Le Fevre and Rose Citation1965; Graham and Griffith Citation1973). Meanwhile, nucleation sites surge not only with the temperature of the cold stage but also with surface fractal dimensions. The experimental data shows that increasing fractal dimensions significantly increases nucleation sites Ne. When the cold stage temperature is −2.0 °C, the corresponding nucleation sites are 8.89 × 10⁴/cm2, 9,80 × 10⁴/cm2 and 1.092 × 10⁵/cm2 when the surface fractal dimension is 2.058, 2.136 and 2.217, respectively. According to Fletcher’s nucleation theory (1958), for smooth and uniform particle surfaces, the contact angle is defined as EquationEquation (11)(11)
(11) in section 5.2, where θ0 is the equilibrium contact angle for smooth particle surfaces. For the irregular particle surface with fractal structure, the relationship between the fractal apparent contact angle and the equilibrium contact angle is (Shibuichi et al. Citation1998)
(12)
(12)
Figure 10. Relationship of fractal dimension and nucleation sites under different subcoolings.
Here l and L are the measurement scales of the minimum and maximum surface area of the fractal body, respectively, Dfis the fractal dimension, θf is the apparent contact angle, and mf is the cosine value of the apparent contact angle of the irregular particle. For a smooth particle surface, θ0 is a constant value. However, for an irregular particle surface, the three-phase boundary line is on the slope with different dip angles, causing the apparent contact angle θf to change, as shown in . When the equilibrium contact angle θ0 is less than 90° (θ0 of a smooth SiO2 particle is ∼40° in this work), the three-phase boundary line is on the slope with a negative angle according to the principle of minimum energy. Thus the apparent contact angle
measured relative to the horizontal plane decreases. The rougher the surface is, the larger the inclination angle
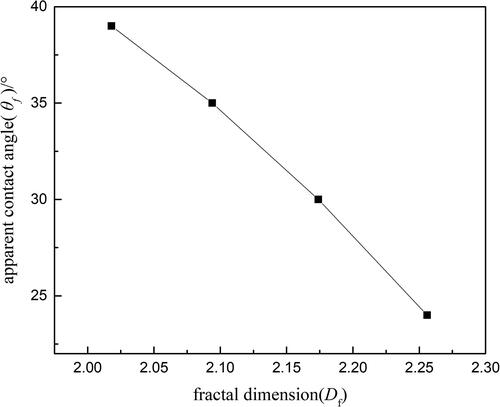
and the greater the decrease in the apparent contact angle θf. below shows the relationship between the apparent contact angle and fractal dimensions of four typical treated sample particles. It can be found that when the fractal dimension increases, the apparent contact angle decreases significantly. Thus from EquationEquation (12)
(12)
(12) and , it can be found that when the fractal dimension increases, the apparent contact angle decreases accordingly. Then the liquid-vapor surface tension σlv decreases too. The particle’s surface is more easily wetted, and at the same time the minimum nuclear radius decreases as well, all of which cause the nucleation sites to increase dramatically. Therefore, surface topography has an important effect on the number of the nucleation sites in the heterogeneous condensation process.
Figure 11. Schematic diagram of the three-phase contact line on slopes with different inclination angles on the surface of irregular particles.
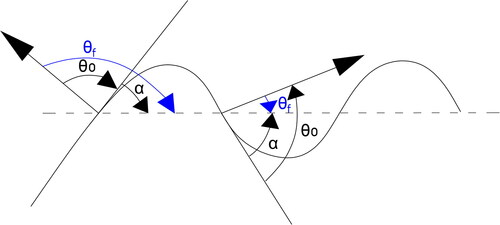
Figure 12. Relationship between the apparent contact angle and fractal dimensions.
5.4. Critical supersaturation
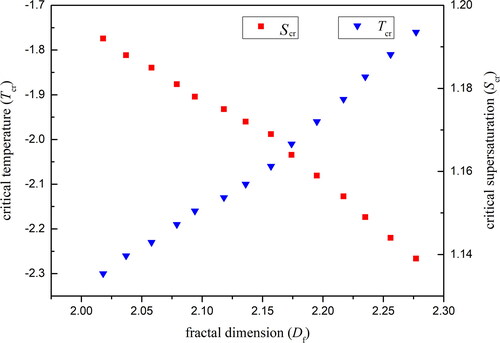
In the heterogeneous condensation process, particles act as the condensation nuclei, and once the supersaturation exceeds a critical value, nucleation occurs and water vapor begins to condense on the particle’s surface (Porstendorfer et al. Citation1985; Gorbunov and Hamilton Citation1997). In the present experiment, no embryo drops were observed on the particle surfaces at the beginning when slowly decreasing the temperature of the cold stage. As the temperature of the cold stage continued to decrease, a significant heterogeneous condensation phenomenon was observed where almost 50% SiO2 particles were activated as the condensation nuclei. This means the supersaturation at this time was high enough to cause the nucleation process to occur. Thus the onset of heterogeneous nucleation was investigated by recording this critical temperature Tcr as a function of the experimental critical supersaturation Scr. The dependence of the critical temperature and the critical supersaturation on fractal dimensions were determined experimentally and are plotted in . It is clearly found that the critical temperature increases with an increase in the fractal dimension, which means that the critical supersaturation decreases accordingly. The critical supersaturation for smooth SiO2 particles is 1.192, while for irregular rough particles with a fractal dimension of 2.277, the critical supersaturation decreases to 1.139. These results show that the irregular structure of rough particles’ surface are helpful in reducing the value of the critical supersaturation.
Figure 13. Relationship of fractal dimension and critical supersaturation under different temperatures.
6. Conclusions
The foregoing study found that only one embryo drop randomly occurs on the surface of smooth particles in the vapor condensation process, while on irregular particles, the number of embryo drops is no longer only one, and the location of embryo drop is no longer at any random position but at the protuberance. The study also found that the number of nucleation sites is greatly influenced by the particle’s surface topography, with nucleation sites increasing significantly with increases in surface fractal dimensions. Finally, an increase in the critical temperature of the cold stage required to activate the condensation process indicates that the value of the critical supersaturation decreases when the surface fractal dimension increases. In this work, fractal dimension is proposed as a parameter to characterize the irregular structure of particles’ surface, combined with the visualization experiment of water vapor condensation by ESEM, the direct relationship between surface topography and heterogeneous condensation is experimentally derived. This is undoubtedly a step forward to the quantitative and microscopic understanding of the relationship between particle surface topography and water vapor condensation.
Additional information
Funding
References
- Bao, J., L. Yang, J. Yan, G. Xiong, B. Lu, and C. Xin. 2013. Experimental study of fine particles removal in the desulfurated scrubbed flue gas. Fuel 108:73–9.
- Chen, C., and C. Tao. 2000. Condensation of supersaturated water vapor on submicrometer particles of SiO2 and TiO2. J. Chem. Phys. 112 (22):9967–77. doi:https://doi.org/10.1063/1.481633.
- Chen, C.-C., L.-C. Hung, and H.-K. Hsu. 1993. Heterogeneous nucleation of water vapor on particles of SiC, SiO2, Al2O3, TiO2, and carbon black. J. Colloid Interface Sci. 157 (2):465–77. doi:https://doi.org/10.1006/jcis.1993.1209.
- Cui, L., X. Song, Y. Li, Y. Wang, Y. Feng, L. Yan, and Y. Dong. 2018. Synergistic capture of fine particles in wet flue gas through cooling and condensation. Appl. Energy 225:656–67. doi:https://doi.org/10.1016/j.apenergy.2018.04.084.
- De Joannon, M., G. Cozzolino, A. Cavaliere, and R. Ragucci. 2013. Heterogeneous nucleation activation in a condensational scrubber for particulate abatement. Fuel Process. Technol. 107:113–8. doi:https://doi.org/10.1016/j.fuproc.2012.10.004.
- Fan, F.,. L. Yang, J. Yan, and Z. Yuan. 2009. Numerical analysis of water vapor nucleation on PM2.5 from municipal solid waste incineration. Chem. Eng. J. 146 (2):259–65. doi:https://doi.org/10.1016/j.cej.2008.06.009.
- Fan, Y., F. Qin, X. Luo, L. Lin, H. Gui, and J. Liu. 2013. Heterogeneous condensation on insoluble spherical particles: Modeling and parametric study. Chem. Eng. Sci. 102:387–96. doi:https://doi.org/10.1016/j.ces.2013.08.040.
- Fletcher, N. H. 1958. Size effect in heterogeneous nucleation. J. Chem. Phys. 29 (3):572–6. doi:https://doi.org/10.1063/1.1744540.
- Glicksman, L. R., and A. W. Hunt. 1972. Numerical simulation of dropwise condensation. Int. J. Heat Mass Transf. 15 (11):2251–69. doi:https://doi.org/10.1016/0017-9310(72)90046-4.
- Gorbunov, B., and R. Hamilton. 1997. Water nucleation on aerosol particles containing both soluble and insoluble substances. J. Aerosol Sci. 28 (2):239–48. doi:https://doi.org/10.1016/S0021-8502(96)00070-5.
- Graham, C., and P. Griffith. 1973. Drop size distributions and heat transfer in dropwise condensation. Int. J. Heat Mass Transf. 16 (2):337–46. doi:https://doi.org/10.1016/0017-9310(73)90062-8.
- Heidenreich, S., U. Vogt, H. Büttner, and F. Ebert. 2000. A novel process to separate submicron particles from gases-a cascade of packed columns. Chem. Eng. Sci. 55 (15):2895–905. doi:https://doi.org/10.1016/S0009-2509(99)00554-0.
- Lammel, G., and T. Novakov. 1995. Water nucleation properties of carbon black and diesel soot particles. Atmos. Environ. 29 (7):813–23. doi:https://doi.org/10.1016/1352-2310(94)00308-8.
- Le Fevre, E. J., and J. W. Rose. 1965. An experimental study of heat transfer by dropwise condensation. Int. J. Heat Mass Transf. 8 (8):1117–33. doi:https://doi.org/10.1016/0017-9310(65)90139-0.
- Lv, L.,. J. Zhang, and J. Xu. 2020. Microscopic visualization of heterogeneous nucleation process on smooth spherical particle: method and results. Chem. Eng. Sci. 213:115411. doi:https://doi.org/10.1016/j.ces.2019.115411.
- Mandelbrot, B. B. 1982. The fractal geometry of nature. New York: Freeman.
- McCormick, J. L., and J. W. Westwater. 1965. Nucleation sites for dropwise condensation. Chem. Eng. Sci. 20 (12):1021–36. doi:https://doi.org/10.1016/0009-2509(65)80104-X.
- Mu, C., J. Pang, Q. Lu, and T. Liu. 2008. Effects of surface topography of material on nucleation site density of dropwise condensation. Chem. Eng. Sci. 63 (4):874–80. doi:https://doi.org/10.1016/j.ces.2007.10.016.
- Porstendorfer, J., H. G. Scheibel, F. G. Pohl, O. Preining, G. Reischl, and P. E. Wagner. 1985. Heterogeneous nucleation of water vapor on monodispersed Ag and NaCl particles with diameters between 6 and 18 nm. Aerosol. Sci. Technol. 4 (1):65–79. doi:https://doi.org/10.1080/02786828508959039.
- Shibuichi, S.,. T. Yamamoto, T. Onda, and K. Tsujii. 1998. Super water- and oil-repellent surfaces resulting from fractal structure. J. Colloid Interface Sci. 208:287–94. doi:https://doi.org/10.1006/jcis.1998.5813.
- Smorodin, V. Y., and P. K. Hopke. 2006. Relationship of heterogeneous nucleation and condensational growth on aerosol nanoparticles. Atmos. Res. 82 (3–4):591–604. doi:https://doi.org/10.1016/j.atmosres.2006.02.015.
- Tammaro, M., F. Di Natale, A. Salluzzo, and A. Lancia. 2012. Heterogeneous condensation of submicron particles in a growth tube. Chem. Eng. Sci. 74:124–34. doi:https://doi.org/10.1016/j.ces.2012.02.023.
- Xu, J., Y. Yu, Y. Yin, J. Zhang, and H. Zhong. 2017. Heterogeneous condensation coupled with partial gas circulation for fine particles abatement. Chem. Eng. J. 330:979–86. doi:https://doi.org/10.1016/j.cej.2017.08.047.
- Yan, J., L. Yang, F. Fan, and X. Shen. 2009. Numerical analysis of water vapor nucleation on fine particles from coal combustion based on fractal model. Proc. CSEE 29 (11):50–56
- Yang, L., J. Bao, J. Yan, J. Liu, S. Song, and F. Fan. 2010. Removal of fine particles in wet flue gas desulfurization system by heterogeneous condensation. Chem. Eng. J. 156 (1):25–32. doi:https://doi.org/10.1016/j.cej.2009.09.026.
- Yu, Y., J. Zhang, and H. Zhong. 2019. Heterogeneous condensation of magnetized water vapor on fine SiO2 particles. Environ. Res. 169:173–9. doi:https://doi.org/10.1016/j.envres.2018.11.010.
- Zhang, B. J., C. Kuok, K. J. Kim, T. Hwang, and H. Yoon. 2015. Dropwise steam condensation on various hydrophobic surfaces polyphenylene sulfide (PPS), polytetrafluoroethylene (PTFE), and self-assembled micro/nano silver (SAMS). Int. J. Heat Mass Transf. 89:353–8. doi:https://doi.org/10.1016/j.ijheatmasstransfer.2015.05.060.