
Abstract
Current legislations typically characterize systems of aerosols, such as from vehicle exhaust, primarily by number concentration and size distributions. While potential health threats have a dependence on the particle size, the chemical composition of particles, including the volatile and semi-volatile components adsorbed onto nonvolatile particle cores present at roadside and urban settings, is important in understanding the impact of exhaust particles on health. To date, the only tools suitable for an online in-depth chemical aerosol characterization are aerosol mass spectrometers, which are typically composed of complex and cost intensive instrumentation. We present a new analytical system, which combines a novel inexpensive infrared-radiation-based evaporation system (HELIOS) with a commercially available highly efficient atmospheric ionization source (SICRIT) connected to a rather low-price ion-trap mass spectrometer. Our inexpensive, robust and mobile aerosol characterization HELIOS/SICRIT/Mass Spectrometry system enables highly sensitive chemical analysis of particle-associated volatile substances. We validate the HELIOS/SICRIT/Mass Spectrometry system in laboratory experiments with coated particles generated under controlled conditions, and show that the system is capable of identification of combustion-generated polycyclic aromatic hydrocarbons and relative quantification of individual chemical species adsorbed on particle surfaces. We then employ our system to analyze real-world vehicle engine exhaust aerosol and show through time-resolved measurements with high time resolution (<10 s) that the chemical composition of the particles changes during different parts of an engine test cycle.
Copyright © 2021 American Association for Aerosol Research
EDITOR:
1. Introduction
Current legislation on vehicle exhaust particle emission, such as Euro 6, limits the emitted particulate matter solely on physical properties, such as mass, number concentration, and size (EU Citation2007). These regulations currently do not account for chemical composition of the particulate matter. However, in order to assess the impact of exhaust particles on potential health, air quality, and climate, an understanding of their chemical nature is crucial. Aerosols dominating at roadside include fresh exhaust aerosols, which are composed of soot particles with volatile condensates, nucleation particles of volatile condensates, and nucleation particles with a nonvolatile core (Elder et al. Citation2004; Schneider et al. Citation2005). The volatile particles in fresh aerosol exhaust include particles of size less than 23 nm. Aged aerosol exhaust present in the urban environment include secondary organic aerosols from oxidized organics and sulfates (Kittelson Citation1998; Schneider et al. Citation2008). Both fresh exhaust aerosol particles and aged aerosol exhaust particles in the atmosphere should be analyzed in more detail regarding their chemical composition. The development of analytical methods capable of separating the adsorbed coating from a solid particle for the detection and characterization of the aforementioned aerosols is the focus of current major research projects in the European Union (e.g., www.downtoten.com) (Samaras et al. Citation2019). Heating can be used to separate an adsorbed coating from a solid particle core, as the vapor pressure of the adsorbed compound increases at elevated temperature, such that more of the compound will be found in the gas phase. The ideal analytical method for exhaust aerosol analysis should also be able to analyze the aerosols with a high time resolution, especially for exhaust analysis where fast changes of exhaust composition are observed, e.g., during diesel particle filter regeneration or at cold start events. Offline sampling methods such as filter collection are not appropriate to determine aerosol composition for these short-term events.
The current standard for online chemical aerosol characterization is aerosol mass spectrometers in various forms. Mass spectrometric instrumentation for aerosol analysis varies widely with respect to the type of mass spectrometer (MS) used as well as to the ionization and desorption sources (Kenseth and Petrucci Citation2016; Lopez-Hilfiker et al. Citation2019; Murphy et al. Citation1998; Radischat et al. Citation2015; Xu et al. Citation2018). A few devices have been designed to operate based on thermal desorption in combination with proton-transfer-reaction (PTR) MS (Eichler et al. Citation2015; Holzinger et al. Citation2010; Thornberry et al. Citation2009), which is a form of chemical ionization that relies on the transfer of a proton from H3O+ to the sample species. The ionization process in PTR is dependent on the proton affinity of the species, and the ionization is therefore species dependent and the technique is limited to species with a higher proton affinity than water. Direct Analysis in Real Time (DART) mass spectrometry is an atmospheric pressure ionization technique that operates by generating a hot ion source (i.e., metastable helium or nitrogen), of which Chan et al. have mixed with the aerosol samples to both ionize and heat the aerosol particles to lead to thermal desorption of species adsorbed onto the particles. (Chan et al. Citation2013) The ionization and heating mechanisms in DART-MS hence are inherently coupled. Another ionization method for the online analysis of aromatic hydrocarbons in exhaust is resonance-enhanced multiphoton ionization (REMPI), which requires complex and cost-intensive instrumentation, especially when combined with laser-based or thermal desorption methods (Bente et al. Citation2009; Radischat et al. Citation2015; Streibel et al. 2017). Additional aerosol mass spectrometers based on laser vaporization have been shown to be able to reveal the polycyclic aromatic hydrocarbons (PAHs) and the inorganic composition of individual aerosol particles simultaneously (Kenseth and Petrucci Citation2016; Öktem et al. Citation2004; Onasch et al. Citation2012; Woods et al. Citation2001). An example of an analytically powerful system capably of revealing the PAH and the inorganic composition of individual aerosol particles simultaneously combines a novel laser desorption and ionization method with an aerosol time-of-flight mass spectrometer (LDI-ATOF-MS), using two continuous-wave Nd:YAG lasers for velocimetric sizing, a pulsed CO2 desorption laser, and excimer lasers for ionization (Passig et al. Citation2017). These types of devices operating with laser-based desorption are extremely cost-intensive, technically complex, and depending on the type of laser used, they can be too bulky for field applications. While compact, low power consumption, cost effective laser systems can be found these days, any type of laser instrumentation still adds a higher cost to the system than alternative simple means of heating. A simple and inexpensive alternative to laser-based thermal desorption was demonstrated by Tobias et al. with a thermal desorption particle beam mass spectrometry (TDPBMS) system, based on temperature-programed thermal desorption by impact on a foil vaporizer, that can provide detailed chemical information about the formation of diesel engine nanoparticles, including nucleation of sulfuric acid, water and condensation of organic species (Tobias et al. Citation2001). While desorption methods based on impact can result in more uniform thermal desorption across all sample particles, for a single particle the desorption would only be spatially uniform in the case of total particle vaporization, and particle bounce off may be a concern (LaFranchi and Petrucci Citation2006).
We present here a new simple and low-cost aerosol mass spectrometer system, HELIOS/SICRIT/Mass Spectrometry, for online determination of particle-associated PAHs and other types of organic coating. HELIOS stands here for High Efficient LIght source for Optical Surface Desorption. The HELIOS system is based on heating with infrared (IR) light to achieve thermal desorption, and the SICRIT (Soft-Ionization by Chemical Reaction in Transfer) is a commercially available soft ionization source is used to decouple the thermal desorption and ionization steps. Our device is validated through laboratory experiments with controlled coated particles, showing that our system can provide a relative quantification of changes in the amount of the volatile substance adsorbed onto solid particles, and an absolute quantification of concentration can be achieved through further calibration with reference instrumentation. After laboratory validation, we apply our HEILOS/SICRIT/Mass Spectrometry system in field measurements to demonstrate the feasibility of online analysis of engine exhaust from a VW Up, and show how our system can provide important information on chemical composition that cannot be obtained through particle size measurements alone.
2. Experimental
2.1. Helios/SICRIT/mass spectrometry aerosol measurement system
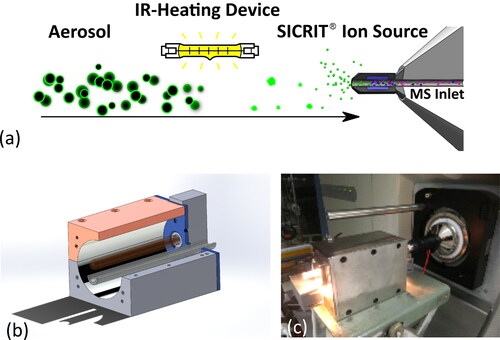
Our aerosol HELIOS/SICRIT/Mass Spectrometry system consists of three parts: an evaporation system based on infrared (IR) light, called HELIOS, the SICRIT ionization source (Plasmion GmbH, Augsburg, Germany) based on an atmospheric pressure cold plasma, and an ion trap mass spectrometer. illustrates the principle of operation of the HELIOS/SICRIT/MS system. Our in-house fabricated HELIOS unit consists of a 100 W linear halogen IR lamp (R7s, RS Components, Mörfelden, Germany) which is mounted in one focal axis of an elliptical cavity of 100 mm length and half axes of 20 mm and 24 mm (see ). The lamp is connected to a dimmer (Kemo M028N, Langen, Germany) making intensity control possible, and normal operation was chosen to use a lamp power of 15 W, resulting in a gas temperature at the output of the HELIOS between 100 and 120 °C (discussed further in Section 3.1). The sample aerosol flows through a quartz glass tube of 6 mm outer diameter (4 mm inner diameter) that is guided through the other focal axis of the ellipsoid. The elliptical cell is made of stainless steel with a polished inside surface, efficiently reflecting IR radiation, resulting in low losses and efficient heating of the sample flow. Strong focusing of IR light causes heating of the aerosol particles in the sample stream and eventually desorption of volatile substances from the aerosol surface. The gas temperature is monitored downstream of the HELIOS unit by a thermocouple. The mixture of organic components exiting the HELIOS unit, including gas-phase components and nonvolatile core particles, passes subsequently through the SICRIT ionization source. The SICRIT source is described in detail elsewhere (Wolf et al. Citation2015). Briefly, a high sinusoidally modulated voltage is applied to two concentric electrodes (a stainless-steel capillary inside a copper ring), between which the sample stream passes through in a quartz glass capillary, to ignite a plasma by dielectric discharge. This plasma ionized the sample stream in a soft way, inducing very few or no fragmentation (Mirabelli et al. Citation2017). The advantage of this ionization source is its high sensitivity for detection of anayltes in the vapor phase due to ion generation via dielectric barrier discharge ionization (Wolf et al. Citation2016). The SICRIT source is attached to a linear ion trap Mass Spectrometer (Finnigan LTQ, Thermo Fisher Scientific, Dreieich, Germany, unit resolution, mass range m/z 50-2000). shows a photograph of the HELIOS unit coupled to the SICRIT ion source and mass spectrometer. The entire system is mounted into two racks of 1 m × 1 m × 1 m each, which can be stacked together to form a wheeled rack, making it transportable in a normal van.
Figure 1. (a) Operating principle of the HELIOS/SICRIT/Mass Spectrometry system. Aerosols coated with an organic compound enter the HELIOS unit, which desorbs the particle coating through IR radiation before the sample enters the SICRIT and mass spectrometer. (b) 3D Drawing of the HELIOS unit. (c) Photograph of the HELIOS unit coupled to the SICRIT and mass spectrometer.
For the experiments presented in this article, a pump (KNF VDE 0530) maintained a flow of approximately 4 L min−1 in the sampling line from the aerosol source to the instrument. This high flow rate allowed a sample to reach the measurement system quickly. A part of this flow (800 mL min−1) entered the measurement system, while the excess flow was removed from the workspace, e.g., via a fume hood. The total residence time in the inlet with a tube length of 5 mm was calculated to be 1 s, the integration time of the mass spectrometer was set to 0.3 s, and the fastest 10-to-90% rise time upon transient loading was found to be 5.6 s. Because of the temporal inertia of the total system, we did not expect to find shorter rise times, even so the calculated values of our system should be lower.
All measurements shown in this article have been performed using the positive mode of the mass spectrometer for analysis of hydrocarbon compounds. Data was collected using the Xcalibur™ Software (Thermo Fisher Scientific). The aerosols analyzed with the HELIOS/SICRIT/MS were also characterized with different types of reference instrumentation, such as SP-AMS and GC-MS, described in detail in the online supplementary information (SI).
2.2. Laboratory aerosol generation
Soot particles with an inherent PAH coating were created with a propane diffusion flame from in-house-made burner for a fundamental characterization of the HELIOS/SICRIT/MS system. The burner works with a propane flow of 0.08 L min−1, 2.3 L min−1 of dry air and a flow of 5 L min−1 of nitrogen to assure the incompleteness of the combustion and the formation of soot particles and the other unburned organic combustion products. Throughout these experiments, the particle concentrations as measured with a scanning mobility particle sizer (SMPS) were in the range of 3 × 105 cm−3 with a count median diameter (CMD) of 230 nm and a geometric standard deviation (GSD) of 1.60. This system represents a good and easily controllable proxy for exhaust gas, since it allows the production of soot particles coated with the typical products of an incomplete combustion, mainly PAHs. A denuder filled with activated carbon (AIRPEL 10, 950 m2/g, Desotec, Belgium) was used to reduce the volatile fraction of compounds present in the exhaust flow.
Anthracene-coated soot particles with a controlled PAH coating were generated for testing the capability of our system to quantitatively detect PAH coating. To generate these soot particles with a controlled anthracene coating, soot particles were generated using an acetylene-fueled McKenna flat flame burner (Holthuis & Associates, CA, USA). The soot particles from the burner were first flown through an in-house built catalytic stripper (described by Amanatidis et al. [Citation2018]) at 350 °C to remove volatile species. After the catalytic stripper, the soot particles were coated with anthracene (C14H10), a typical combustion-associated PAH, using a tube furnace (Carbolite MTF 12/38/400). A separate quartz glass tube with a small amount of anthracene (∼5 mg) was placed inside the tube furnace, and fittings at both tube ends ensured airtight flow system. The amount of anthracene in the gas phase was adjusted by varying the temperature of the tube furnace (130–150 °C), and thus the amount of anthracene coating on the soot particles was controlled. A porous tube diluter was used after the glass tube to provide sample flow and to cool the flow to facilitate the condensation of anthracene on the soot particles. As the flow rate through this aerosol generation system was 2 L min−1, the sample gas flow was reduced to 1.8 L min−1. An ejector diluter (Dekati DI-1000) was used after the porous tube diluter to dilute the sample. The complete setup is depicted in (3a). The mean particle size was measured with the SMPS to be between 60 and 120 nm. A soot-particle aerosol mass spectrometer (SP-AMS, Aerodyne Research Inc., USA, described in detail by Onasch et al. [Citation2012]) was set up to make measurements in parallel with our HELIOS/SICRIT/Mass Spectrometry system.
Stable and monodisperse PEG-coated aerosol particles with a sub-100-nm solid nonvolatile core were used to characterize the ability of the HELIOS/SICRIT/Mass Spectrometry system to quantitatively analyze volatile particle coatings. Controlled conditions enabled the application of defined thin layers of a known organic substance. PEG was chosen as a model substance for coating in the laboratory-based on its suitable boiling point and vapor pressure for vaporization and coating, respectively, and its nontoxic nature. For the nonvolatile particle core, copper particles were produced with a spark discharge generator (GFG 1000, Palas GmbH, Karlsruhe, Germany) with copper electrodes (Helsper et al. Citation1993), with a discharge spark frequency of 140 s−1 and an argon volume flow rate of 5.1 L min−1. This resulted in a particle size distribution with a count median electric mobility equivalent diameter of 59 nm and a geometric standard deviation of 1.44 as measured with the SMPS. The particles with size 16 nm were isolated from this polydisperse aerosol using a differential mobility analyzer (DMA 3071, TSI GmbH, Aachen, Germany) with sheath airflow rate of 25 L min−1 and aerosol flow rate of 4 L min−1, after the aerosol particles were charged with a radioactive bipolar charger (85Kr, approximately 95 MBq). The monodisperse 16 nm copper particles exiting the DMA were coated with a defined layer of polyethylene glycol (PEG 400, Sigma-Aldrich, St. Louis, MO, USA) by mixing the particles with PEG vapor (in nitrogen) in a ring-gap mixer. The PEG vapor was generated in a heating bath type S, Thermo Haake GmbH with temperatures between 90 and 103 °C while the mixing nozzle was maintained at a temperature 10 °C higher than the oil bath. Downstream of the particle coater, the gas flow was cooled in a reflux condenser to 0 °C (Niessner et al. Citation1990; Niessner and Helsper Citation1985). The PEG coating thickness could be controlled by several nanometers by varying the bath temperature. A diffusion battery (type 3042, TSI GmbH) was used in combination with a CPC model 3775, TSI GmbH to determine the size of the coated and uncoated particles with a size resolution of 0.2 nm (for 23 nm particles) (Niessner Citation1986). The coating thickness of the resulting PEG-coated aerosols was calculated from the difference between the diameters of the coated and uncoated particles, assuming a uniform coating. The PEG-coated copper nanoparticles generated for laboratory experiments used oil bath temperatures of 90, 95, 100, and 103 °C, yielding coating thicknesses of 2.6, 5.7, 9.6, and 12.2 nm, respectively. To eliminate any possible remaining traces of PEG in the gas phase, a denuder filled with activated carbon (AIRPEL 10, 950 m2/g, Desotec, Belgium) was set at the end of the line (length 0.5 m, room temperature) such that the sample exiting the denuder entered the HELIOS/SICRIT/MS after a time scale short enough that PEG re-evaporation was negligible (∼90 ms).
2.3. Real-world engine exhaust aerosols
Sampling of exhaust gas was performed on a VW Up running on alkylate petrol fuel. The vehicle engine was run on a WLTP (Worldwide Harmonized Light-Duty Vehicles Test Procedure) cycle with a steady-state start. Engine characteristics of the tested vehicle are listed in . Prior and after the test, a calibration adjustment and check was performed in all measurement devices.
Table 1. Test vehicle characteristics.
The dilution and sampling system used for exhaust particle number measurements is shown in . The sampling system was developed in the framework of the EU DownToTen project (in short: DTT) and can be used both for raw exhaust measurements in the tailpipe and for diluted aerosol sampling following a primary dilution in the CVS. In the current work, raw tailpipe sampling was conducted.
Figure 2. Chassis dynamometer measurement layout with the DTT sampling system at the exhaust tailpipe. TPN DTT was used for total particles (solid and volatiles). HELIOS/SICRIT was connected to the DTT TPN. Notes: MFC: Mass Flow Controller, TPN: Total Particle Number, EFM: Exhaust Flow Meter.
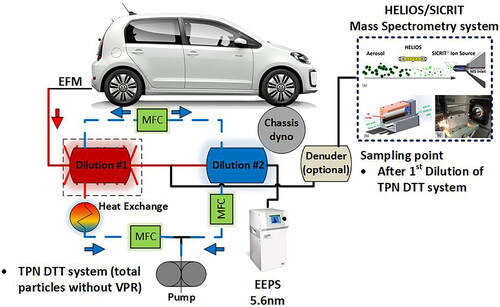
The initial configuration of the DTT sampling system consists of two porous tube dilutors in series. The first dilutor is heated (wall temperature at 350 °C) and is followed by a catalytic stripper (CS) at 350 °C wall temperature, used to separate nonvolatile particles. The second dilutor is not heated and operates with dilution air at ambient temperature. Dilution ratios in both dilutors were 10:1 per stage. In the all experiments being part of the DDT study, the CS was removed in order to investigate solid as well as volatile particles (in short: total particles or TPN). An Engine Exhaust Particle Spectrometer (EEPS) was used to measure the real-time particle size distribution in the exhaust after the TPN DTT sampling system as depicted in .
The HELIOS/SICRIT/MS sampled the raw exhaust after the first dilution step as shown in . Humidified nitrogen was added to the sampled exhaust stream at a rate of 0.4 L min−1. Measurements were taken with and without a denuder upstream of the HELIOS/SICRIT/MS system.
3. Laboratory validation results
3.1. Characterization of HELIOS-induced desorption using soot aerosols
Aerosols that pass through the HELIOS system are heated due to focusing of IR light on the sample stream, which can lead to evaporation of adsorbed substances, but partly also to fragmentation of organic substance from aerosol particles if the particle temperature becomes too high, as shown in this section through measurements of propane-flame-generated soot aerosol. Therefore, it was necessary to determine the optimal power of the IR lamp in a range where desorption of organic substances from the particle leads to a high signal from the ionized evaporated compounds, while avoiding fragmentation or thermal decomposition. The background-subtracted mass spectra at select HELIOS lamp powers (0 W, 15 W, and 60 W) from propane-flame-generated soot aerosol is shown in the SI (), illustrating that when the HELIOS system is switched off (0 W), intensity peaks at only a few mass-to-charge ratios (m/z) can be observed. These signals are attributed to volatile substances that evaporate during the ionization in the SICRIT source. At a lamp power of 15 W, evaporation of organic substances from the aerosol particles leads to high signals at more m/z values, such as m/z 227, 277, 301, 329, and 375, which are marked with dotted lines in in the SI. At a lamp power of 60 W, which corresponds to a gas temperature at the output of the HELIOS of approximately 180 °C, fragmentation and/or decomposition of the substances take place, characterized by the disappearing of the higher mass traces visible at 15 W, and the appearance of higher signals at lower m/z values (less than 120 m/z). shows the signal intensity at m/z 227, 277, 301, 329, and 375 from the soot aerosol measured with different HELIOS lamp powers. These masses are related to PAHs and their signal intensities increase as soon as the HELIOS lamp is turned on at low power. The maximum signal intensity of these m/z values occurs when the lamp power is between 5 and 25 W. We also note that the average total ion current (TIC) increases with lamp power from 0 to 15 W after which at higher lamp powers an approximately constant TIC is achieved. Based on these results, for the subsequent experiments described in this publication, the lamp power was set to 15 W, resulting in a gas temperature at the output of the HELIOS between 100 and 120 °C due to convective heating within the quartz capillary. Based on the geometry of the gas flow through the HELIOS, a convection analysis predicts that the maximum temperature of the glass tube in the HELIOS is approximately 170 °C.
The peaks seen in the mass spectra of the soot from the propane flame burner (m/z 227, 277, 301, 329, and 375) are mainly represented by PAHs formed due to incomplete combustion (Rhead and Hardy Citation2003). For these substances, the SICRIT ionization process leads to formation of [M + H]+ ions for this class of substances (Huba et al. Citation2018). The compounds corresponding to these peaks have been observed with other aerosol mass spectrometry systems. For example, Dzepina et al. used an Aerodyne aerosol mass spectrometer equipped with a quadrupole mass analyzer to sample laboratory-generated propane soot and field-collected aerosols from the Mexico City atmosphere to detect PAH-related peaks at m/z 226, 250, 276, 300 (Dzepina et al. Citation2007). Malmborg et al. (Citation2017) used a SP-AMS to analyze diesel engine exhaust and found PAH-related peaks at m/z 226, 276, 300. Our HELIOS/SICRIT/MS system, hence, can detect a range of PAHs similar to these aerosol mass spectrometry systems, without the need for the relative complex and expensive instrumentation. The most abundant parent ion from our data has a mass-to-charge ratio of m/z 227, as seen in the mass spectrum in with lamp power 15 W, corresponding to the chemical formula C18H10 H+. To confirm the chemical identification of the PAHs detected by our HELIOS/SICRIT/MS system, soot of the propane burner was subsequently collected on a filter and extracted with hexane, as described in the SI. GC/MS measurements of the extract confirmed the presence of PAHs of the above-mentioned masses. Consistent with our findings, the NIST library lists Benzo[ghi]fluoranthene (C18H10, MW = 226 g mol−1) as most abundant substance in environmental samples (Wallace Citation2018). The GC/MS spectra of the collected soot and of Benzo[ghi]fluoranthene are shown in the SI (, respectively).
3.2. Measurement of anthracene mass from PAH-coated soot
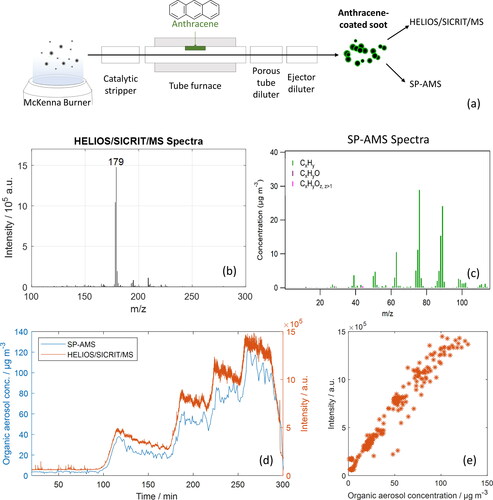
Our HELIOS/SICRIT/MS system was used to analyze laboratory-generated soot aerosol with a controlled coating of anthracene. A schematic of the process to coat the soot aerosol with anthracene is shown in . The mass of the anthracene coating was increased incrementally in time by increasing the temperature of the tube furnace. Representative mass spectra from the HELIOS/SICRIT/MS and the SP-AMS are shown in and c for the highest level of anthracene coating. The mass spectra from the HELIOS/SICRIT/MS illustrate that the vast majority of the signal originates from m/z 179, corresponding to the mass of protonated anthracene, which remains unfragmented after ionization. The mass spectra from the SP-AMS show only hydrocarbons present which originate from fragmented anthracene. The main fragments, at m/z 89, 76, 63, observed at the SP-AMS measurement range (m/z up to 115) are same to fragments observed in the NIST chemistry webbook for electron ionization mass spectra of Anthracene (Linstrom and Mallard Citation2018). The corresponding mass spectra for different levels of anthracene coating are shown in the SI (). compares the signal of our HELIOS/SICRIT/MS system at the mass-to-charge ratio corresponding to protonated anthracene (m/z 179) to data collected in parallel with the SP-AMS. The increasing mass of anthracene coated onto the soot particles can be seen as steps in time. shows the correlation for each time point of the HELIOS/SICRIT/MS signal for anthracene compared with the total organic aerosol concentration measured by the SP-AMS, and such a curve could be used for absolute quantitative calibration of the HELIOS/SICRIT/MS system for anthracene concentration. A linear regression of the curve yields a R2 = 0.95, with standard errors for the slope and intercept of 10% and 2%, respectively, confirming a linear relationship between the anthracene signal from the HELIOS/SICRIT/MS and total organic aerosol concentration based on mass spectra is mostly anthracene. According to the data, the signal measured by the HELIOS/SICRIT/MS can be used to determine the concentration of anthracene to within 15 µg/m3. Theoretical calculations show that at room temperature the gas-phase anthracene concentration can be considered negligible. The data from the SP-AMS shows the total concentration of organic aerosol, which increases with increasing mass of anthracene coating. Good correlation can be seen between the HELIOS/SICRIT/MS and SP-AMS both in temporal behavior and in relative intensities. Both systems demonstrate dynamic measurement capability. However, the HELIOS/SICRIT/MS data enables the identification of the molecular mass of the compound causing the increase of organic aerosol mass. This molecular ion cannot be seen in the SP-AMS data due to high fragmentation caused by the high-temperature desorption and evaporation process (Dzepina et al. Citation2007).
Figure 3. (a) Generation of anthracene-coated soot particles. (b) Representative mass spectra from the HELIOS/SICRIT/MS. (c) Representative mass spectra from the SP-AMS. (d) Anthracene-coated soot particles measured with the SP-AMS (Organic aerosol concentration, left axis, blue line) and HELIOS/SICRIT/MS (m/z 179, right axis, orange line). (e) Correlation of the intensity measured with the HELIOS/SICRIT/MS to the organic aerosol concentration measured by the SP-AMS for each measurement time.
3.3. Relative quantification of adsorbate mass in PEG-coated aerosols
The laboratory-generated PEG-coated aerosols provided a controlled amount of volatile/semi-volatile coating on a nonvolatile solid-core particle that could be quantified by the HELIOS/SICRIT/MS system. A schematic of the generation of these particles is shown in . A fraction of the mass spectrum from the PEG-coated aerosols measured with the HELIOS/SICRIT/MS system is shown in for a PEG coating of 12.2 nm. Peaks corresponding to PEG are clearly visible in the measured mass spectrum (m/z 239, 283, 327), indicating PEG chains of different lengths are present in the coating material. The peaks at m/z 203 and 297 part of the background contaminations. The mass trace of the time-resolved intensity for the signal at m/z 283 is shown in , showing the rise in signal intensity as the PEG-coated particles were introduced into the HELIOS/SICRIT/MS. The mass trace shows a time response of better than one second for detecting PEG-coated particles that are suddenly introduced into the system. This mass spectrum is representative of the amount of PEG that was desorbed from the solid particle cores, as a denuder was used upstream of the HELIOS/SICRIT/MS system to remove traces of PEG. The mass spectra and time-resolved mass traces for other coating thicknesses of PEG are shown in the SI ().
Figure 4. (a) Generation of PEG-coated copper particles. (b) Sample mass spectrum (HELIOS/SICRIT/MS) showing some of the typical peaks related to PEG. The figure shows the signal obtained for a coating thickness of 12 nm. Dotted lines are drawn at m/z 239, 283, and 327. The background spectra is also shown. (c) Corresponding time-resolved intensity of the signal at m/z 283. (d) Signal intensity for different coating layer masses of PEG (error bars represent one standard deviation of the measured signal) for m/z 239, 283, and 327.
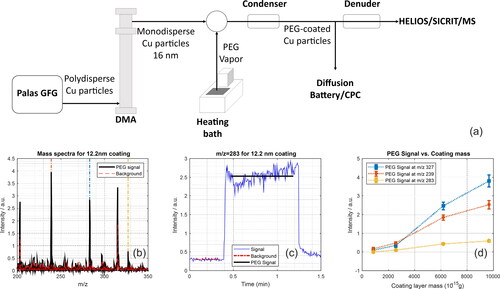
A quantitative evaluation of the coating thickness was carried out based on the intensity of the mass trace at mass peaks corresponding to PEG. shows the normalized intensity at m/z 239, 283, and 327 as a function of the coating thickness determined through the diffusion battery measurements for particle number concentrations of about 106 cm−3. Error bars show the standard deviation of the signal over the time interval that the PEG-coated particles entered the HELIOS/SICRIT/MS. A clear trend of increasing signal corresponding to an increasing thickness of coating on the core particle is seen. A coating thickness of only 2.6 nm PEG for a particle number concentration of 106 cm−3 is enough to reveal a signal significantly (40%) above the background for m/z 283 and 239, indicating that our system is capable of a detection sensitivity of coating a few nanometers thick. In , the layer mass, calculated on the assumption of a spherical particle with a homogeneous coating, is correlated to PEG signals at the three different m/z ratios. The measured signal and background levels indicate that coatings down to 2.2 nm, would yield a signal at m/z 283 and 239 higher than the background at this particle number concentration (106 cm−3). With above assumptions, this layer thickness corresponds to a total mass of 0.67 pg. It should be noted that the PEG-coated copper particles are not expected to be perfectly spherical, as the core particles could be agglomerated of smaller particles, therefore, the particle volume may not scale exactly with layer volume. Nonetheless, our results indicate that the measured HELIOS/SICRIT/MS intensity provides a good relative measurement of the mass of the PEG coating adsorbed on solid-core aerosol particles.
4. Engine exhaust measurements
After validation of our HELIOS/SICRIT/Mass Spectrometry system in the laboratory, the system was transported to the Aristotle University of Thessaloniki to monitor vehicle exhaust from a VW Up with different fuels, alkylate petrol and petrol.
shows the total ion current (TIC) of the measured from the HELIOS/SICRIT/MS system in real time during a World Harmonized Light Vehicles Test Procedure (WLTP) cycle after a steady-state start of the vehicle running on alkylate petrol. The TIC represents the summed intensity across the entire range of mass-to-charge ratios measured with the MS at each time point of the measurement. The TIC peaks at the start of the cycle, and increases during the middle of the cycle. The mass spectra at different time points in the cycle are shown in , illustrating that substances with different mass-to-charge ratios are responsible for the high TIC at different time points in the cycle. At the beginning of the cycle (, blue spectrum, 0 min) the dominant peaks are at m/z 111 and m/z 129. These substances are only present at the beginning of the cycle, as confirmed by their mass traces, shown in the SI (, respectively). When the TIC increases during the middle of the cycle (between 14 and 18 min), the dominant peaks are m/z 117 and m/y 159. These substances are not present at the beginning of the cycle, and only appear during the cycle as confirmed by their mass traces, shown in the SI (, respectively). The substances seen with m/z 111, 129, 117, and 159 are formed during combustion of the fuel, as these peaks are not seen in the mass spectrum of the unburnt fuel, shown in , which is composed primarily of alkanes.
Figure 5. (a) Total ion current (TIC) measured from the exhaust (gas and particle phase, no denuder) of a VW Up running on alkylate petrol during a WLTP cycle. (b) Mass spectrum of the unburnt alkylate petrol. (c–f) Sample mass spectrum during different time points in the cycle. The time points are marked in (a) with the same color code in the legend. All measurements: HELIOS/SICRIT/MS.
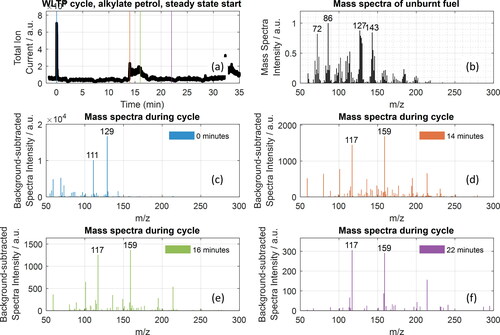
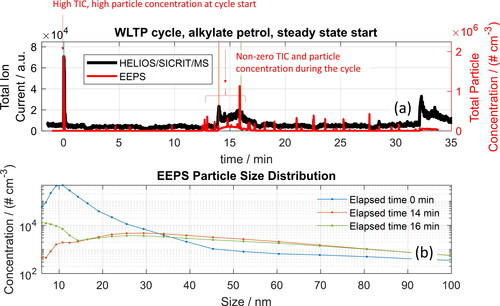
The total particle concentration in the exhaust measured in parallel with the HELIOS/SICRIT/MS is shown in . The TIC from the mass spectrometer correlates with the total particle count, as expected because more particles lead to more substances that can be desorbed and ionized. Similar to the chemical composition of the exhaust, the particle size composition changes at different points of an engine test cycle, as shown in . A large fraction of small particles (ca. 10 nm) are seen at the beginning of the cycle, whereas the particles formed in the middle of the cycle contain primarily particles on the order of several tens of nanometers. A comparison of the mass spectra during the cycle with the mass spectrum of the unburned alkylate petrol (), obtained by vaporizing a few microliters of unburnt fuel into the sample line heated to 191 °C and diluted with nitrogen, shows that most of the unburned fuel, which is composed largely of alkanes is removed during the combustion process.
Figure 6. (a) Comparison of TIC (HELIOS/SICRIT/MS, gas and particle phase, no denuder) and total particle concentration measured from the exhaust of a VW Up running on alkylate petrol during a WLTP cycle. (b) Particle distribution measured with EEPS during different time points in the cycle.
Unlike the substances that ionize through the SICRIT to form [M + H]+ ions (Huba et al. Citation2018), we have found that alkanes can ionize through the SICRIT to form a primary ion with m/z M + 13, M + 15, and M + 29, corresponding to M-H + O, M-3H + O, and M-3H + 2O, respectively, as shown in for iso-octane where the primary mass peaks are seen at m/z 127, 129, and 149. The mass peaks from iso-octane are also seen in , which is expected because iso-octane is a primary component of alkylate petrol.
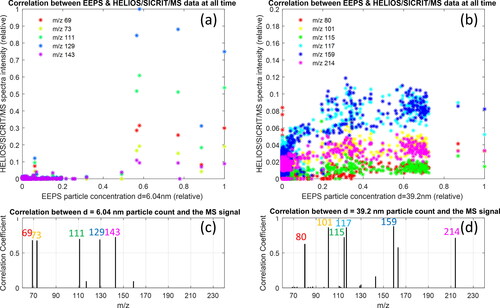
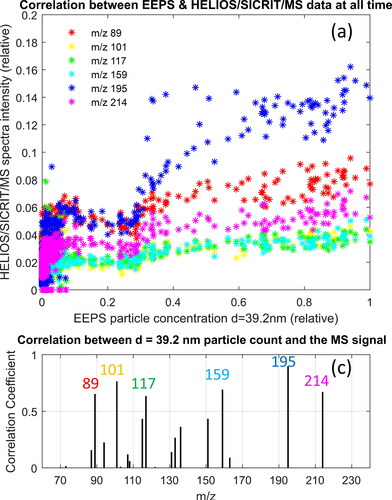
Correlation of the particle size distribution, measured with the EEPS illustrate the aforementioned results clearer, that small particles (<10 nm) correlate with unburned fuel, and large particles (∼40 nm) correlate with soot precursors, as illustrated in . For example, the correlation between the appearance of particles of size 6 nm with the appearance of specific mass-to-charge ratio peaks is illustrated in , which shows that mass-to-charge ratios with the highest signal measured with our HELIOS/SICRIT/Mass Spectrometry system appear when small particles are present. shows the mass-to-charge ratios with a significant HELIOS/SICRIT/MS signal and high correlation coefficient with the concentration of 6 nm particles, and these include m/z 69: possibly pentadiene, pentyne or cyclopentene M + 1, m/z 73: likely unburnt butane M + 15, m/z 111: possibly octadiene M + 1, or octyne M + 1, m/z 129: likely unburnt octane M + 15 or heptane M + 29, and m/z 143: likely unburnt nonane M + 15 or octane M + 29. These species are present only at the start of the cycle. An analogs correlation for larger particles of 40 nm is shown in , showing that at times where the particle concentration of 40 nm particles is high, the mass-to-charge ratios that yield a high signal correspond to aromatics (soot precursors) such as m/z 80: benzene M + 2, m/z 101: hexane M + 15, pentane M + 29, or oxygenated HC, i.e., cyclohexanol M + 1, m/z 115: heptane M + 15, hexane M + 29, or oxygenated HC, i.e., cyclohexanemethanol M + 1, m/z 117: possibly isomer of alkynyl benzene (C9H8) M + 1, m/z 159: possibly isomer of alkenyl benzene (C12H14) M + 1, and m/z 214: isomer of hexyl-naphthalene M + 2. We found that ionization of aromatic molecules, such as benzene, ionize through the SICRIT to form ions at a mass-to-charge ratio of M + 2 (). Explicit determination of the substances that generate the aforementioned mass peaks can be determined if the experiment is repeated with a higher resolution mass spectrometer. The correlation coefficient between the particle concentration of a certain size and the HELIOS/SICRIT/Mass Spectrometry signal is shown in for 6 and 40 nm particles, respectively.
Figure 7. Analysis of exhaust (gas and particle phase, no denuder) from VW Up running on alkylate petrol during a WLTP cycle. (a) Correlation of the measurement of particle concentration for small particles (6 nm) and the signal at specific mass-to-charge ratios from the HELIOS/SICRIT/Mass spectrometry system at each time measurement point during the engine cycle run with alkylate petrol. Shown are the mass-to-charge ratios with the highest correlation coefficient and relative signal. (b) Analogs plot to (a) for large particles (40 nm). (c) 2D correlation coefficient between concentration of 6 nm particles and HELIOS/SICRIT/MS intensity for each m/z for m/z values with substantial signal intensity. (d) Analogs plot to (c) for concentration of 40 nm particles.
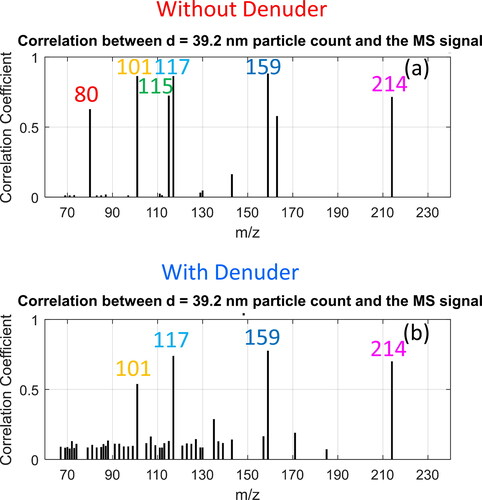
The effect of a denuder on the mass spectra measured with our HELIOS/SICRIT/Mass Spectrometry system is summarized in , which shows the correlation coefficients between the concentration of 40 nm particles and the HELIOS/SICRIT/Mass Spectrometry signal measured without and with a denuder (, respectively). The data collected with the denuder, which is filled with active carbon to remove gas-phase species, reveals that substances such as m/z 80 benzene M + 2 (Zhang et al. Citation2013) are present in the gas phase at the same time when larger particles (soot precursors) are present, as these are seen with high signal in the measurements without the denuder, but do not appear in the data collected with the denuder.
Figure 8. Analysis of exhaust from VW Up running on alkylate petrol during a WLTP cycle. 2D correlation coefficient between concentration of 40 nm particles and HELIOS/SICRIT/MS intensity for each m/z for m/z values with substantial signal intensity for sample stream (a) including gas-phase and aerosol particle-phase substances (without denuder), and (b) aerosol particle-phase substances only (with denuder).
Analysis of the exhaust from the engine cycle when run with normal petrol shows additional species are correlated with large particles during the cycle (). The exhaust from both alkylate petrol and petrol show mass peaks at m/z 101, m/z 117, m/z 159, m/z 214 when particles of 40 nm are present. The additional mass peaks that are seen in the exhaust during petrol operation when particles of 40 m are present are m/z 89, m/z 195, which correspond to additional aromatics/soot precursors formed from components of petrol (i.e., alkylbenzenes) that are not present in alkylate petrol.
Figure 9. Analysis of exhaust (gas and particle phase, no denuder) from VW Up running on petrol during a WLTP cycle. (a) Correlation of the measurement of particle concentration for 40 nm particles and the signal at specific mass-to-charge ratios from the HELIOS/SICRIT/Mass Spectrometry system at each time measurement point during the engine cycle run with petrol. Shown are the mass-to-charge ratios with the highest correlation coefficient and relative signal. (b) 2D correlation coefficient between concentration of 40 nm particles and HELIOS/SICRIT/MS intensity for each m/z for m/z values with substantial signal intensity.
5. Conclusion
We have shown that the new HELIOS/SICRIT/MS system can be of great use for the measurements of aerosol particles in both laboratory conditions and field measurements. The entire system was designed with relatively simple and inexpensive instrumentation, which were all put together in a highly robust and mobile system. The laboratory validation experiments demonstrate that the HELIOS/SICRIT/MS system is capable of relative quantification of organic coatings on solid aerosol particles. Good agreement in change of particle mass due to coating was found with the commercial SP-AMS system, and our HELIOS/SICRIT/MS system was able to identify the unfragmented mass of the coating species, while only mass fragments are seen in the SP-AMS system. The signal measured from our HELIOS/SICRIT/MS system was also shown to correspond well to the coating mass expected based on the coating thickness measured with a diffusion battery. Measurements of real-world engine exhaust with the HELIOS/SICRIT/Mass Spectrometry system show that different chemical species types can be correlated with different size aerosol particles in the exhaust gas. We demonstrate through these measurements that online chemical composition analysis is feasible with an appropriate aerosol characterization system, and this could potentially be implemented in future legislation on vehicle exhaust particle emission. Areas of future work include quantification of the dependence of the ionization efficiency to factors such as humidity, absolute calibration of the signal intensity measured by the HELIOS/SICRIT/MS system, and additional work to achieve better compound identification. This can be done by using the MS-MS mode of our instrument for single mass peaks and for the identification of molecular formulas by a mass spectrometer with higher resolution. Future work will also involve the analysis of sulfur compounds such as sulfuric acid, which can be measured using the negative mode of the mass spectrometer, because these species can be precursors for aerosol formation.
Supplemental Material
Download PDF (715.6 KB)Acknowledgments
We thank Sebastian Wiesemann and Roland Hoppe for their vital support in the mechanical construction of the HELIOS/SICRIT system. We also thank Lia Fucá and Chloé Chakchouk for initial measurements with the SICRIT system. The Plasmion GmbH staff is acknowledged for its skillful technical assistance. We appreciate the help of the whole group of Prof. Dr. G. Wachtmeister, Chair of Internal Combustion Engines at TU Munich. We thank the tofTools team for providing tools for mass spectrometry analysis.
Disclosure statement
No potential conflict of interest was reported by the authors.
Additional information
Funding
References
- Amanatidis, S., L. Ntziachristos, P. Karjalainen, E. Saukko, P. Simonen, N. Kuittinen, P. Aakko-Saksa, H. Timonen, T. Rönkkö, and J. Keskinen. 2018. Comparative performance of a thermal denuder and a catalytic stripper in sampling laboratory and marine exhaust aerosols. Aerosol. Sci. Technol. 52 (4):420–32. doi: https://doi.org/10.1080/02786826.2017.1422236.
- Bente, M., M. Sklorz, T. Streibel, and R. Zimmermann. 2009. Thermal desorption-multiphoton ionization time-of-flight mass spectrometry of individual aerosol particles: a simplified approach for online single-particle analysis of polycyclic aromatic hydrocarbons and their derivatives. Anal. Chem. 81 (7):2525–36. doi: https://doi.org/10.1021/ac802296f.
- Chan, M. N., T. Nah, and K. R. Wilson. 2013. Real time in situ chemical characterization of sub-micron organic aerosols using direct analysis in real time mass spectrometry (DART-MS): The effect of aerosol size and volatility. Analyst 138 (13):3749–57. doi: https://doi.org/10.1039/c3an00168g.
- Dzepina, K., J. Arey, L. C. Marr, D. R. Worsnop, D. Salcedo, Q. Zhang, T. B. Onasch, L. T. Molina, M. J. Molina, and J. L. Jimenez. 2007. Detection of particle-phase polycyclic aromatic hydrocarbons in Mexico City using an aerosol mass spectrometer. Int. J. Mass Spectrom. 263 (2–3):152–70. doi: https://doi.org/10.1016/j.ijms.2007.01.010.
- Eichler, P., M. Müller, B. D'Anna, and A. Wisthaler. 2015. A novel inlet system for online chemical analysis of semi-volatile submicron particulate matter. Atmos. Meas. Tech. 8 (3):1353–60. doi: https://doi.org/10.5194/amt-8-1353-2015.
- Elder, A., R. Gelein, J. Finkelstein, R. Phipps, M. Frampton, M. Utell, D. B. Kittelson, W. F. Watts, P. Hopke, C. H. Jeong, et al. 2004. On-road exposure to highway aerosols. 2. Exposures of aged, compromised rats. Inhal. Toxicol. 16 (Suppl 1):41–53. doi: https://doi.org/10.1080/08958370490443222.
- EU, 2007. REGULATION (EC) No 715/2007 OF THE EUROPEAN PARLIAMENT AND OF THE COUNCIL of 20 June 2007 on type approval of motor vehicles with respect to emissions from light passenger and commercial vehicles (Euro 5 and Euro 6) and on access to vehicle repair and maintenance information, in 715/2007, E. Union, ed. Official Journal of the European Union. https://eur-lex.europa.eu/legal-content/en/ALL/?uri=CELEX%3A32007R0715
- Helsper, C., W. Molter, F. Loffler, C. Wadenpohl, S. Kaufmann, and G. Wenninger. 1993. Investigations of a new aerosol generator for the production of carbon aggregate particles. Atmos. Environ. A: Gen. Top. 27 (8):1271–5. doi: https://doi.org/10.1016/0960-1686(93)90254-V.
- Holzinger, R., J. Williams, F. Herrmann, J. Lelieveld, N. M. Donahue, and T. Röckmann. 2010. Aerosol analysis using a thermal-desorption proton-transfer-reaction mass spectrometer (TD-PTR-MS): A new approach to study processing of organic aerosols. Atmos. Chem. Phys. 10 (5):2257–67. doi: https://doi.org/10.5194/acp-10-2257-2010.
- Huba, A. K., M. F. Mirabelli, and R. Zenobi. 2018. High-throughput screening of PAHs and polar trace contaminants in water matrices by direct solid-phase microextraction coupled to a dielectric barrier discharge ionization source. Anal. Chim. Acta 1030:125–32. doi: https://doi.org/10.1016/j.aca.2018.05.050.
- Kenseth, C. M., and G. A. Petrucci. 2016. Characterization of a bipolar near-infrared laser desorption/ionization aerosol mass spectrometer. Aerosol. Sci. Technol. 50 (8):790–801. doi: https://doi.org/10.1080/02786826.2016.1189074.
- Kittelson, D. B. 1998. Engines and nanoparticles: A review. J. Aerosol. Sci. 29 (5–6):575–88. doi: https://doi.org/10.1016/S0021-8502(97)10037-4.
- LaFranchi, B. W., and G. A. Petrucci. 2006. A comprehensive characterization of photoelectron resonance capture ionization aerosol mass spectrometry for the quantitative and qualitative analysis of organic particulate matter. Int. J. Mass Spectrom. 258 (1–3):120–33. doi: https://doi.org/10.1016/j.ijms.2006.06.013.
- Linstrom, P. J., and W. G. Mallard. 2018. NIST Chemistry WebBook, NIST Standard Reference Database National Institute of Standards and Technology. Gaithersburg, MD, 20899. https://doi.org/https://doi.org/10.18434/T4D303
- Lopez-Hilfiker, F. D., V. Pospisilova, W. Huang, M. Kalberer, C. Mohr, G. Stefenelli, J. A. Thornton, U. Baltensperger, A. S. H. Prevot, and J. G. Slowik. 2019. An extractive electrospray ionization time-of-flight mass spectrometer (EESI-TOF) for online measurement of atmospheric aerosol particles. Atmos. Meas. Tech. 12 (9):4867–86. doi: https://doi.org/10.5194/amt-12-4867-2019.
- Malmborg, V. B., A. C. Eriksson, M. Shen, P. Nilsson, Y. Gallo, B. Waldheim, J. Martinsson, Ö. Andersson, and J. Pagels. 2017. Evolution of in-cylinder diesel engine soot and emission characteristics investigated with online aerosol mass spectrometry. Environ. Sci. Technol. 51 (3):1876–85. doi: https://doi.org/10.1021/acs.est.6b03391.
- Mirabelli, M. F., J. C. Wolf, and R. Zenobi. 2017. Atmospheric pressure soft ionization for gas chromatography with dielectric barrier discharge ionization-mass spectrometry (GC-DBDI-MS). Analyst 142 (11):1909–15. doi: https://doi.org/10.1039/c7an00245a.
- Murphy, D. M., D. S. Thomson, and T. M. J. Mahoney. 1998. In situ measurements of organics, meteoritic material, mercury, and other elements in aerosols at 5 to 19 kilometers. Science 282 (5394):1664–9. doi: https://doi.org/10.1126/science.282.5394.1664.
- Niessner, R. 1986. The chemical response of the photoelectric aerosol sensor (Pas) to different aerosol systems. J. Aerosol. Sci. 17 (4):705–14. doi: https://doi.org/10.1016/0021-8502(86)90050-9.
- Niessner, R., B. Daeumer, and D. Klockow. 1990. Investigation of surface-properties of ultrafine particles by application of a multistep condensation nucleus counter. Aerosol. Sci. Tech. 12 (4):953–63. doi: https://doi.org/10.1080/02786829008959406.
- Niessner, R., and C. Helsper. 1985. Application of a multistep condensation nuclei counter as a detector for particle surface-composition. J. Aerosol. Sci. 16 (3):201–9. &. doi: https://doi.org/10.1016/0021-8502(85)90026-6.
- Öktem, B., M. P. Tolocka, and M. V. Johnston. 2004. On-line analysis of organic components in fine and ultrafine particles by photoionization aerosol mass spectrometry. Anal. Chem. 76 (2):253–61. doi: https://doi.org/10.1021/ac0350559.
- Onasch, T. B., A. Trimborn, E. C. Fortner, J. T. Jayne, G. L. Kok, L. R. Williams, P. Davidovits, and D. R. Worsnop. 2012. Soot particle aerosol mass spectrometer: Development, validation, and initial application. Aerosol. Sci. Technol. 46 (7):804–17. doi: https://doi.org/10.1080/02786826.2012.663948.
- Passig, J., J. Schade, M. Oster, M. Fuchs, S. Ehlert, C. Jager, M. Sklorz, and R. Zimmermann. 2017. Aerosol mass spectrometer for simultaneous detection of polyaromatic hydrocarbons and inorganic components from individual particles. Anal. Chem. 89 (12):6341–5. doi: https://doi.org/10.1021/acs.analchem.7b01207.
- Radischat, C., O. Sippula, B. Stengel, S. Klingbeil, M. Sklorz, R. Rabe, T. Streibel, H. Harndorf, and R. Zimmermann. 2015. Real-time analysis of organic compounds in ship engine aerosol emissions using resonance-enhanced multiphoton ionisation and proton transfer mass spectrometry. Anal. Bioanal. Chem. 407 (20):5939–51. doi: https://doi.org/10.1007/s00216-015-8465-0.
- Rhead, M. M., and S. A. Hardy. 2003. The sources of polycyclic aromatic compounds in diesel engine emissions. Fuel 82 (4):385–93. doi: https://doi.org/10.1016/S0016-2361(02)00314-9.
- Samaras, Z., L. Ntziachristos, and G. Parpori. 2019. Down to ten project. Lab of applied thermodynamics. Thessaloniki, Greece: Department of Mechanical Engineering, Aristotle University, University Campus. www.downtoten.com.
- Schneider, J., N. Hock, S. Weimer, S. Borrmann, U. Kirchner, R. Vogt, and V. Scheer. 2005. Nucleation particles in diesel exhaust: Composition inferred from in situ mass spectrometric analysis. Environ. Sci. Technol. 39 (16):6153–61. doi: https://doi.org/10.1021/es049427m.
- Schneider, J., U. Kirchner, S. Borrmann, R. Vogt, and V. Scheer. 2008. In situ measurements of particle number concentration, chemically resolved size distributions and black carbon content of traffic-related emissions on German motorways, rural roads and in city traffic. Atmos. Environ. 42 (18):4257–68. doi: https://doi.org/10.1016/j.atmosenv.2008.01.014.
- Streibel, T., J. Schnelle-Kreis, H. Czech, H. Harndorf, G. Jakobi, J. Jokiniemi, E. Karg, J. Lintelmann, G. Matuschek, B. Michalke, et al. 2017. Aerosol emissions of a ship diesel engine operated with diesel fuel or heavy fuel oil. Environ. Sci. Pollut. Res. Int. 24 (12):10976–91. doi: https://doi.org/10.1007/s11356-016-6724-z.
- Thornberry, T., D. M. Murphy, D. S. Thomson, J. de Gouw, C. Warneke, T. S. Bates, P. K. Quinn, and D. Coffman. 2009. Measurement of aerosol organic compounds using a novel collection/thermal-desorption PTR-ITMS instrument. Aerosol. Sci. Technol. 43 (5):486–501. doi: https://doi.org/10.1080/02786820902763132.
- Tobias, H. J., D. E. Beving, P. J. Ziemann, H. Sakurai, M. Zuk, P. H. McMurry, D. Zarling, R. Waytulonis, and D. B. Kittelson. 2001. Chemical analysis of diesel engine nanoparticles using a nano-DMA/thermal desorption particle beam mass spectrometer. Environ. Sci. Technol. 35 (11):2233–43. doi: https://doi.org/10.1021/es0016654.
- Wallace, W. E. 2018. Mass Spectra, in NIST Chemistry WebBook. NIST Standard Reference Database Number 69, P. J. Linstrom and W. G. Mallard, ed. Gaithersburg, MD: National Institute of Standards and Technology, 20899.
- Wolf, J. C., L. Gyr, M. F. Mirabelli, M. Schaer, P. Siegenthaler, and R. Zenobi. 2016. A radical-mediated pathway for the formation of [M + H](+) in dielectric barrier discharge ionization. J. Am. Soc. Mass. Spectrom. 27 (9):1468–75. doi: https://doi.org/10.1007/s13361-016-1420-2.
- Wolf, J. C., M. Schaer, P. Siegenthaler, and R. Zenobi. 2015. Direct quantification of chemical warfare agents and related compounds at low ppt levels: comparing active capillary dielectric barrier discharge plasma ionization and secondary electrospray ionization mass spectrometry. Anal. Chem. 87 (1):723–9. doi: https://doi.org/10.1021/ac5035874.
- Woods, E., G. D. Smith, Y. Dessiaterik, T. Baer, and R. E. Miller. 2001. Quantitative detection of aromatic compounds in single aerosol particle mass spectrometry. Anal. Chem. 73 (10):2317–22. doi: https://doi.org/10.1021/ac001166l.
- Xu, W., A. Lambe, P. Silva, W. W. Hu, T. Onasch, L. Williams, P. Croteau, X. Zhang, L. Renbaum-Wolff, E. Fortner, et al. 2018. Laboratory evaluation of species-dependent relative ionization efficiencies in the aerodyne aerosol mass spectrometer. Aerosol. Sci. Technol. 52 (6):626–41. doi: https://doi.org/10.1080/02786826.2018.1439570.
- Zhang, Z. P., X. Y. Gong, S. C. Zhang, H. J. Yang, Y. M. Shi, C. D. Yang, X. R. Zhang, X. C. Xiong, X. Fang, and Z. Ouyang. 2013. Observation of replacement of carbon in benzene with nitrogen in a low-temperature plasma. Sci. Rep. 3 3481. https://doi.org/https://doi.org/10.1038/srep03481.