
 ?Mathematical formulae have been encoded as MathML and are displayed in this HTML version using MathJax in order to improve their display. Uncheck the box to turn MathJax off. This feature requires Javascript. Click on a formula to zoom.
Abstract
The use of face masks is mandatory in public places in many countries to slow the spread of the COVID-19 pandemic. In developing countries, homemade masks with varying techniques and fabrics are used on the streets. On these fabric masks, the protection against SARS-CoV-2 varies significantly. The most common mask types are N95, surgical masks, and homemade nonwoven and cotton masks. The performance of 227 different face masks used in Brazil was evaluated to quantify their breathability and filtration efficiency (FE) for airborne particles. FE values were measured using NaCl aerosol particles sized from 60 to 300 nm and at 300 nm, minimum efficiency. The differential pressure drop over the mask and the FEmin at 300 nm was used to calculate the mask Quality Factor (QF). The N95 masks showed the highest FE60-300, around 0.98, and a QF of 13.2 KPa−1, and were considered the reference for evaluating homemade masks performance. Surgical masks have an FE60-300 of 0.89, with a good QF of 15.9 KPa−1. Nonwoven masks showed an average FE60-300 of 0.78, with an excellent QF of 24.9 KPa−1, and can be regarded as the best material for homemade masks. The most commonly used material for homemade masks, cotton fabrics, showed significant variability in FE60-300, ranging from a low 0.20–0.60, with a low QF of 1.4 KPa−1. Masks always reduce droplets and aerosols emitted by COVID-19 symptomatic and asymptomatic persons, reducing SARS-CoV-2 contamination.
Copyright © 2021 American Association for Aerosol Research
EDITOR:
1. Introduction
The COVID-19 pandemic caused by the SARS-CoV-2 coronavirus has a significant global impact on our society (WHO Citation2020b; Prather et al. Citation2020). Airborne transmission is considered one of the routes to the person-to-person (Zhang et al. Citation2020; Pozzer et al. Citation2020) spread of virus-related diseases such as COVID-19. Human emission of virus-bearing particles by a SARS-CoV-2 infected person could occur from coughing or sneezing and even from normal breathing and speaking (WHO Citation2020b; Stadnytskyi et al. Citation2020; Prather et al. Citation2020), and this makes COVID-19 a highly transmissible disease (Asadi et al. Citation2020; Sunjaya and Jenkins Citation2020).
Epidemiological and experimental evidence (Doremalen et al. Citation2020; Liu et al. Citation2020; WHO Citation2020c) suggests airborne transmission of SARS-CoV-2 via aerosols (size ≤ 5 µm) and virus-contaminated droplets (size > 5 µm) is relevant even by non-symptomatic individuals (Prather et al. Citation2020). The virus-containing droplets could also mix with aerosol particles. Aerosol particle sizes from 60 to 300 nm have a relatively long atmospheric lifetime (Doremalen et al. Citation2020; Chin et al. Citation2020) and could transport the SARS-CoV-2 over large distances (Setti et al. Citation2020; Morawska and Cao Citation2020). Recent works indicate that the incidence and severity of COVID-19 are attributable to the long-term exposure to ambient fine particulate matter (Pozzer et al. Citation2020).
Use of face masks simultaneously with social distancing (Leung et al. Citation2020; Chu et al. Citation2020; Stutt et al. Citation2020) became a universal recommendation to reduce risks of virus-containing particle emission and inhalation (Clase et al. Citation2020). Masks for professional medical use, such as N95 respirators and surgical masks are built accordingly to well-established certification schemes. Other types of commonly used masks are manufactured by multiple fabrics made from nonwoven melt-blown and spunbond, known as SMS, and some include an electrically charged layer (Konda et al. Citation2020; Sanchez et al. Citation2013).
In contrast, nonprofessional homemade masks, which are crucial to controlling contamination among the general population, do not follow any standards. They come in various designs and are made with a large variety of generic woven fabrics. Minimum performance requirements are usually not enforced, and available recommendations from standardization organizations such as AFNOR (AFNOR SPEC S76-001 Citation2020) in France, ABNT (ABNT PR 1002 Citation2020a) in Brazil. Public health authorities such as World Health Organization (WHO Citation2020a) and the Brazilian Health Agency (Anvisa Citation2020) do not regulate homemade cotton masks. The recommended typical fabric weight for woven fabrics is higher than for the nonwoven and professional mask, which has implications on comfort, a critical aspect of prolonged usage time (Den Boon and World Health Organization Citation2016). Non-medical masks have a recommended FE larger than 70% (range of particle sizes: 3 μm, 1 μm, or smaller), but only a few include guidelines for breathing resistance (measure as pressure drop). The testing and specification for non-medical masks are not as well defined as it is for professional masks.
Several studies have measured FE, breathing resistance, Quality Factor (QF) for a variety of masks (Konda et al. Citation2020; MacIntyre et al. Citation2015; Sande et al. Citation2008; Rengasamy et al. Citation2010; Zangmeister et al. Citation2020; Davies et al. Citation2013). These studies do not cover the almost unlimited available design possibilities. For example, none of those papers have tested nonwoven non-medical face mask that is being extensively used in Brazil. Therefore, this study covers a vast number of commonly used face masks.
In this study, we compared the performance of 227 face masks samples composed from a broad range of materials. All samples were obtained at the Brazilian market. We measured airborne particles' filtration efficiency and breathing resistance performance and conducted an essential material identification and microscopic characterization. Because of a scarcity of standardized mask testing equipment, we developed nonstandard techniques for measuring FE and breathing resistance. The data allows accessing various non-medical masks' comparative performance using the conventional N95 respirators and surgical masks as a benchmark. We derived the so-called Quality Factor (QF) that expresses filter performance using FE in 300 nm and breathing resistance.
This work results from a project to improve homemade masks with instructions on optimizing fabrics and construction techniques to get better protection. We made recommendations for manufacturers on how best to construct them, and our recommendations were used to produce many millions of masks from several Brazilian manufacturers. This certainly affected limiting COVID-19 spread in the Brazilian population. A website was created (http://inova.usp.br/respire/) to provide detailed instructions on how to build good face masks, and thousands of people and companies used these instructions to protect the population better.
2. Methods
2.1. Filtration efficiency (FE)
The particulate FE was assessed using the aerosol generator ATM 226 (TOPAS, Saxe, Germany), which generates NaCl aerosol particles in the fine mode size range with maximum distribution at 100–120 nm. The aerosol was dried to 40% relative humidity. Particles were sized using a Scanning Mobility Particle Sizer (SMPS) model 3080 (TSI, Minnesota, USA) that measured size distribution from 60 to 300 nm. The SMPS was coupled to a CPC (Condensation Particle Counter) 3771 (TSI, Minnesota, USA). The masks were attached to a sample holder with 47 mm internal diameter and exposed to the airflow of 1 L/min. The experimental setup can be observed in . The filter face velocity was 1.4 cm/s.
Figure 1. Schematic diagram of the aerosol filter efficiency measurement system. The system consists of a TSI Scanning Mobility Particle Sizer that measures the NaCl aerosol's size distribution with and without a sample mask.
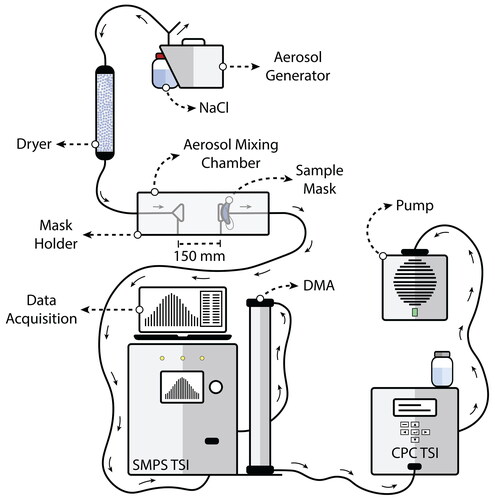
The aerosol size distribution was measured with and without the mask, and the ratio was used to calculate the mask filtration efficiency. This experimental setting can measure FE in the size range of 60–300 nm and makes it possible to analyze hundreds of face masks in a reasonable amount of time. Also, other labs can easily replicate the measurements since it uses standard instrumentation for aerosol particle generation and size analysis. We also tested the reproducibility of the measurements extensively, and they are always within 5%.
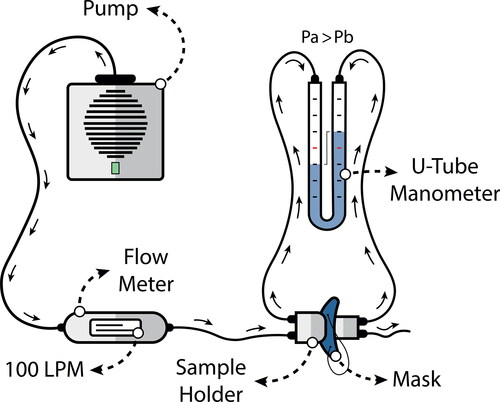
Figure 2. Schematic diagram of the mask breathing resistance. The system consists of a pump, flow meter, sample holder, and U-tube water manometer to measure the differential pressure ΔP.
The calculation of particle filtration efficiency (FE) was obtained considering the different size bins measured by SMPS between 60 and 300 nm. The procedure is similar to Konda et al. (Citation2020). All measurements were made in triplicates to ensure quality control and minimize the measurements' systematic variability (random noise). The regular procedure was three blanks, three mask tests, followed by three blanks. The average values, their respective standard deviations, and quartiles 25% and 75% were obtained for each set of measures. In particular, for the blanks, an average value was calculated with both average measurements before and after the mask. Therefore, the filtering efficiency in ith size is calculated by the following formula:
(1)
(1)
where <Ci,s> and <Ci,b> refer to the average concentration in the ith size bin between 60 and 300 nm for the sample and the blank, respectively. The total filtration efficiency for the interval of interest was obtained through the average total concentration of particles in that size range for both the mask and the blank sample as:
(2)
(2)
In addition to FE60-300, we also calculated the FE associated with the 300 nm particle size (FEmin) that is the minimum FE for the size range measured. This was done to facilitate comparison with the work of Zangmeister et al. (Citation2020).
2.2. Breathing resistance
The breathing resistance was calculated through the measurement of the differential pressure drop across the mask material. The mask was attached between two sample holders with a circular cross-section of 4.91 cm2 (25 mm diameter), and the air passed through the mask at a fixed airflow rate of 100 L/min. The differential pressure (ΔP) was expressed in mm H2O/cm2 ().
2.3. Quality factor (QF)
The quality of a mask can be indicated by the so-called quality factor (QF). QF is calculated according to EquationEquation (3)(3)
(3) (Zangmeister et al. Citation2020) and is related to the efficiency and the breathing resistance of the material. Higher values indicated higher FEmin and lower pressure drop (ΔP).
(3)
(3)
2.4. Fabric weight
The fabric weight is defined as the ratio between the mass in grams and the area in square meters. The measurement was made from square cuts of 40 mm on the side of the material, with an area of 1600 mm2, and weighed on a digital scale microbalance Mettler Toledo model XP6. For masks with more than one layer, the fabric weight was considered the sum of each fabric layer's fabric weight.
2.5. Digital microscopy
The microscopy analyses were made using a Hirox digital microscope, model KH770, and lens model MXG-2500REZ. The images were collected with 50× of magnification (Horizontal view = 6344.72 µm). Only the front was analyzed for masks made with only one fabric (one or multiple layers); with more than one fabric, front and back were analyzed. To measure the thickness of hybrid masks, the layers were positioned between two glass slides.
For the nonwoven masks, the percentage of the area of welding points was calculated by the open-source software ImageJ (MacIntyre et al. Citation2015). Welding points were manually selected, their area measured, and the area percentage calculated (total area of welding points/total area of the image).
2.6. Scanning electron microscopy
Scanning electron microscopy (SEM) was performed on surfaces and cross-sections of the nonwoven fabric masks (Sande et al. Citation2008). The surface samples were fixed in aluminum stubs with double-sided carbon tape. The cross-section samples were cut by steel surgical blade and were fixed straight between two aluminum plates with double-sided carbon tape. The samples were coated with ≈ 15 nm thick platinum film (Bal-tec MED 020 High Vacuum Coating System). Images were taken using backscattered electrons using an FEI Quanta FEG 650 in high vacuum mode at 10 kV, spot 3.0, and different working distances.
3. Results and discussions
3.1. Filtration efficiency (FE)
FE was calculated for the size range 60–300 nm, and for 300 nm, that is the minimum FE for the particle sizes measured. This was done to allow direct comparison of FEmin values measured in the work of Zangmeister et al. (Citation2020) and our work. The face velocity (FV) we used was 1.4 cm/s, associated with a flow rate of 1 L per minute and a fabric area of 12 cm2. Our face velocity is lower than other studies such as Zangmeister et al. (Citation2020) (FV = 6.3 cm/s) and Konda et al. (Citation2020) (FV = 26 cm/s). The work of O'Kelly et al. (Citation2020) mentions that popular mask filtration tests specify a face velocity range from 0.5 to 25 cm/s. Higher face velocity increases filtration by impaction but decreases filtration by diffusion and electrostatic interaction. Rengasamy et al. (Citation2010) show that the FE (20–1000 nm) does not change significantly from 5.5 to 16.5 cm/s. For the range of FV used in these works, FE is expected to not change significantly, except for O'Kelly et al. (Citation2020), which used an FV of 1530 cm/s because that work simulates coughing and not normal breathing.
shows a synthesis of all measurements with median values for FE, pressure drop (ΔP), and QF for each different group of masks. FE was calculated in two ways, in the range of 60–300 nm named FE60-300 and at 300 nm, which is the minimum of the FE as a particle size function. Also, show the fabric weight (g/m2) and the number of samples analyzed in each group of masks of a specific fabric type.
Table 1. Synthesis of all measurements median values for Filtration Efficiency (FE), pressure drop (ΔP), and QF (Quality Factor) for each different group of masks.
According to , the median FE60-300 and FEmin varied significantly along with the 227 analyzed masks (from 0.12 to 0.98). The N95 respirators showed the best results, as expected, with values of FE60-300 and FEmin between 0.98 and 0.97, respectively. In our study, the results for N95 masks are used as a reference for assessing the filtering quality of the other masks. The cotton, polyurethane, and polyester masks show the lowest FE. Surprisingly, the nonwoven masks showed consistent, excellent FE, with low ΔP, meaning a very high QF. Some masks show good FE but with very high breathing resistance (>8 mmH2O/cm2), such as neoprene, which makes them unsuitable for use. Surgical masks presented very good FE60-300 of 0.89, with low ΔP (2.24 mmH2O/cm).
Cotton fabrics are widely used for the production of non-medical masks. Measured FE presented a very low FE60-300 and FEmin of 0.40 and 0.32. Only 10% of our cotton mask samples did comply with the 0.70 FE recommended by WHO (Citation2020a). The number of fabric layers varied, and FE improved with the increase of layers. In our tests, about 80% of cotton masks used 2 or 3 fabric layers.
presents a comparison of the FE values for the 12 types of masks varying with particle size from 60 to 300 nm. presents a comparison of N95 respirator, surgical, cotton, and nonwoven masks. Except for N95 masks, the median FE between 60 and 300 nm decreases with increasing particle size. The increases in FE60-300 for smaller particles are due to the increased diffusion for smaller particles, while for larger particles, impaction can dominate.
Figure 3. Comparison of the median filtering efficiencies in the size interval 60–300 nm for (a) all different masks and fabrics, and (b) different groups of masks: N95 respirators, surgical masks, nonwoven, and cotton-made fabrics. The colors represent the quartiles at 25% and 75% of the median for a specific group.
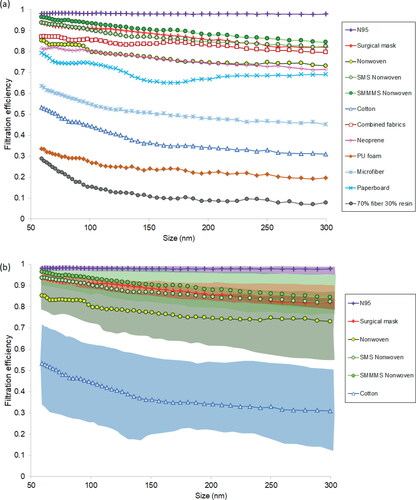
The existence of a dominant design combined with strict technical specifications and certification resulted in a very low variability on filtration performance of N95 respirators () and, to a lower degree, for surgical masks. However, cotton-made non-medical face masks FE presented a large dispersion for all particle sizes between 60 and 300 nm. The best performing mask reached filtration efficiency close to 0.7 only at smaller particles (60 nm). This suggests that cotton fabrics provide lower filtration protection than the WHO recommendation that is 0.7.
The results for FE60-300 obtained in this study are compatible with the ones reported by Rengasamy et al. (Citation2008, Citation2010) and O'Kelly et al. (Citation2020) for the same material. For N95 masks, FE varies between 0.95 and 1.0. For surgical masks, most of the results provided FE between 0.75 and 0.88. This relatively consistent FE holds even if these studies were done at different face velocities and different particle size ranges. One particular characteristic of our study is a large number of masks (227) studied. We also have done measurements on nonwoven masks that only a few studies have worked with. The cotton masks that are the most used mask in the streets. Substantial variability was observed for cotton, with FE60-300 varying from 0.2 to 0.6. This is due to the significant difference in thickness, mesh, and other fabric properties. Even the best cotton masks have FE60-300 below the recommended WHO values.
3.2. Pressure drop and breathing resistance
Pressure drop over the mask fabric is a proxy of the physical effort for breathing resistance. For masks with the same filtering area, the higher the pressure drop, the lower the breathability, and the less comfortable the user will wear. In our personal experience, low breathability will probably make the users remove the mask after a short time. More than that, as pressure drop increases, the contribution of air leaking (without filtration) through the gaps between the mask and the user's face to total air volume breathed tends to increase, progressively reducing the relevance of filtration performance (Grinshpun et al. Citation2009). Breathability recommendation for non-medical masks is ≈ 6 mmH2O/cm2 (WHO Citation2020a; AFNOR SPEC S76-001 Citation2020) and 5 mmH2O/cm2 in the Brazilian standard (ABNT PR 1002 Citation2020b).
Masks made with films such as neoprene rubber or polyester and paperboard have very little porosity and, therefore, breathability above the limit of 8.0 mmH2O/cm2, the maximum measurement of our scale. The same occurred with some weaved materials, such as microfiber and combined layers of different fabrics. From the mainstream masks, the N95 respirators are those that presented a high 5.5 mmH2O/cm2 pressure drop. This value is close to the WHO recommendation maximum of 6.0 mmH2O/cm2. However, the rigid structure of the respirators ensures a large filtering area, easing the respiration. Some surgical masks presented very high breathability. Plain nonwoven face masks performed the best breathability, 1.09 mmH2O/cm2, with is much better filtering efficiency than cotton-made masks. SMS and SMMMS had lower breathability than plain nonwoven with the same fabric weight, suggesting that the melt-blown filtration layer increases pressure drop. shows no correlation between FE60-300 and pressure drop, even when considering each mask type individually. Dividing the graph by the limits recommended by WHO for both requirements (ΔP of maximum 6 mmH2O/cm2 and FE60-300 minimum value of 0.7), it is possible to observe that not a single cotton face mask is located in the desirable quadrant with acceptable filtration efficiency and pressure drop (top right).
Figure 4. Pressure drop as a function of FE60-300 of all 12 groups of analyzed face masks. The line at a pressure drop of 6 mmH2O/cm2 indicates the WHO maximum recommended value. The line at 0.7 FE60-300 is the recommended WHO minimum FE60-300.
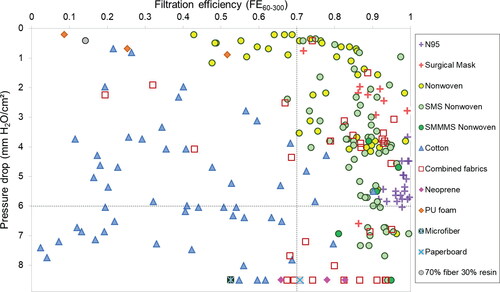
Moreover, 43% (23 out of 53) of those masks are in the less desirable quadrant (lower left quadrant), which combines insufficient filtration with low breathability, including four masks with pressure drop above 8 mmH2O/cm2. On the other side, about 78% (23 out of 104) of the nonprofessional nonwoven masks are located in the desirable upper right quadrant. This is one of the best combinations in terms of usage for the population.
The fitting of the masks to the person's face is also essential. The higher is the pressure drop through the filtering fabric, and the higher is the fraction of the air that could pass through the fitting gaps in the interface between the mask and face. Therefore, for those masks that lack metallic clips to seal the interface around the nose, a significant fraction of the air was probably breathed unfiltered through the fitting gaps. In that case, the fabric filtering efficiency becomes irrelevant, as is the case of many cotton masks, the neoprene, and the paperboard, which had no nose clip. Most of the professional masks made with nonwoven presented a clipping device, improving fitting.
3.3. Fabric weight and performance
There is no direct correlation between the fabric weight of the filtering layer and the filtration efficiency, as shown in . We should note, however, that fabric weight is relevant because it influences thermal comfort. In this sense, masks made with heavy layers tend to decrease thermal comfort, one of the parameters that make the user avoid wearing a mask (Den Boon and World Health Organization Citation2016).
The number of fabric layers is positively correlated with fabric weight for cotton and nonwoven masks, despite having a large dispersion. Adding a second layer did increase filtration efficiency significantly for the cotton masks, but a third layer did not change significantly. Even though the Brazilian Health Regulatory Agency (Anvisa Citation2020) recommends three layers for nonmedical masks, only 18% of cotton and 19% of nonwoven samples did comply with that regulation. Those that complied were no better.
3.4. Microstructure
We have done extensive optical digital microscopy analysis to provide better visualization of the different mask's fabrics. shows typical optical digital microscopy images of the various samples, including nonwoven and woven fabrics. shows typical surfaces of nonwoven fabrics, with their distinctive patterns of soldering points being visible. However, the space between points reveals subtle differences. The SMS images (c, d) show a more or less homogenous network with some tiny pores, while the image of a conventional nonwoven (e) shows larger pores through which the dark cardboard underneath is visible. The two first combine better filtration efficiency than the former with good breathability and are the typical products from the desirable quadrant (upper right) (). On the other side, image (d) shows another conventional nonwoven with no visible pores, whose filtration efficiency is high, but breathability is very low.
Figure 5. Digital microscopy images showing different fabrics. (a) N95 respirators; (b) surgical mask; (c, d) SMS non-woven; (e) non-woven; (f) cotton with frontal seam; (g) cotton with open weft; (h) cotton with closed weft; (i) cotton with heterogeneous size and voids pattern.
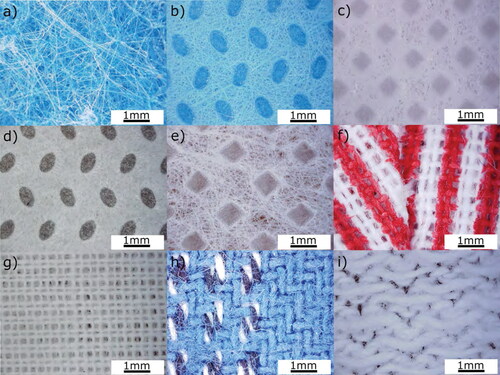
Part of the analyzed masks was classified in the low filtration efficiency/good breathability region (upper left quadrant in ). This region is the most heterogeneous, and it is dominated by woven with a few nonwoven fabrics. illustrate the surface microstructure of masks made with various cotton fabrics, which have low filtration efficiency and good breathability. Mask (f) presents large visible pores and a frontal seam. In many tested samples, the seam located in the mask's front central part was weak. It may result in a gap between the connected fabrics and sewing points, eventually resulting in a visible hole in the fabric, therefore creating a preferential channel for the airflow, decreasing efficiency.
presents a cotton fabric mask made with a homogeneously densely packed waved thick thread. The FE60-300 value is higher than those masks from and , but still below the (WHO Citation2020a) recommended values and with low breathability. The mask from uses a yarn diameter and fabric weight similar to the one in 5 h. The weaving pattern leaves several large pores in the structure otherwise packed. The resulting mask combines low filtration efficiency and low breathability performance in a high fabric weight product.
Another alternative to increase filtration was producing combinations of fabric types, a concept recommended by (Konda et al. Citation2020; WHO Citation2020a). However, in , the hybrid combination presented a significant variation in both FE60-300 and breathability and can be ranked in all regions, even in the unbreathable part. presents some examples of these masks. and are from a combination of polyurethane foam and polyamide fabric. The fabric presented large pores, and the voids of the foam were interconnected. The resulting mask had low FE60-300 and good breathability. However, polyurethane foam has high thermal insulation (Gama et al. Citation2018). The resulting 4-mm thick mask will cause thermal discomfort for the user in the hot Brazilian climate, eventually reducing the time of use.
Figure 6. Digital microscopy images of hybrid masks and their respective cross-sections: polyurethane and polyamide (a, d), woven and nonwoven (b, e), nonwoven, and SMS nonwoven (c, f). In cross-section images, fabrics are between glass slides.
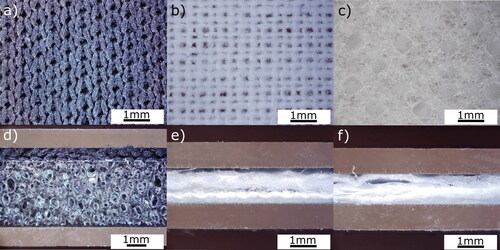
A mask made with a combination of woven cotton and the nonwoven fabric is presented in and . This solution resulted in a thin layer (≈ 1.3 mm) with an FE60-300 value of 0.73, mainly due to the nonwoven fabric. At the same time, breathability is reduced owing to the use of a woven layer. Finally, another hybrid combination of one layer of plain nonwoven and two layers of SMS low-weight nonwoven ranked among the best ( and ), resulting in less than ≈ 1 mm thick layer.
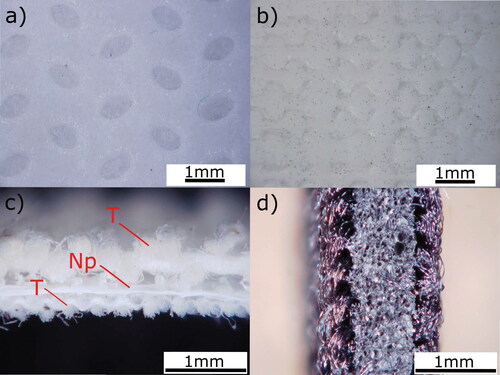
presents some examples of these masks. and shows a nonwoven fabric and a paperboard, respectively, which have a sealed surface without visible pores, and consequently, FE60-300 is high. is a mask of two waved layers of Twill (T), with a nonpermeable film (Np) in the middle. is the neoprene foam covered on both sides by waved polyester, a typical solution for wet suits for underwater sports with good insulation.
Figure 7. Digital microscopy images of unbreathable masks: (a) nonpermeable nonwoven, (b) paperboard, (c) fabric with a mid-non-permeable layer, and (d) neoprene with dense foams.
According to , nonwoven fabrics were the ones that presented the best performance in filtration among the nonprofessional masks following (Kutter et al., Citation2018; Davies et al., Citation2013). The microstructure of nonwoven fabrics and their layers and fibers cannot be adequately distinguished by digital optical microscopy; thus, scanning electron microscopy is required to characterize this fabric type.
illustrates the surfaces of the nonwoven fabrics. Each row presents a nonwoven fabric, and each column shows images with the same magnification and, therefore, the same Horizontal Field Width (HFW). Images in the left column present the shape and distribution of spunbond layer welding points and the fibers' arrangement; they randomly form a disorganized structure that contributes to high efficiency on filtration of nanoparticles, as mentioned previously (). In the mid and right columns, images show spunbond layer fibers and their surface details; sometimes, it is possible to see melt-blown layer fibers below the spunbond layer (right column, rows b, c, and e).
Figure 8. Backscattered electron images of non-woven fabrics: (a) non-woven, (b–d) SMS non-woven and (e) surgical mask. Horizontal field width (HFW) of the images: 3.95 mm in the left column, 920 µm middle column, 276 µm right column.
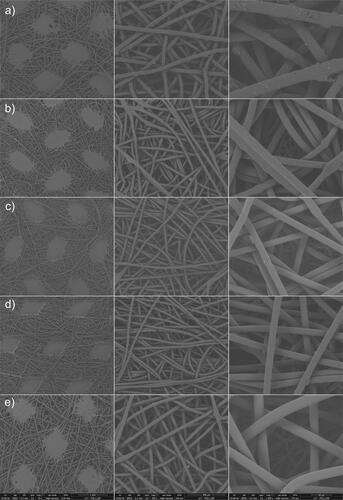
is a standard nonwoven fabric. The welding points are misshapen, some with faults, and with irregular distribution patterns. With a mean diameter of 26 µm, the fibers have a rough surface due to mineral filler presence as a component. SMS nonwoven with different fabric weights from different manufacturers. The welding points of this group of masks are well shaped with a regular distribution pattern. The fibers have a smooth texture and a mean diameter of 16–17 µm. is a surgical mask, like an SMS nonwoven. The welding points are not so well shaped, but they are regularly distributed, and fibers also have a smooth texture with a mean diameter of 23 µm. It is important to note that 10–30% of the surface areas of nonwoven fabrics are covered by diamond or ellipse-shaped welding points that give a peculiar graphical signature to each material. These points are made of melted spun-bond fibers and have negligible air permeability and 100% filtration efficiency. However, there is no correlation between the area fraction covered by welding points and FE or breathability.
The thickness of the nonwoven fabrics analyzed by SEM is directly linked to breathability. SMS nonwoven with ≈ 600 µm thickness () and surgical mask with ≈ 850 µm thickness () have low breathability: ≈ 7 mmH2O/cm2 and ≈ 6.5 mmH2O/cm2, respectively. SMS nonwoven with ≈ 300 µm thickness ( and ) has high breathability.
4. Conclusions
As recommended by health authorities, facial masks are an effective measure for preventing the airborne transmission of SARS-CoV-2 (WHO Citation2020b). In this study, the performance of different types and materials for facial masks was evaluated, quantifying the efficiency of filtrating airborne particles as a function of aerosol particle size and the face mask's breathability. It is important to note that different face velocities can affect the FE. Also, particle charge (when they are electrically charged) affects the FE and interaction with mask material. Our study used a face velocity of 1.4 cm/s, and the test aerosol was not neutralized. Our results show that the N95 respirator has the highest FE60-300 of 0.98 and a pressure drop of 5.5 mmH2O/cm2. The surgical masks FE60-300 varied from 0.86 to 0.92 with very high variability in the breathability performance (0.1–7 mmH2O/cm2). This is due to the nonstandard character of surgical masks that do not have the same standardization as N95 masks.
Among the nonprofessional masks, the best overall performance is from the nonwoven materials, possibly due to fibers' random orientation. The nonwoven SMS, which has a layer of melt-blown microfibers, had the best overall performance. They combine FE60-300 0.83–0.91 with good breathability in general, below 4 mmH2O/cm2. The SMMMS nonwoven fabrics is a more homogeneous product than the SMS, with a slightly better FE60-300 of 0.91 but lower breathability performance, with a pressure drop of 5.1 mmH2O/cm2, which is probably associated with a denser melt-blown fiber layer. Nonwoven masks' good performance is achieved in a lightweight, comfortable fabric that offers excellent protection for the population. We provide a file called FE comparison in the online supplementary information (SI) containing a plot showing the comparison of FE for different works previously published compared to the present work.
The cotton fabric masks, which are the most used ones in developing countries, have a very low FE60-300 around 0.40, much lower than the minimum FE of 0.70 recommended by WHO. The FE performance did improve slightly when a second layer was added but was not by a third layer, despite the increase of fabric weight. It was observed that fabric weight for cotton masks had no correlation with FE or breathability and was high: 305 g/m2, well above the maximum of nonwoven (120 g/m2) and N95 respirators (177 g/m2), which generate concerns about thermal comfort in hot climates. Some masks using polyester, neoprene, paperboard, microfiber, and cotton fabrics showed to be unbreathable and, for this reason, should be avoided. Since, in principle, most masks provide adequate protection against larger (>10 μm) droplets, even masks with low FE for small particles can offer a significant degree of protection. The face mask fitting was not part of this study but is also very important. It is necessary to avoid air entering the nose and mouth that the mask material was not filtered. We recommend the use of a nasal clip for nonprofessional masks, reducing the gaps around the nose.
The quality factor that refers to the ratio between FEmin and ΔP is an excellent indicator of the different masks' quality, making a balance between FE and breathing resistance. We provide in the SI a spreadsheet called Quality Factor that shows how we calculate the QF. The WHO recommendation to use QF > 3 has shown to be a good indicator. This study shows that the nonwoven SMS is the best material to make non-medical masks, combining good FE and low breathing resistance. It also has low weight, providing comfort in use in tropical counties.
The focus on face masks used in Brazil and similar developing countries has shown that depending on the mask design and fabric used. Masks could have a low filtration efficiency, not correctly protecting the person who uses them or the people nearby. The ideal situation would be to mass-produce N95 masks and distribute the masks to the population to prevent virus dissemination. Indeed, in future pandemics, this would be very useful from the very beginning of the cases.
As we have not used in this study standard FE methods, it is essential to emphasize that we did not focus on the “absolute” values of the measurements but instead compare fabrics and mask types. It is also important to mention that face masks with high FE also offer some protection for air pollution or smoke particles since these particles could have sizes smaller than 100 nm, where the face masks also provide some protection for a range of face velocities.
| Nomenclature | ||
| FE | = | filtration efficiency |
| QF | = | quality factor |
| WHO | = | World Health Organization |
| N95 | = | N95 classification of air filtration, meaning that it filters at least 95% of airborne particles |
| COVID-19 | = | Coronavirus Disease 2019 |
| SARS-COV-2 | = | severe acute respiratory syndrome coronavirus 2 |
| AFNOR | = | French Association for Normalization |
| ABNT | = | Brazilian Association of Normalization |
| ANVISA | = | Brazilian Health Regulatory Agency |
| FV | = | face velocity |
| SMS | = | tri-laminated nonwoven fabric |
| SMMMS | = | 5-laminated nonwoven fabric |
| PU | = | polyurethane |
| NBR | = | Brazilian Standard |
| T | = | twill |
| Np | = | non-permeable film |
| HFW | = | Horizontal Field Width |
| SEM | = | Scanning Electron Microscopy |
| InovaUSP | = | University of São Paulo Innovation Center |
| USP | = | University de São Paulo |
| SMPS | = | Scanning Mobility Particle Sizer |
| CPC | = | Condensation Particle Counter |
Supplemental Material
Download Zip (66.3 KB)Acknowledgments
Authors thank the Laboratório de Caracterização Tecnológica (www.lct.poli.usp.br) of University of São Paulo Polytechnic School where SEM analyses were performed. This research is a result of the Respire! (Breath!) project is part of the USP Vida, an initiative of the University of Sao Paulo, to help society overcome the COVID-19 pandemic. We thank Delano Campos and Maria Alice Gonzales Monticelli for helping with figures and Dr. Maria de Fatima Andrade for support with instrumentation.
Additional information
Funding
Related Research Data
References
- ABNT PR 1002. 2020a. Máscaras de Proteção Respiratória de Uso Não Profissional. Guia de Requisitos Básicos Para Métodos de Ensaio, Fabricação e Uso. Rio de Janeiro, Brasil: Associação Brasileira de Normas Técnicas.
- ABNT PR 1002. 2020b. Máscaras de Proteção Respiratória de Uso Não Profissional. Guia de Requisitos Básicos Para Métodos de Ensaio, Fabricação e Uso. Rio de Janeiro, Brasil: Associação Brasileira de Normas Técnicas.
- AFNOR SPEC S76-001. 2020. Barrier masks—guide to minimum requirements, methods of testing, making and use. Association Française de Normalisation.
- Anvisa. 2020. Orientações Gerais – Máscaras Faciais de Uso Não Profissional. Brasília, Brazil: Brazilian Health Regulatory Agency. www.anvisa.gov.br.
- Asadi, S., N. Bouvier, A. S. Wexler, and W. D. Ristenpart. 2020. The coronavirus pandemic and aerosols: Does COVID-19 transmit via expiratory particles? Aerosol Sci. Technol. 54 (6):635–8. doi: 10.1080/02786826.2020.1749229.
- Chin, A. W. H., J. T. S. Chu, M. R. A. Perera, K. P. Y. Hui, H.-L. Yen, M. C. W. Chan, M. Peiris, and L. L. M. Poon. 2020. Stability of SARS-CoV-2 in different environmental conditions. Lancet Microbe 1 (1):e10. doi: 10.1016/S2666-5247(20)30003-3.
- Chu, D. K., E. A. Akl, S. Duda, K. Solo, S. Yaacoub, H. J. Schünemann, D. K. Chu, et al. 2020. Physical distancing, face masks, and eye protection to prevent person-to-person transmission of SARS-CoV-2 and COVID-19: a systematic review and meta-analysis. Lancet. doi: 10.1016/S0140-6736(20)31142-9.
- Clase, C. M., E. L. Fu, M. Joseph, R. C. L. Beale, M. B. Dolovich, M. Jardine, J. F. E. Mann, R. Pecoits-Filho, W. C. Winkelmayer, and J. J. Carrero. 2020. Cloth masks may prevent transmission of COVID-19: an evidence-based, risk-based approach. Ann. Int. Med. doi: 10.7326/M20-2567.
- Davies, A., K.-A. Thompson, K. Giri, G. Kafatos, J. Walker, and A. Bennett. 2013. Testing the efficacy of homemade masks: Would they protect in an influenza pandemic? Disaster Medicine and Public Health Preparedness 7 (4):413–8. doi: 10.1017/dmp.2013.43.
- Den Boon, S., World Health Organization. 2016. Personal protective equipment for use in a filovirus disease outbreak: Rapid advice guideline. Geneva: World Health Organization.
- Doremalen, N. v., T. Bushmaker, D. H. Morris, M. G. Holbrook, A. Gamble, B. N. Williamson, A. Tamin, et al. 2020. Aerosol and surface stability of SARS-CoV-2 as compared with SARS-CoV-1. New Eng. J. Med. 382 (16):1564–7. doi: 10.1056/NEJMc2004973.
- Gama, N., A. Ferreira, and A. Barros-Timmons. 2018. Polyurethane foams: Past, present, and future. Materials 11 (10):1841. doi: 10.3390/ma11101841.
- Grinshpun, S. A., H. Haruta, R. M. Eninger, T. Reponen, R. T. McKay, and S.-A. Lee. 2009. Performance of an N95 filtering facepiece particulate respirator and a surgical mask during human breathing: Two pathways for particle penetration. J. Occup. Env. Hygiene 6 (10):593–603. doi: 10.1080/15459620903120086.
- Konda, A., A. Prakash, G. A. Moss, M. Schmoldt, G. D. Grant, and S. Guha. 2020. Aerosol filtration efficiency of common fabrics used in respiratory cloth masks. ACS Na 14 (5):6339–47. doi: 10.1021/acsnano.0c03252.
- Kutter, J. S., M. I. Spronken, P. L. Fraaij, R. A. Fouchier, and S. Herfst. 2018. Transmission routes of respiratory viruses among humans. Curr. Opin. Virol. 28 (February):142–51. doi: 10.1016/j.coviro.2018.01.001.
- Leung, N. H. L., D. K. W. Chu, E. Y. C. Shiu, K.-H. Chan, J. J. McDevitt, B. J. P. Hau, H.-L. Yen, et al. 2020. Respiratory virus shedding in exhaled breath and efficacy of face masks. Dryad doi: 10.5061/DRYAD.W9GHX3FKT.
- Liu, Y., Z. Ning, Y. Chen, M. Guo, Y. Liu, N. K. Gali, L. Sun, et al. 2020. Aerodynamic analysis of SARS-CoV-2 in two Wuhan hospitals. Nature 582 (7813):557–60. doi: 10.1038/s41586-020-2271-3.
- MacIntyre, C. R., H. Seale, T. C. Dung, N. T. Hien, P. T. Nga, A. A. Chughtai, B. Rahman, D. E. Dwyer, and Q. Wang. 2015. A cluster randomised trial of cloth masks compared with medical masks in healthcare workers. BMJ Open 5 (4):e006577–e006577. doi: 10.1136/bmjopen-2014-006577.
- Morawska, L., and J. Cao. 2020. Airborne transmission of SARS-CoV-2: The world should face the reality. Environ. Int. 139 (June):105730. doi: 10.1016/j.envint.2020.105730.
- O'Kelly, E., S. Pirog, J. Ward, et al. 2020. Ability of fabric face mask materials to filter ultrafine particles at coughing velocity. BMJ Open 10:e039424. doi: 10.1136/bmjopen-2020-039424.
- Pozzer, A., F. Dominici, A. Haines, C. Witt, T. Münzel, and J. Lelieveld. 2020. Regional and global contributions of air pollution to risk of death from COVID-19. Cardiovasc. Res. cvaa288 (October). doi: 10.1093/cvr/cvaa288.
- Prather, K. A., C. C. Wang, and R. T. Schooley. 2020. Reducing transmission of SARS-CoV-2. Science 368 (6498):1422–4. doi: 10.1126/science.abc6197.
- Rengasamy, S., B. Eimer, and R. E. Shaffer. 2008. Nanoparticle filtration performance of commercially available dust masks. J. Int. Soc. Respir. Prot. 25:27–41.
- Rengasamy, S., B. Eimer, and R. Shaffer. 2010. Simple respiratory protection—Evaluation of the filtration performance of cloth masks and common fabric materials against 20–1000 nm size particles. Ann. Occup. Hygiene. doi: 10.1093/annhyg/meq044.
- Sanchez, A. L., J. A. Hubbard, J. G. Dellinger, and B. L. Servantes. 2013. Experimental study of electrostatic aerosol filtration at moderate filter face velocity. Aerosol Sci. Technol. 47 (6):606–15. doi: 10.1080/02786826.2013.778384.
- Sande, M. v d., P. Teunis, and R. Sabel. 2008. Professional and homemade face masks reduce exposure to respiratory infections among the general population. Edited by Madhukar Pai. PLoS One 3 (7):e2618. doi: 10.1371/journal.pone.0002618.
- Setti, L., F. Passarini, G. De Gennaro, P. Barbieri, M. G. Perrone, M. Borelli, J. Palmisani, A. Di Gilio, P. Piscitelli, and A. Miani. 2020. Airborne transmission route of COVID-19: Why 2 meters/6 feet of inter-personal distance could not be enough. Int. J. Environ. Res. Public Health 17 (8):2932. doi: 10.3390/ijerph17082932.
- Stadnytskyi, V., C. E. Bax, A. Bax, and, and P. Anfinrud. 2020. The airborne lifetime of small speech droplets and their potential importance in SARS-CoV-2 transmission. Proc. Natl. Acad. Sci. 117 (22):11875–7. doi: 10.1073/pnas.2006874117.
- Stutt, R. O. J. H., R. Retkute, M. Bradley, C. A. Gilligan, and J. Colvin. 2020. A modelling framework to assess the likely effectiveness of facemasks in combination with 'lock-down' in managing the COVID-19 pandemic. Proc. R. Soc. A Math. Phys. Eng. Sci. 476 (2238): 20200376. doi: 10.1098/rspa.2020.0376.
- Sunjaya, A. P., and C. Jenkins. 2020. Rationale for universal face masks in public against COVID‐19. Respirology 25 (7):678–9. doi: 10.1111/resp.13834.
- WHO. 2020a. Advice on the use of masks in the context of COVID-19. World Health Organization.
- WHO. 2020b. Modes of transmission of virus causing COVID-19: Implications for IPC precaution recommendations. World Health Organization.
- WHO. 2020c. The first few X cases and contacts (FFX) investigation protocol for coronavirus disease 2019 (COVID-19). World Health Organization.
- Zangmeister, C. D., J. G. Radney, E. P. Vicenzi, and J. L. Weaver. 2020. Filtration efficiencies of nanoscale aerosol by cloth mask materials used to slow the spread of SARS-CoV-2. ACS Na 14 (7):9188–200. doi: 10.1021/acsnano.0c05025.
- Zhang, R., Y. Li, A. L. Zhang, Y. Wang, and M. J. Molina. 2020. Identifying airborne transmission as the dominant route for the spread of COVID-19. Proc. Natl. Acad. Sci. 202009637. doi: 10.1073/pnas.2009637117.