
 ?Mathematical formulae have been encoded as MathML and are displayed in this HTML version using MathJax in order to improve their display. Uncheck the box to turn MathJax off. This feature requires Javascript. Click on a formula to zoom.
Abstract
A method for the quantification of airborne organic carbon (OC) and elemental carbon (EC) within aerosolized diesel particulate matter (DPM) is described in this article. DPM is a known carcinogen encountered in many industrial workplaces (notably mining) and in the ambient atmosphere. The method described here collects DPM particles onto a quartz fiber filter, after which reflection-mode infrared spectra are measured on a mid-infrared Fourier transform (FT-IR) spectrometer. Several infrared absorption bands are investigated for their efficacy in quantifying OC and EC. The thermo-optical (T-O) method is used to calibrate a linear regression model to predict OC and EC from the infrared spectra. The calibrated model, generated from laboratory DPM samples, is then utilized to quantify OC and EC in mine samples obtained from two metal mine locations under a variety of operating conditions. The feasibility of further improving these results by partial least squares (PLS) regression was investigated. A single calibration that is broadly applicable would be considered an improvement over currently available portable instruments, which require aerosol-specific calibration.
EDITOR:
Introduction
Diesel particulate matter (DPM) consists of sub-micron (< 800 nm) particles that are generally believed to be composed of irregularly arranged graphitic-like “spherule” structures. These spheroidal nanoparticles are approximately 10–30 nm in diameter and have a carbonaceous core operationally defined as elemental carbon (EC), onto which a wide variety of semi-volatile organic carbon (OC) compounds and metal ash are adsorbed (Kittelson, Arnold, and Watts Citation1999; Ristovski et al. Citation2012; van Setten, Makkee, and Moulijn Citation2001). Several of these nanoparticles usually agglomerate to form larger particles, of which the aerodynamic diameter is still less than 1 μm (Cantrell and Volkwein Citation2001). While suspended in the air, DPM can readily be inhaled, and the small diameter allows the nanoparticles to readily reach the alveolar and tracheo-bronchial regions (Kittelson, Watts, and Johnson Citation2004). The mechanisms by which DPM induce adverse health are beyond the scope of this article; however, the International Agency for Research on Cancer (IARC) categorizes this material as carcinogenic to humans (Benbrahim-Tallaa et al. Citation2012). There is evidence suggesting that both the OC and EC fractions contain the physiologically active compounds that have the potential to cause adverse health effects (Ristovski et al. Citation2012).
A study of workers’ exposure in industries where diesel engines are used extensively revealed that underground miners were the most heavily exposed, with EC levels being between 27–658 μg/m3 (Pronk, Coble, and Stewart Citation2009). As a result of the health implications posed to mine workers, DPM levels are monitored by the Mine Safety and Health Administration (MSHA) by passing the mine atmosphere through quartz fiber filters over the duration of a typical shift (∼8 h). Samples are then shipped to a certified laboratory for analysis by which total carbon (TC = OC + EC) is quantified. A thermo-optical (T-O) technique defined in the NIOSH Manual of Analytical Methods (NMAM) as NIOSH method 5040 is used to determine carbon mass on each filter (Birch Citation2002). Knowing the sample collection time, the miner’s time-weighted average DPM exposure is then determined. The MSHA regulation for DPM exposure specifies a permissible exposure limit (PEL) for TC of no more than a 160 µg/m3 time-weighted average over the course of an 8-hour shift. Typical turnaround times from sample acquisition to sample analysis are on the order of one week. A more rapid and portable method would greatly improve the ability to correct high exposures; the development of such a method is the aim of this work.
There are currently several real-time devices that are able to estimate DPM aerosol concentration to varying degrees of accuracy. Many of these devices utilize light absorption or scattering in the UV to near-infrared range to achieve a surrogate measurement that approximates the DPM mass. The scattering or absorption is measured often using several discrete wavelength channels. This approach makes chemical speciation difficult due to the lack of a complete spectrum. As a result, the available devices require aerosol-specific calibrations (Khan et al. Citation2021; Miller, Habjan, and Park Citation2007; Northrop, Zarling, and Li Citation2017; Robinson et al. Citation2014; Watts et al. Citation2010).
This work demonstrates the use of reflection-mode Fourier transform infrared (FT-IR) spectrometry to achieve a more accurate method for quantifying EC and OC that is not aerosol dependent. The approach involves depositing the DPM aerosol onto quartz fiber filters after being size selected by way of a 0.8-μm impactor. These are the same filters and impactors utilized in the 5040 T-O method. The DPM-laden filter is then analyzed by way of reflection-mode FT-IR spectroscopy and immediately followed by T-O analysis.
Several studies have calibrated the transmission-mode FT-IR spectra of particulate matter, collected on polytetrafluoroethylene (PTFE) filters, to OC and EC measured from quartz filters by T-O analysis (Dillner and Takahama Citation2015a, Citation2015b; Weakley, Takahama, and Dillner Citation2016; Weakley, Takahama, Wexler, et al. Citation2018). Two filter types were likely used for calibration since (1) the quartz fiber filters almost completely attenuate infrared radiation when measured in transmission mode and (2) PTFE filters cannot be subjected to T-O analysis given a melting point of less than 350 °C. Furthermore, the first overtone of the C-F stretching mode absorbs at a similar wavelength to the aliphatic C-H stretching bands (3000–2800 cm−1) which proves to be critical for the mid-infrared measurements (Liang and Krimm Citation1956; Moynihan Citation1959). This study aims to further demonstrate that reflection-mode FT-IR spectroscopy may be used to measure a spectrum directly from quartz fiber filters.
Preliminary work using reflection-mode FT-IR spectroscopy has demonstrated that the area of C-H stretching bands correlate with OC content of DPM (Parks et al. Citation2019). That same work demonstrated that the magnitude of the tail of the π→π* transition of aromatic ring structures found in graphitic carbon correlate with EC, as indicated in Niyogi et al. (Citation2006). The work described in this article builds on those findings by looking more closely at how well the technique estimates OC and EC in DPM collected from working mines. Here, calibrations are developed from laboratory samples. The quality of several models—including univariate and multivariate (partial least squares, PLS)—is compared and validated using figures of merit such as the coefficient of determination and root-mean squared (RMS) error. Following validation, calibrations are extended to samples collected from two operating metal mines at numerous locations within the mine and under various operating conditions. This provides an assessment of the strengths and limitations of the proposed approach for the field quantification of DPM.
Materials and methods
A univariate linear regression model was developed in this study based on laboratory-generated samples and used to quantify EC and OC on samples obtained within two operating mines by the T-O method. The DPM sampling was done by way of drawing the atmosphere, either within an active mine or from a laboratory quiescence chamber, at a rate of 1.7 liter/min, through quartz fiber filters. The effective deposition area of the quartz fiber filters used in this work was taken to be 8.0 cm2 (Noll et al. Citation2005). Thus, the DPM concentration in the sampled atmosphere can be found by way of scaling the filter loading (μg/cm2) by the filter effective area (cm2) and dividing by the flow volume passed through the filter (L) to arrive at a time-weighted average DPM concentration (μg/L or 103 μg/m3). For an 8-hour shift, a filter with x μg/cm2 would have been exposed to a time-weighted average of roughly 10x μg/m3 of DPM in the air.
Mine samples
The mine samples analyzed in this study were taken from two different operating underground metal mines. The OC and EC loading of the filters as measured by the T-O method is summarized in . Note that the OC/EC ratios reported are for non-field-blank samples. In this work, field blank samples are simply unused quartz fiber filters taken directly out of the sealed cassette. The field blanks typically have 0.4 to 0.6 μg/cm2 of OC provided the cassettes are within the expiration date. As the cassettes age, more OC is found on the field blanks, yet EC remains negligible, thus OC/EC ratios for field blank samples are essentially meaningless and do not contain useful information on the nature of the DPM aerosol.
Table 1. Samples used in this investigation.
The mine samples were obtained using personal sampling pumps operating at 1.7 liter/min preceded by Dorr-Oliver cyclones, sampling cassettes containing 0.8-µm impactors and 37-mm quartz fiber filters (SKC Inc., Eighty Four, PA) as described in the NIOSH method 5040 (Birch Citation2002). The samples were collected at a variety of locations in the mine to provide samples that would be representative of what workers might be exposed to during their work shift. This included samples taken in active stopes at the height of a workers breathing zone, where diesel powered equipment was traversing to haul ore and muck, as well as locations in the ventilation circuit that were upstream and downstream from such stopes. The samples were taken over a period of approximately 8 h of continuous sampling. The goal was to attain samples that were typical of active mines, and preferably near the PEL. This was achieved as evidenced by the range in measured concentrations of EC and OC which extended to 264 and 108 μg/m3 respectively. After collection, the filters were sealed inside the cassettes and transported to the lab at room temperature, as is done in the regulatory method.
Laboratory generation of DPM standards
The lab-based system consisted of a diesel generator, an insulated sampling tube, a dilutor, a quiescence chamber, and a parallel multi-port sampling manifold (). The generator was operated under multiple loading conditions from idle to 5 kW by way of a load bank; in this manner, samples with a broad range of EC to OC ratios were generated. Collection time ranged from 1 to 8 h. The sampling tube was insulated and fitted with heating tape to prevent premature condensation of volatile DPM aerosols.
Figure 1. An illustration of the lab sampling arrangement, with a diesel generator and load bank to represent an operating (loaded) engine.
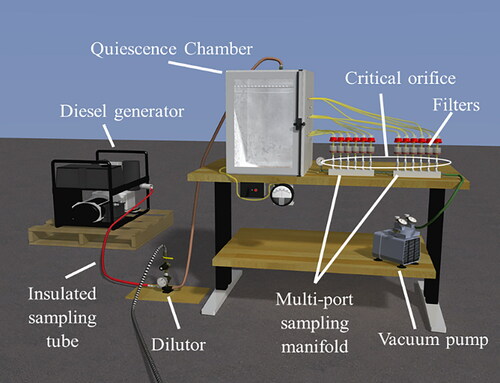
The hot stream of raw exhaust was drawn through the insulated sampling tube by means of the suction provided by an ejector-style dilutor, where it was immediately diluted with cool, dry air. The dilutor was configured to provide a dilution ratio of approximately 10:1. The DPM aerosol exiting the dilutor was directed under slight pressure into a quiescence chamber, where pressure was regulated to ∼0.05 in H2O above atmospheric pressure by a separate fan and louver control to prevent ambient air from entering the chamber.
The quiescence chamber was fitted with a 12-port manifold, with each port having a 1.7 liter/min critical orifice. The vacuum supplied to the manifold was maintained at >190 inH2O to ensure critical flow through the orifices by way of a vacuum pump. Standard 37-mm quartz fiber filters in SKC cassettes (SKC Inc., Eighty Four, PA, USA) with 0.8-µm impactors were placed upstream from each critical orifice to collect the DPM.
Of the laboratory-generated samples, several had an OC content greater than four times the amount encountered in any of the mine samples collected. These samples were collected at idle conditions, where the DPM is predominantly OC in order to provide a range over which calibration of the regression model would ensure the prediction data did not require extrapolation (Kalivas and Gemperline Citation2006). Moreover, the ratio of OC to EC in some laboratory-generated samples was in excess of 20 times that encountered in the mine samples. Again, this ensures the laboratory calibrated model is never extrapolating when estimating OC of the mine samples. This was not achievable for EC, as the T-O method would likely begin to become inaccurate due to transmittance of the laser being excessively low. This low transmittance will cause the pyrolysis correction of the T-O method to become inaccurate because the laser signal is below the noise level. In addition, several unused filters were thoroughly cleaned of OC or EC by way of performing the T-O temperature and reagent gas treatment and were then used to estimate the limit of detection if the FT-IR method.
Carbon analysis using NIOSH method 5040
In order to calibrate the infrared data, an Organic Carbon/Elemental Carbon (OCEC) Laboratory Instrument Model 5 L (Sunset Laboratory, Inc.) was utilized to measure OC and EC according to the NIOSH method 5040 (Birch Citation2002). The 5040 method involves removing the filter from the cassette and punching a 1 or 1.5 cm2 section from it. This filter section is then placed into a fused quartz oven, and the organic carbon is evolved in a flow of helium by raising the temperature in a series of temperature ramps up to 870 °C. The evolved organic compounds are converted to CO2, which in turn is converted to methane and quantified with a flame ionization detector (FID). The area under the evolution profile is proportional to the organic carbon (OC) of the DPM. After all the OC has been evolved, the flow gas is switched from pure helium to 2% O2:98% He, and the temperature is ramped stepwise to 930 °C to remove any remaining carbonaceous material. The evolved CO2 is again converted to methane before being measured by the FID. The area under this part of the evolution profile is proportional to the EC of the DPM. Total scan time is greater than 20 min. Correction for pyrolysis of OC is done by monitoring the He-Ne laser transmittance during OC evolution. Any reduction in the laser transmittance during OC evolution is attributed to pyrolysis. Correction for this pyrolysis is then done by attributing the portion of EC evolved while the laser transmittance returns to its initial value to pyrolyzed OC.
The FT-IR and 5040 analysis were done in quick succession to minimize loss of volatile OC between the two analytical methods. The importance of performing FT-IR and the 5040 method in quick succession is due to the realization that loss of freshly collected volatile OC over relatively short periods of time (even minutes) can be significant, as shown later in this article. While this issue will be addressed further in our upcoming research, it does imply that measured TC (defined as OC + EC) determined when the filter is kept for several days before measurement by an external laboratory is significantly less than the actual value in the mine due to evaporation of the OC component.
FT-IR spectroscopy of DPM loaded filters
Mid-infrared spectra of each DPM-loaded quartz fiber filter were measured immediately prior to placing each into the T-O instrument for analysis. The spectra were measured using a Bruker Alpha FT-IR spectrometer equipped with an on-axis diffuse reflection (DR) accessory that incorporated a gold mirror backing on which the filters were mounted. Radiation reaching the room-temperature pyroelectric detector is reflected from the filter in two modes, specular reflection and diffuse reflection. Specularly reflected radiation is reflected from the front surface of the filter and does not penetrate into the filter. Diffusely reflected radiation penetrates into the filter and is scattered by the fibers before finally reemerging from the top surface of the filter. The single-beam DR spectrum of the filter mounted on a flat gold-coated mirror is ratioed against the corresponding spectrum measured with the filter removed. The resulting reflectance spectrum, as a function of wavenumber,
is then converted to pseudo-absorbance,
In the DR module, the infrared beam is partially absorbed by the DPM particles with the remaining radiation being either specularly reflected by the filter or transmitted into the filter, where it is scattered. Some fraction of the scattered radiation reemerges from the surface of the filter and is passed to the detector. In practice, the detected radiation passes through the DPM layer twice for either the specular or diffuse reflection mode. Thus, the value of of the DPM layer is potentially twice as high as the value of absorption,
that would have been in a transmission mode measurement. A spectrum measured by passing the infrared beam through a thin film on the surface of a flat metal is commonly known as a transflection spectrum (Bertie Citation2001). For a diffusely reflecting substrate such as a ceramic disk or, in this case, a quartz-fiber filter, the term “diffuse transflection” may be more appropriate.
If the spectrum of the filter was measured in the transmission mode, the beam would have been severely attenuated by scattering above 2000 cm−1 and by scattering and absorption below 2000 cm−1, as can be seen in .
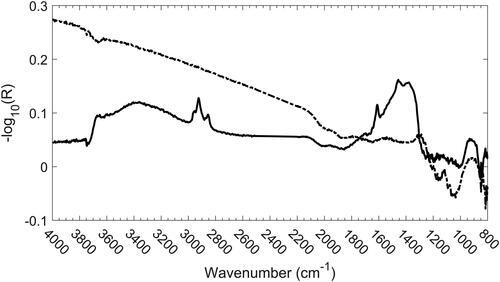
Figure 2. Transmission (dashed line) and reflection (solid line) spectra of a clean quartz-fiber filter showing near-opacity below 1260 cm−1.
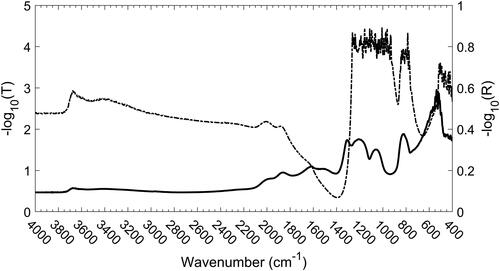
The low absorption and the strong scattering of the quartz fibers between 2000 and 4000 cm−1 make this region ideally suited for rapid measurement of the DR spectrum of the DPM on the surface of the fiber. The only significant features in the clean quartz fiber spectrum within this region are a broad band caused by adsorbed water at about 3300 cm−1 and a silanol (Si-OH) band around 3700 cm−1 (McDonald Citation1958). The most apparent difference between the spectrum of a clean filter and that of a DPM-laden filter is the series of peaks between 3000 and 2800 cm−1. The peaks are characteristic of symmetric and antisymmetric stretching modes of aliphatic CH2 and CH3 functional groups (Mayo Citation2004).
Although the region around 1500 cm−1 shows a reflectance greater than 10%, spectra in this region are subject to large changes with wavelength in both the refractive and absorption indices of quartz, which in turn lead to rapid changes in either for measurements made in the transmission mode or
for DR measurements (Ewing et al. Citation2020; Kitamura, Pilon, and Jonasz Citation2007). These rapid changes make the region below 2000 cm−1 less suitable for the measurement of weak absorption bands of DPM than the high wavenumber region; nevertheless, we will show that some information due to the aliphatic C-H bending bands of the OC in DPM can be measured in this region. In fact, for heavily loaded (>20 μg/cm2) samples a model can be developed based on the bending bands for CH2 and CH3; however, when limiting to levels encountered in the mine environment, the signal-to-noise ratio can be very low.
The EC of DPM leads to a very broad π→π* transition of aromatic ring structures found in graphitic carbon that peaks in the UV-visible region (Niyogi et al. Citation2006). The long-wavelength tail of this band extends to at least 2500 cm−1 in the mid-infrared. The EC content of DPM was estimated by integrating the pseudo-absorbance in the region spanning 4000 to 3796 cm−1 and calibrating this area against the value of the EC found by the 5040 method. It was noticed that many of the spectra exhibited a variable vertical offset at every wavenumber that seemed to be independent of the DPM. This is to be expected since a gold mirror was used as the reference spectrum and the position of the filter within the reflection accessory was not particularly well controlled. Additionally, the process of punching out a filter portion described in the Carbon Analysis Using NIOSH Method 5040 section of this article creates a somewhat random surface profile—for example, an edge of the filter punch may be bent upward on the order of 1 mm. These effects are superimposed on the wavelength-dependent features found in the spectrum of the filter. To account for these effects before integration, the vertical offset in each spectrum was reduced by normalizing each spectrum to its average absorption value over the range of 838 to 818 cm−1, where it is believed the DPM has a minimal absorption or scattering.
Spectra were measured at a nominal resolution of 4 cm−1. Twenty-four scans were averaged so that the total scan time was less than one minute. The background was collected and updated every 30 min. With this protocol, no time was required to allow for the equilibration of water vapor. The raw DR spectra were baseline corrected and integrated over the spectral regions associated with aliphatic methyl CH2 and CH3 groups using MATLAB. Baseline correction was done by way of a second-order polynomial fit to the spectrum adjacent to the area under investigation. The exact portion of the spectrum to which the polynomial was fitted to is stated for each of the calibration. Baseline correction was not required for the EC estimation.
Regression analysis
Univariate calibrations were fitted by least squares with either the 5040 OC or EC measurements set as the dependent variable and the area of selected band(s) as the independent variable. Band areas were estimated by integrating baseline-corrected spectra over the band of interest. Note that this particular form of Beer’s law, fitted using ordinary least square regression, assumes errors in the spectra are negligible (Haaland and Thomas Citation1988). This has been shown to be a very reasonable assumption when quantifying filter-bound carbon in atmospheric aerosols (Dillner and Takahama Citation2015a; b; Weakley, Takahama, and Dillner Citation2018).
The root mean square error of calibration (RMSEC; laboratory generated) and prediction (RMSEP; mine) samples are provided in the below for each of the infrared absorption band modes and are discussed in the following sections. The RMSEC was calculated as:
(1)
(1)
where n is the number of samples in the subset, m is the number of coefficients in the linear model minus 1 (i.e., m = 1 in this case); yi and
are the concentration of OC of the ith sample as given by the FT-IR method and the 5040 method, respectively. The minus 1 is included because the model includes an intercept. The RMSEP is given by:
(2)
(2)
where p is the number of samples in the prediction set,
and the other symbols are the same as described for EquationEquation (1)
(1)
(1) . Additionally, the root mean square error of the calibration data when limited to samples equal to or less than the highest mine sample OC loading (10.8 μg/cm2) is provided and denoted RMSECr. The RMSECr figure of merit makes comparison between laboratory and mine samples commensurate as uncertainty increases with OC (and EC) content on the filters.
Table 2. Figures of merit for the univariate regression models.
Although we investigated several spectral ranges for calibration, regions spanning 3100 to 2700, 1500 to 1400, and 1400 to 1340 cm−1 yielded the most acceptable results. FT-IR estimated OC or EC is also plotted on the vertical axis with T-O OC or EC on the horizontal axis (a.k.a., cross plots) are provided for each calibration in the respective region and as online supplementary information (SI).
The regions investigated above by way of linear regression were also studied using a multivariate PLS modeling procedure. To do so, the spectra were truncated to include only the regions from 3100 to 2700, 1500 to 1400, and 1400 to 1340 cm−1. A broader portion of the spectrum which includes the three bands investigated in the Linear Regression section, while removing the CO2 band (2500–2200cm−1) and the region below 1400 cm−1, was also investigated. The use of the entire spectrum resulted in high RMSEP and these results are not included in the tables below. The RMSEC in the case of PLS is given by
(3)
(3)
where n is the number of samples in the subset, A is the number of PLS components in the model, yi and the other symbols are the same as described for EquationEquation (1)
(1)
(1) . The RMSEP for the PLS model is given by EquationEquation (2)
(2)
(2) .
The partitioning of calibration and prediction data sets was identical to that utilized in the linear regression modeling. In addition to utilizing raw spectra, pre-processing was done using first and second derivative transformation with the Savitzky-Golay 21-point, second-order polynomial filtering (Savitzky and Golay Citation1964). The number of components included in the PLS model was determined by minimizing the root mean square error of five-fold cross validation for the laboratory generated data set.
Results and discussion
Univariate regression: Organic carbon
The band between 3000 and 2800 cm−1 consists of the symmetric and antisymmetric stretching modes of the CH2 and CH3 groups (see ) where four peaks are visible in this region. This band was integrated between 3000 and 2800 cm−1 following baseline correction over 3100 to 3000 and 2800 to 2700 cm−1. The results are summarized in and shown graphically in . At first glance, it may seem surprising that the RMSEP is smaller than RMSEC as the latter was estimated from fitted data. Again, this occurs because the uncertainty in the 5040 measurements is much greater for samples with a high OC content, i.e., the range of OC mass loading on laboratory samples is roughly five times greater than mine samples thus increasing the aggregate uncertainty estimated in the RMSEC. Given this, when laboratory samples are restricted to the levels encountered within the mines, we see that RMSEC is significantly reduced, as is reflected in the corresponding value of RMSECr.
Figure 3. C-H stretching bands for the highest concentration calibration (solid line) and mine (dashed line) samples. Raw spectra (a; offset for clarity) and baseline-corrected spectra (b) are shown.
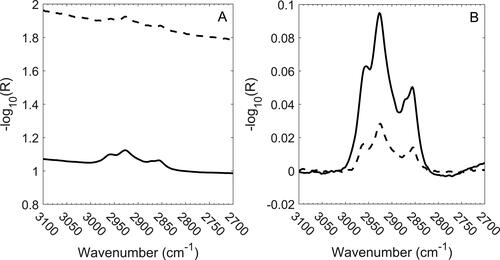
Figure 4. OC estimation using the C-H stretching bands. Calibration and mine samples are shown in gray and black, respectively. Error bars correspond to uncertainties reported by the T-O instrument.
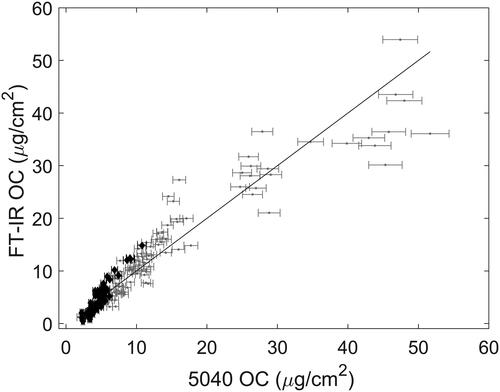
indicates that using the C-H stretching region for calibration increasingly overestimates OC loading in mine samples above approximately 5 µg/cm2. These biases are also present (to a lesser extent) when the antisymmetric CH3 bending mode and CH2 symmetric bends (1500 to 1400 cm−1) are used for calibration ( and in the SI). Surprisingly, even though the C-H bending bands are over an order of magnitude weaker than the corresponding stretching modes, the RMSEP values found using these bands are very similar to the C-H stretching region. This may suggest that the majority of the prediction error is due to factors other than the FT-IR technique’s photometric accuracy, which is known to be much better than ±1% (Griffiths and De Haseth Citation2007). Notably, the symmetric C-H bending region (umbrella mode; 1400 to 1340 cm−1) does not appear to be affected by the systematic biases of the C-H stretching and bending regions but does have a noticeably higher RMSEP ( and ). The fact that the umbrella bands are located at a similar wavenumber to a band related to co-deposited aerosol nitrate may explain the relatively poorer precision of the umbrella region when judged against the other two calibrations (see the Discussion section below).
Table 3. Figures of merit for the OC PLS regression models based on three spectral regions.
Univariate regression: Elemental carbon
As previously reported (Parks et al. Citation2019), this model was developed by first normalizing each spectrum by way of subtracting the average value of -log(R) between 838 and 818 cm−1. Once this normalization has been performed, a clear increase in the value of -log(R) with increasing wavenumber can be seen for filters that are heavily laden with EC, as illustrated by the spectra shown in . This sloping baseline, due to the tail of the π ➔ π* transition, can be extracted by integrating the absorbance from 4000 to 3796 cm−1. The resulting cross plot based on this integrated area is provided in and performance summarized in . Note there is no absorbance peak in this region (the peak lies in the UV range) and in fact this feature could easily be mistaken for baseline noise.
Figure 5. Normalized spectra of the three highest (dashed) and three lowest (solid) EC-laden filters. The lowest EC samples were less than the 5040 uncertainty of 0.1 μg/cm2; the three highest EC samples were 22, 25, and 26 μg/cm2. Vertical lines represent the endpoints of the area used for normalization (838-818 cm −1).
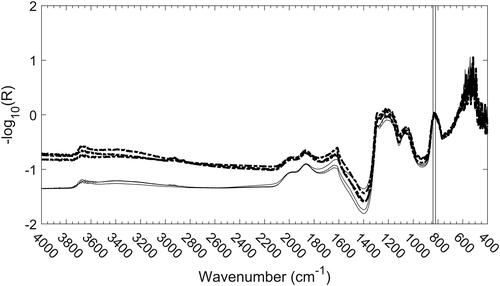
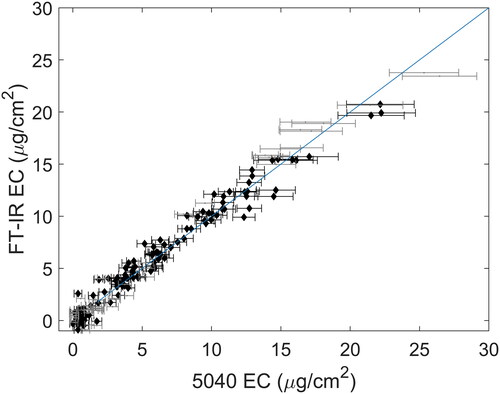
Figure 6. EC estimation by integrating the spectrum between 4000 and 3796 cm−1. Calibration and mine samples are shown in gray and black, respectively. Error bars correspond to uncertainties reported by the T-O instrument.
Until recently, baseline observed in the infrared spectra of filter-bound aerosols was attributed to the scattering of infrared radiation by the sampling filter and thus often removed prior to quantitative analysis (Takahama, Johnson, and Russell Citation2013; Weakley, Takahama, and Dillner Citation2016). Notably Weakley, Takahama, Wexler, et al. (Citation2018) determined thermal-optical reflectance (TOR) equivalent EC using transmission FT-IR spectroscopy after removing the baseline, and therefore the π ➔ π* transition, from the infrared spectra. Doing so likely had two principal impacts on EC calibration. First, as discussed in the article, defect-free elemental carbons (e.g., highly ordered pyrolytic graphite, carbon nanotubes) have very few symmetry-allowed transitions in the mid-infrared that often appear weak in experimental measurements (Lechner et al. Citation2016; Nemanich, Lucovsky, and Solin Citation1977). Given this, the wavenumbers selected by the multivariate EC calibration were assigned to either carbon-carbon polyaromatic bands activated by lattice defect (symmetry breaking) heteroatoms, such as oxygen and nitrogen, functionalized to the surface of aerosol carbon or to the surface heteroatoms themselves (Akhter et al. Citation1985; Figueiredo et al. Citation1999). In other words, removing baseline from the infrared spectra may have forced the calibration(s) to rely on surface infrared absorption, and perhaps scattering, to determine EC. Furthermore, the reliance on surface moieties, in lieu of the π ➔ π* transition of elemental carbon, may have made the calibration sensitive to the source(s) of aerosol carbon in the atmosphere. We speculate that this may at least partially explain why the authors had to use multiple calibrations to accurately predict ambient EC in all samples (compare and in Weakley, Takahama, Wexler, et al. (Citation2018)).
Partial least squares regression (PLS): Organic and elemental carbon
shows the results for the three PLS OC calibration wavenumber ranges, each distinguished according to the extent or derivative transformation applied to the input spectra. Notably, these “best” (in terms of RMSEP) PLS calibrations did not outperform the univariate calibrations even though the calibration spectra (lab standards) and test spectra (mine samples) were identical. Furthermore, the pattern of OC prediction bias for the calibration using C-H stretches and C-H bends was very similar to the univariate calibrations perhaps suggesting that the DPM generated in laboratory samples had a slightly different composition than observed in the mine environment (see and in particular). These biases were again not present in PLS calibration using the umbrella modes (Figures S11–13) but at the cost of greater imprecision.
Similar to the univariate models, the EC PLS model included spectra truncated to include the regions from 4000 to 3976 and 838 to 818 cm−1. The use of derivative filtering spectra is anticipated to steadily attenuate the monotonic increase in pseudo-absorption correlated with EC. The impact of this is seen in where the PLS predictions become increasingly imprecise as the order of the derivatives increased. Like the PLS OC calibration, the best PLS EC model are no better than those found by univariate analysis. Given an absence of improvement using a PLS approach, this may suggest that most of the prediction error observed in this calibration attributable to the combined effects of T-O analysis and sample handling as opposed to noise in the infrared spectra or choice of linear estimator.
Table 4. Figures of merit for the EC PLS regression models based on the spectral region from 4000 to 3976 cm−1 and 838 to 818 cm−1.
Finally, we investigated whether there was any benefit to including other wavelengths in the EC PLS models. A PLS calibration was developed using pseudo-absorption between 4000 and 2000 cm−1 to determine whether a better compensation for other phenomena affecting the baseline could be compensated and found a slight improvement (1.0 μg/cm2; see in the SI). We then calculated the figures of merit for spectra from 4000 to 1400 cm−1 to find whether including the C-H bending modes would lead to a further improvement. It is observed that using the wider spectral region led to the lowest RMSEP (0.9 μg/cm2; see ). Although these calibrations were slightly more precise (on average), these two PLS models were far more complex than the EC calibration presented in , i.e., they used 11 and 15 PLS components, respectively, while our first calibration required only two components. Given that these additional components were likely modeling non-linearities related to scattering alone, the best model was chosen to be the most parsimonious one presented in (Seasholtz and Kowalski Citation1993).
Spectral subtraction experiments
To further elucidate the infrared spectrum of the operationally defined OC and EC, a series of spectral subtractions was performed. First, the -log(R) spectrum of a quartz fiber filter on which a layer of DPM had been deposited was measured without treatment (Spectrum A). The filter was then mounted in the Sunset Laboratory T-O instrument, and helium was passed through it as the temperature was raised to 870 °C to remove the OC. After all the OC had been removed, the spectrum was again measured (Spectrum B). The filter was then remounted in the T-O instrument, and the remainder of the carbon was removed by the passage of 2% O2:98% He and increasing the temperature to 930 °C. The spectrum of the filter was again measured (Spectrum C). The spectrum of the organic carbon was determined by subtracting Spectrum B from Spectrum A, while that of the elemental carbon was determined by subtracting Spectrum C from Spectrum B. The resulting difference spectra are shown in . It can be seen that the EC spectrum increases with increasing wavenumber, which is consistent with what one might expect from the tail of the π ➔ π* transition.
Figure 7. Mid-infrared spectra of 5040 OC (solid line) and EC (dashed line) estimating using spectral subtraction.
The OC spectrum in clearly shows the aliphatic C-H stretching band even though the C-H bending modes cannot be seen without baseline correction. The broad band at about 3300 cm−1 is due to the loss of adsorbed water from the filter, and a sharper feature seen at ca. 3600 cm−1 is due to the loss of silanol (SiOH) groups. More significantly, a broad band at 1380 cm−1 appears to be caused by the decomposition of a heavy-metal nitrate since the antisymmetric N-O stretch of nitrates is known to be very broad and able to absorb at this frequency (Hannah Citation2004). The shoulder at 1610 cm−1 suggests that this nitrate is Fe(NO3)3.H2O (Linstrom and Mallard Citation2018). Ferric nitrate appears to be formed in the diesel flame and is thermally decomposed at a temperature well below 870 °C as shown in the equation that follows:
The decomposition product, Fe2O3, does not absorb IR radiation above 800 cm−1 and would therefore not be seen in the difference spectrum (Spectrum A – Spectrum B). Neither of the gaseous products of the decomposition reaction would give a signal on T-O analysis. It is noteworthy that ferric nitrate is a violet solid and hence would interfere with some wavelengths measured by an aethalometer, an instrument that is currently used for the measurement of black carbon.
Loss of volatile OC
The errors at high DPM loadings when utilizing the C-H stretch as seen in are quite large, in part because of the errors associated with the T-O method and in part because of small time differences between the sample collections and the start of the FT-IR measurements, during which time some volatilization of the OC component of DPM occurred. Evidence of this volatility is shown in and has been reported previously (Chow et al. Citation2001).
Figure 8. Loss with time of volatile OC from a fresh sample prepared in the laboratory estimated by integrating the aliphatic C-H stretching bands (3000–2800 cm−1) in the infrared spectrum of DPM collected on a quartz-fiber filter.
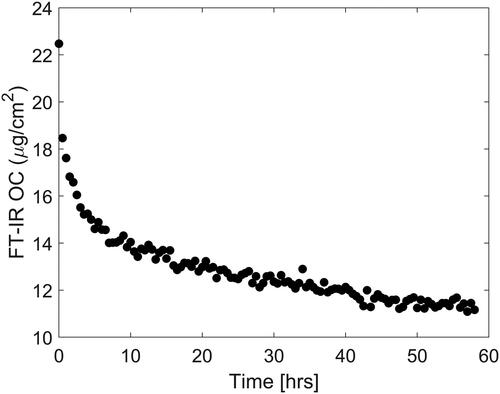
The data in were obtained by the application of the univariate FT-IR method to a DPM-laden filter over the course of roughly 60 h. It is clear that the volatility of alkanes in the OC fraction makes measurements of OC inaccurate if not done in real time.
Limits of detection
The limit of detection (LOD) for the univariate methods can be calculated a number of ways (Lavagnini and Magno Citation2007). In the case of univariate modeling, one commonly accepted and widely used definition is 3 times the standard deviation (σ) of predicted blank samples. Using this definition, we arrive at the following LOD values for our univariate method ().
Table 5. Summary of limits of detection (LOD) for the models presented in and (row 1).
The reason that the LOD of the C-H bending modes is greater than that of the stretching bands is likely due to the bending modes suffering from interference by the vibration-rotation lines of atmospheric water vapor. Note that in practice, TC values near the LOD are of little interest as the accuracy near the PEL is of greater importance.
It is also worth noting that field blanks “almost never have lower than 0.4 to 0.6 μg/cm2 and typically are about 1.0 μg/cm2 [OC]” as stated in the Sunset Laboratory’s Organic Carbon/Elemental Carbon OCEC Laboratory Instrument Manual Model 5 L. As a result, in order to obtain a blank sample, it was necessary to clean a filter by performing the 5040 analysis to remove any OC or EC (almost entirely OC), and then immediately obtain a spectrum. It should be noted that this removed the adsorbed water and silanol features in the IR spectrum of a quartz fiber filter.
Conclusions
Organic and Elemental carbon (OC and EC) are strictly operational quantities obtained using a thermal analysis method and, therefore, cannot be directly measured by FT-IR spectrometry. The purpose of the study was to show that the strong correlations between features in the FT-IR spectrum of DPM with OC and EC measured by the T-O method may use used for quantitative analysis. This work shows that the intensity of aliphatic C-H stretching and bending vibrations are principal determinants of OC. Of the prediction models for OC using the areas of selected bands of alkanes or alkyl groups investigated here, the lowest RMSEP was obtained by integrating the C-H stretching region from 3,000 to 2,800 cm-1 after baseline correction. Although the difference in RMSEP between this model and the PLS model based on a wider spectral region is small, the univariate integration model is more commensurate with a portable device because of its simplicity. The main source of error in the results obtained by FT-IR spectrometry is likely the error in the T-O reference as well as factors related to sample handling and the diversity of DPM sources at the mine site.
Wavenumbers usually associated with spectral baselines and filter scattering are actually strong predictors of T-O EC as they capture the tail of the π ➔ π* transition of elemental carbon. The absorbance of this monotonic increase is extracted by normalizing each spectrum to a low wavenumber region wherein OC has no significant absorption bands. In this work, the average value of in the region of 838 to 818 cm−1 was utilized was used for normalization. This was required since a clean reference filter was not utilized in this work. In practice, a portable device would measure the clean filter which would supplant the need for such normalization. If such a clean filter measurement is not possible, normalization to the region of 2609 to 2591 cm−1 results in a modest reduction of accuracy with RMSEP = 1.95 μg/cm2. This is noted in light of the fact that it would allow one to estimate EC and OC based on a spectrum above 2500 cm−1 thereby enabling the use of a quantum detector such as PbSe in place of the pyroelectric detector used in this work. The use of such a detector would increase the sensitivity by at least an order of magnitude.
Infrared instrumentation is likely to be more readily made portable compared to thermal optical instruments since canisters of high purity reagent gases are not needed. In the mining environment, any method or device which is intended to capture real-time or near real-time data must also be portable to effectively monitor the exposure of miners to DPM. The method that we have described here is directly applicable to portable measurements of DPM and is sensitive enough to be of use in an end of shift device. Temporal resolution on the order of minutes would theoretically be possible at or near the PEL provided the filter face velocity is increased in a manner similar to that described in Noll et al. (Citation2020). Even shorter measurement times can be expected provided a more sensitive detector (e.g., PbSe) is used.
Disclaimer
The findings and conclusions in this article are those of the authors and do not necessarily represent the official position of the National Institute for Occupational Safety and Health, Centers for Disease Control and Prevention. Mention of any company or product does not constitute endorsement by NIOSH.
Supplemental Material
Download MS Word (1.3 MB)References
- Akhter, M. S., J. R. Keifer, A. R. Chughtai, and D. M. Smith. 1985. The absorption band at 1590 cm − 1 in the infrared spectrum of carbons. Carbon 23 (5):589–591. doi: 10.1016/0008-6223(85)90096-X.
- Benbrahim-Tallaa, L., R. A. Baan, Y. Grosse, B. Lauby-Secretan, F. El Ghissassi, V. Bouvard, N. Guha, D. Loomis, and K. Straif. 2012. Carcinogenicity of diesel-engine and gasoline-engine exhausts and some nitroarenes. Lancet Oncol. 13 (7):663–664. doi: 10.1016/S1470-2045(12)70280-2.
- Bertie, J. E. 2001. Optical constants. In Handbook of vibrational spectroscopy: Introduction to the theory and practice of vibrational spectroscopy, ed. P. R. Griffiths and J. M. Chalmers, 3745–3793. New York: John Wiley & Sons Ltd.
- Birch, M. E. 2002. Occupational monitoring of particulate diesel exhaust by NIOSH method 5040. Appl. Occup. Environ. Hyg. 17:400–405. doi: 10.1080/10473220290035390.
- Cantrell, B. K., and J. Volkwein. 2001. Mine aerosol measurement. In Aerosol measurement: Principles, techniques, and applications. 2nd ed., ed. P. A. Baron and K. Willeke, 801–820. New York: John Wiley & Sons Ltd.
- Chow, J. C., J. G. Watson, D. Crow, D. H. Lowenthal, and T. Merrifield. 2001. Comparison of IMPROVE and NIOSH carbon measurements. Aerosol Sci. Technol. 34 (1):23–34. doi: 10.1080/02786820119073.
- Dillner, A. M., and S. Takahama. 2015a. Predicting ambient aerosol thermal-optical reflectance (TOR) measurements from infrared spectra: Organic carbon. Atmos. Meas. Tech. 8 (3):1097–1109. doi: 10.5194/amt-8-1097-2015.
- Dillner, A. M., and S. Takahama. 2015b. Predicting ambient aerosol thermal-optical reflectance measurements from infrared spectra: Elemental carbon. Atmos. Meas. Tech. 8 (10):4013–4023. doi: 10.5194/amt-8-4013-2015.
- Ewing, K. J., K. J. Major, J. Sanghera, R. V. Kala, S. E. Howington, and J. Ballard. 2020. Behavior of the reststrahlen band in the 17-25 μm spectral region in the diffuse reflection spectra of sand and silt mixtures. Appl. Spectrosc. 74:334–339. doi: 10.1177/0003702819884323.
- Figueiredo, J., M. Pereira, M. Freitas, and J. Orfao. 1999. Modification of the surface chemistry of activated carbons. Carbon 37 (9):1379–1389. doi: 10.1016/S0008-6223(98)00333-9.
- Griffiths, P. R., and J. A. De Haseth. 2007. Fourier transform infrared spectrometry. 2nd ed. Hoboken, NJ: John Wiley & Sons.
- Haaland, D. M., and E. V. Thomas. 1988. Partial least-squares methods for spectral analyses. 1. Relation to other quantitative calibration methods and the extraction of qualitative information. Anal. Chem. 60 (11):1193–1202. doi: 10.1021/ac00162a020.
- Hannah, R. W. 2004. Groups containing N = O bonds, or Si, P, S, or halogen atoms. In Course notes on the interpretation of infrared and Raman spectra, ed. D. W. Mayo, F. A. Miller, and R. W. Hannah, 217–246. New York: John Wiley & Sons, Inc.
- Kalivas, J. H., and P. J. Gemperline. 2006. Calibration. In Practical guide to chemometrics, ed. P. J. Gemperline, 114. Boca Raton, FL: CRC/Taylor & Francis.
- Khan, M. U., K. O. Homan, S. A. Saki, M. Z. Emad, and M. A. Raza. 2021. Real-time diesel particulate matter monitoring in underground mines: Evolution and applications. Int. J. Min. Reclam. Environ. 35 (4):291–305. doi: 10.1080/17480930.2020.1818937.
- Kitamura, R., L. Pilon, and M. Jonasz. 2007. Optical constants of silica glass from extreme ultraviolet to far infrared at near room temperature. Appl. Opt. 46:8118–8133. doi: 10.1364/AO.46.008118.
- Kittelson, D. B., M. Arnold, and W. Watts. 1999. Review of diesel particulate matter sampling methods: Final report. Minneapolis: University of Minnesota.
- Kittelson, D. B., W. F. Watts, and J. P. Johnson. 2004. Nanoparticle emissions on Minnesota highways. Atmos. Environ. 38 (1):9–19. doi: 10.1016/j.atmosenv.2003.09.037.
- Lavagnini, I., and F. Magno. 2007. A statistical overview on univariate calibration, inverse regression, and detection limits: Application to gas chromatography/mass spectrometry technique. Mass Spectrom. Rev. 26:1–18. doi: 10.1002/mas.20100.
- Lechner, C., B. Pannier, P. Baranek, N. C. Forero-Martinez, and H. Vach. 2016. First-principles study of the structural, electronic, dynamic, and mechanical properties of HOPG and diamond: Influence of exchange–correlation functionals and dispersion interactions. J. Phys. Chem. C 120 (9):5083–5100. doi: 10.1021/acs.jpcc.5b10396.
- Liang, C., and S. Krimm. 1956. Infrared spectra of high polymers. III. Polytetrafluoroethylene and polychlorotrifluoroethylene. J. Chem. Phys. 25 (3):563–571. doi: 10.1063/1.1742964.
- Linstrom, P. J., and W.G. Mallard, eds. 2018. NIST Chemistry WebBook, NIST Standard Reference Database Number 69, Gaithersburg MD: National Institute of Standards and Technology. Accessed April 22, 2021. https://doi.org/10.18434/T4D303
- Mayo, D. W. 2004. Characteristic frequencies of alkanes. In Course notes on the interpretation of infrared and Raman spectra, ed. D. W. Mayo, F. A. Miller, and R. W. Hannah, 33–72. New York: John Wiley & Sons, Inc.
- McDonald, R. S. 1958. Surface functionality of amorphous silica by infrared spectroscopy. J. Phys. Chem. 62 (10):1168–1178. doi: 10.1021/j150568a004.
- Miller, A. L., M. C. Habjan, and K. Park. 2007. Real-time estimation of elemental carbon emitted from a diesel engine. Environ. Sci. Technol. 41:5783–5788. doi: 10.1021/es070150a.
- Moynihan, R. E. 1959. The molecular structure of perfluorocarbon polymers. Infrared studies on polytetrafluoroethylene. J. Am. Chem. Soc. 81 (5):1045–1050. doi: 10.1021/ja01514a009.
- Nemanich, R. J., G. Lucovsky, and S. A. Solin. 1977. Infrared active optical vibrations of graphite. Solid State Commun. 23 (2):117–120. doi: 10.1016/0038-1098(77)90663-9.
- Niyogi, S., E. Bekyarova, M. E. Itkis, J. L. McWilliams, M. A. Hamon, and R. C. Haddon. 2006. Solution properties of graphite and graphene. J. Am. Chem. Soc. 128:7720–7721. doi: 10.1021/ja060680r.
- Noll, J. D., A. Bugarski, S. Vanderslice, and J. Hummer. 2020. High-sensitivity cassette for reducing limit of detection for diesel particulate matter sampling. Environ. Monit. Assess. 192:333.
- Noll, J. D., R. J. Timko, L. McWilliams, P. Hall, and R. Haney. 2005. Sampling results of the improved SKC diesel particulate matter cassette. J. Occup. Environ. Hyg. 2:29–37. doi: 10.1080/15459620590900320.
- Northrop, W. F., D. Zarling, and X. Li. 2017. Considerations in using photometer instruments for measuring total particulate matter mass concentration in diesel engine exhaust. In ASME 2017 Internal Combustion Engine Division Fall Technical Conference. doi: 10.1115/ICEF2017-3640.
- Parks, D. A., K. V. Raj, C. A. Berry, A. T. Weakley, P. R. Griffiths, and A. L. Miller. 2019. Towards a field-portable real-time organic and elemental carbon monitor. Min Metall Explor. 36 (4):765–772. doi: 10.1007/s42461-019-0064-8.
- Pronk, A., J. Coble, and P. A. Stewart. 2009. Occupational exposure to diesel engine exhaust: A literature review. J. Exposure Sci. Environ. Epidemiol. 19 (5):443–457. doi: 10.1038/jes.2009.21.
- Ristovski, Z. D., B. Miljevic, N. C. Surawski, L. Morawska, K. M. Fong, F. Goh, and I. A. Yang. 2012. Respiratory health effects of diesel particulate matter. Respirology 17:201–212. doi: 10.1111/j.1440-1843.2011.02109.x.
- Robinson, M., Z. G. Liu, M. Olson, and J. Schauer. 2014. Comparison of measurement strategies for light absorbing aerosols from modern diesel engines. SAE Int. J. Fuels Lubr. 7 (2):543–550. doi: 10.4271/2014-01-1570.
- Savitzky, A., and M. J. E. Golay. 1964. Smoothing and differentiation of data by simplified least squares procedures. Anal. Chem. 36 (8):1627–1639. doi: 10.1021/ac60214a047.
- Seasholtz, M. B., and B. Kowalski. 1993. The parsimony principle applied to multivariate calibration. Anal. Chim. Acta 277 (2):165–177. doi: 10.1016/0003-2670(93)80430-S.
- Takahama, S., A. Johnson, and L. M. Russell. 2013. Quantification of carboxylic and carbonyl functional groups in organic aerosol infrared absorbance spectra. Aerosol Sci. Technol. 47 (3):310–325. doi: 10.1080/02786826.2012.752065.
- van Setten, B. A. A. L., M. Makkee, and J. A. Moulijn. 2001. Science and technology of catalytic diesel particulate filters. Catal. Rev. 43 (4):489–564. doi: 10.1081/CR-120001810.
- Watts, W. F., D. D. Gladis, M. F. Schumacher, A. C. Ragatz, and D. B. Kittelson. 2010. Evaluation of a portable photometer for estimating diesel particulate matter concentrations in an underground limestone mine. Ann. Occup. Hyg. 54:566–574. doi: 10.1093/annhyg/meq020.
- Weakley, A. T., S. Takahama, A. S. Wexler, and A. M. Dillner. 2018. Ambient aerosol composition by infrared spectroscopy and partial least squares in the chemical speciation network: Multilevel modeling for elemental carbon. Aerosol Sci. Technol. 52 (6):642–654. doi: 10.1080/02786826.2018.1439571.
- Weakley, A. T., S. Takahama, and A. M. Dillner. 2016. Ambient aerosol composition by infrared spectroscopy and partial least-squares in the chemical speciation network: Organic carbon with functional group identification. Aerosol Sci. Technol. 50 (10):1096–1114. doi: 10.1080/02786826.2016.1217389.
- Weakley, A. T., S. Takahama, and A. M. Dillner. 2018. Thermal/optical reflectance equivalent organic and elemental carbon determined from federal reference and equivalent method fine particulate matter samples using Fourier transform infrared spectrometry. Aerosol Sci. Technol. 52 (9):1048–1058. doi: 10.1080/02786826.2018.1504161.