
 ?Mathematical formulae have been encoded as MathML and are displayed in this HTML version using MathJax in order to improve their display. Uncheck the box to turn MathJax off. This feature requires Javascript. Click on a formula to zoom.
Abstract
Dust samples from a residential area next to the Dee estuary saltmarsh, north-west England, UK, were collected at two heights and analyzed to investigate the potential for transporting radioactive dusts inland from the saltmarsh via an eolian pathway. 137Cs activities were found in the range from 20 ± 4 to 794 ± 113 Bq kg−1, with mean of 193 Bq kg−1 and from 15 ± 4 to 252 ± 8 Bq kg−1, with mean of 109 Bq kg−1 in dusts at 2 m and 0.3 m heights, respectively. The total annual effective doses were found as 1–41 µSv y−1 and 2–95 µSv y−1 for minimum and maximum occupancy, respectively. The maximum value of 41 µSv y−1 for the minimum outdoor occupancy falls below the world average value of 70 µSv y−1 but the maximum value of 95 µSv y−1 for the maximum occupancy is 36% higher than the world average value and is non-negligible. The collected dust samples were about 75% organic and 25% mineral particles. During sampling period at 2 m height, mean and maximum wind speeds were found 5-8 m s −1, and 16–22 m s −1, respectively. Detailed examination of radionuclide, grain size and wind data during dust collection period reveal that the estimated threshold wind speeds (5-23 m s −1) over the saltmarsh are sufficient to entrain radioactive dust particles (63–4 µm diameter) to be transported and deposited in inland, and hence poses potential health risks to coastal populations.
Copyright © 2021 American Association for Aerosol Research
EDITOR:
1. Introduction
Humans can be exposed to anthropogenic radionuclides discharged to the sea from nuclear installations through various routes (McKay and Pattenden Citation1990). Previous studies have shown that offshore Irish Sea sediment containing radionuclides discharged historically from the Sellafield nuclear waste reprocessing plant in Cumbria, NW England, represents a potentially significant source of radionuclides to the surrounding coastal environment (Aston and Stanners Citation1982; Aston et al. Citation1981). Research has revealed spatial and temporal patterns of radionuclides concentrations in offshore, intertidal and saltmarsh sediments in the Irish Sea, and the onshore movement of these contaminated sediments through tidal currents is the dominant transport mechanism of Sellafield-derived radionuclides, leading to high 241Am and 137Cs activities in the coastal region (Bonnett, Appleby, and Oldfield Citation1988; Charlesworth, Service, and Gibson Citation2006; Frindlington et al. Citation1995; Horrill et al. Citation1992; Hutchinson Citation1994; MacKenzie and Scott Citation1993; Mackenzie et al. Citation1998; McDonald et al. Citation1990; Oldfield et al. Citation1993).
It has also been discovered that radionuclides have a high affinity for fine saltmarsh sediments and the activity levels of more soluble 137Cs in far distant Dee estuary saltmarshes are quite significant and comparable to the levels of activity in sites much closer to Sellafield (Bonnett, Appleby, and Oldfield Citation1988; Clifton Citation1998; Oldfield et al. Citation1993; Rahman Citation2010). Based on previous findings, it is assumed that the high radionuclide activities stored within these saltmarsh sediment records may pose significant potential for radiation exposures via different exposure pathways to saltmarsh users and people in close proximity to these contaminated lands. This is especially the case for locations along the eastern (English) coast of the Dee estuary where settlements are located downwind of the predominant winds from the west and northwest (cf. Elliott Citation2004), and thus serve as receptors for dusts derived from the coast. Moreover, it is apparent that no detailed investigation has been made to identify the potential health risks from these saltmarsh radionuclides to the general public via direct exposure and inhalation of radioactive saltmarsh generated eolian dusts.
Humans can be irradiated from saltmarshes contaminated with radionuclides as it is observed that well developed upper saltmarshes are often used for agricultural and recreational purposes, like picnic spots, golf courses, country parks, caravan parks, nature conservation, wildfowling, grazing, etc., and these saltmarshes are in close proximity to coastal populations. Hence there is considerable potential for human exposure to these anthropogenic radionuclides in saltmarshes. Due to the long half-lives of 137Cs (30.2 y) and 241Am (432.7 y), exposures from 137Cs and 241Am are considered more important than other Sellafield-derived radionuclides with short half-lives. Humans residing close to radioactive contaminated areas may therefore have been exposed to higher doses of radiation from 137Cs or 241Am, both internally and externally, than the general population. External exposure from saltmarsh radiation to members of the public in close proximity to coastal areas depends on the occupancy time. In 1989, it was reported by MAFF that external gamma dose rates observed in British saltmarshes are mainly due to 137Cs. In contrast, internal exposure continues until the radioactive material is flushed from the body by natural processes, or when it decays. When a person inhales or ingests a radioisotope, it is distributed to different organs and stays there for days, months or years until it decays or is excreted (Maekawa Citation2002).
Policy for radioactive materials in England and Wales (the countries concerned in this study) comes under Environmental Permitting (England and Wales) Regulations 2016 (EPR16), although this does not specifically apply to private individuals, nor to naturally occurring radionuclides in their normal setting (BEIS Citation2018). However, legislation provisions are not intended to exclude radionuclides which are present in the environment as a result of permitted or exempted discharges. Further, it explicitly covers naturally occurring radioactive materials (NORM) used in ‘NORM industrial activities’ which include: (a) “the remediation of contamination from any type 1 NORM industrial activity,” and (b) materials containing artificial radionuclides that exceed threshold values (0.1 Bq g−1 in the case of 241Am and 1 Bq g−1 in the case of 137Cs). Indeed, “a substance is radioactive material or radioactive waste where, following its disposal, a process occurs which was not foreseen at the time of disposal, and results in a substantial increase in radiation exposure to the public or radioactive contamination in the environment” (BEIS Citation2018, p. 19). As such, this applies to the condition being examined in this study. In such circumstances, radioactive materials are exempt from waste regulation if they do not exceed either threshold maximum quantities or activities concentrations: 104 Bq and 10 Bq g−1, respectively, for 137Cs, and 104 Bq and 1 Bq g−1 for 241Am. Otherwise, a disposer is required to make a radiological assessment of the ‘reasonably foreseeable’ pathways for the exposure of the public to radiation and be satisfied that the radiation dose assessment does not exceed 300 µSv y−1 to the public. In the case of this study, we examine the eolian transfer of fine dust as a possible pathway.
Several previous studies established that the Dee estuary saltmarshes have significant amount of 241Am and 137Cs activities in their core records and exhibit a gradual trend of increasing concentrations with decreasing grain size (Clifton Citation1998; Clifton et al. Citation1997; Hutchinson Citation1994; Hutchinson and Prandle Citation1994; Oldfield et al. Citation1993; Rahman Citation2010). Moreover, a thorough study completed by Rahman (Citation2010) on the Dee estuary saltmarshes revealed significant 241Am and 137Cs activities in their core records, again with a gradual trend of increasing concentrations with decreasing grain size, and with a high affinity between fine grain sizes (silt to clay particles, i.e., <63 µm) and radionuclide activities. The total radioactivity does not depend solely on particle size distribution but on the availability of radionuclides that become attached to particles (Rahman et al. Citation2013).
Consequently, it can be assumed that there is a potential for these radionuclides to be physically remobilised with any resuspended dry sediments as eolian dust particles (silt to clay particles, i.e., below 63 µm) resulting from wind erosion. In assessing the potential health hazard from the eolian transport of dusts contaminated by legacy discharges of radionuclides into the coastal environment, this study translates the findings from Rahman (Citation2010) on the relationships between 137Cs and 241Am activity and grain size determined for the Dee estuary saltmarsh sediments, and goes beyond the assessment undertaken by Rahman et al. (Citation2013) on the health hazard posed by the aqueous redistribution of sediment-bound radionuclides due to coastal erosion of saltmarshes. Here, assessment of the eolian pathway is especially important for pollutants that are known to pose significant health risks for coastal residents who might inhale radionuclides attached to eolian dusts or may ingest radionuclides in the foodchain (cf. Maekawa Citation2002), or may directly be exposed during outdoor activities in their yard.
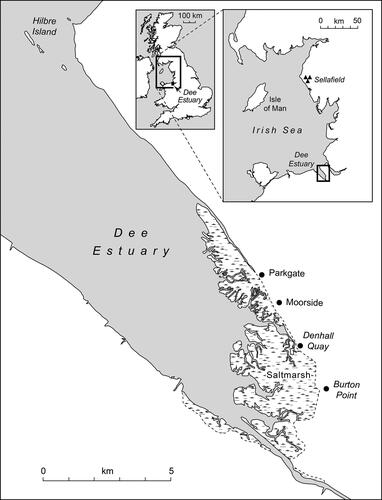
The present study focuses on the Parkgate saltmarshes in the Dee estuary, NW England (), where the examined areas possess high levels of radioactivity and are in close proximity to residential areas. Hence, there is the potential for transferring radioactive dusts from contaminated saltmarshes to inland residential areas via the eolian pathway. With this view, eolian dusts were collected on two Frisbee passive dust collectors filled with round and polished marbles, following the principles described in Sow, Goossens, and Rajot (Citation2006), to observe seasonal as well as height-related variations in the accumulated dusts. These dusts were analyzed for their 137Cs and 241Am activities and their grain size distribution, thus providing a radionuclide flux, a budget expressed as a proportion of the saltmarsh radioactivity reservoir, an analysis of the likely source of the radionuclide pollution, and an assessment of the potential health risk to the population of the adjacent coastal area. Together with seasonal and height parameters, radionuclide data were also examined in relation to meteorological data from the nearest weather station, which is situated in the outer part of the Dee estuary at Hilbre Island, approximately 14 km NW from the study site (location: 53˚22.956′N 3˚13.680′W). The wind data were supplied by the Proudman Oceanographic Laboratory (now the National Oceanography Center), Liverpool. The particle size analysis (PSA) of dusts was undertaken using an optical microscopic method at × 600 magnification to identify grains of <10 µm size ranges, which are the dust particles of respirable size - called PM10 (HPA Citation2010).
Figure 1. Locations of the Dee estuary saltmarshes in north-west England, UK; Locations of Hilbre Island and Parkgate saltmarsh; ODN refers to the altitude datum for Great Britain, Ordnance Datum Newlyn.
2. Research methodology
2.1. Study site description
The Dee is a funnel-shaped macro-tidal, coastal plain type estuary (53°10′ N; 3°10′ W) located in the eastern Irish Sea between the Wirral peninsula, England and the Flintshire coastline of North Wales (Huckle, Marrs, and Potter Citation2004; Moore et al. Citation2009). It is ca. 130 km south of Sellafield (calculated from 1:10,000 Ordnance survey map of UK supplied by EDINA) and is one of the largest estuaries in NW England, extending from the estuary mouth far up to the city of Chester (). Most of the estuary is occupied by intertidal mudflat and saltmarsh habitats, resulting from progressive silting of the estuary since the 11th century. Natural processes of silt deposition have been accelerated by human interventions to reclaim land and to maintain the main tidal channel for navigation (Marker Citation1967). By the early 18th century, canalization of the river Dee at the head of estuary in association with the construction of a sea wall, as well as associated land drainage and reclamation, drastically changed the hydrodynamic regime. The ‘new cut’ canalization thus forced a shift of the main navigation channel from the eastern English shore toward the Welsh shore. As a result, heavy siltation and a high level of accretion on the eastern English shore led to the estuary becoming a very shallow system due to the ensuing low energy conditions, and hence huge areas became colonized by saltmarsh, pioneered initially by Salicornia and then dominated by Spartina anglica in the 1930s (Marker Citation1967; Moore et al. Citation2009). The modern Dee estuary has an effective length of 30 km, with a maximum width of 8.5 km at the estuary mouth and occupying an area of 16,101 ha (Davidson Citation1996; Moore et al. Citation2009). Its tidal range varies between 5.33 m at the landward end at Connah’s Quay and 9.72 m at the seaward end at Hilbre Island (Moore et al. Citation2009).
2.2. Establishment of dust collector
Two Frisbee dust collectors were deployed on May 2008 over a time period of fourteen months in a resident’s garden nearby the contaminated Parkgate site of Dee estuary saltmarsh, at 2 m and 0.3 m heights from the ground () and at approximately ca. 3–4 m and ca. 1–2 m above the saltmarsh surface, respectively. The aims of deploying the dust collectors were to investigate differences in radionuclide flux as a function of boundary layer transport processes and the samples were collected at intervals to investigate any seasonal variability in radionuclide flux. The design of each Frizbee dust collector (FDCO) follows a combination of Marble dust collector (MDCO) and Frizbee dust collector that has been modified after a study completed by Sow, Goossens, and Rajot (Citation2006).
Figure 2. (a) Long height (LH) and short height (SH) dust collectors with funnel tube (upper-part height: 90 cm, LH and 55 cm, SH); (b) overall view of dust collectors; (c) ground fitting of dust collectors.
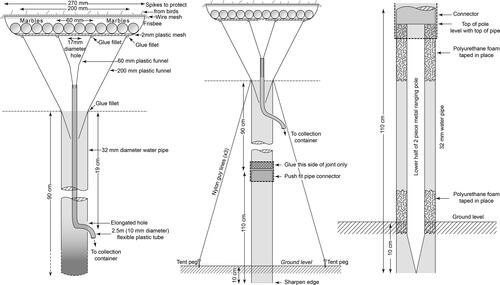
Each dust collector consists of a single-piece Frizbee plastic disk that was inverted and fixed with a large plastic funnel (20 cm) using glue, and mounted on a plastic water pipe (3.2 cm diameter) at a given height above the ground. To trap sufficient dusts for gamma analyses, a circular piece of 0.2 cm plastic mesh was placed inside the Frizbee disk and glass marbles were filled on top of the mesh (). Glass marbles were used to prevent dust that had not yet filtered or washed (by rain water) into the bottom of the disk from being blown away, i.e., to trap all dusts deposited on the collectors. There was a hole of ca. 1.7 cm at the center of the disk and another small plastic funnel (6 cm) was fixed using glue in the middle of the underside of the Frizbee disk, and fitted with a 105 cm-long clear plastic tube that goes into a pre-washed plastic collection container so that rain-washed dust collected by the Frizbee disk can pass through tube into the collection container. The only difference between the two collectors was their mounting heights, with consequent different lengths of water pipe. For additional protection both dust collectors were covered with wire meshes along with some spikes to protect the collectors from contamination by birds. The two dust collectors are defined as LH (for long height dust collector at 2.0 m) and SH (for short height dust collector at 0.3 m) in the present study.
2.3. Sample collection and preparation
All particles within the dust samples are expected to be a mixture of particles (polluted and unpolluted) originating either from the saltmarsh, roadside and inland areas as well as from wet deposition of atmospheric dust via rain water and sampling includes dusts and radionuclides (if any) that have been desorbed into the rain water. Dusts and rain waters captured by the collectors were sampled at approximately 2-month intervals over a fourteen-month period, and results were sub-divided into two hydrological seasons: summer (April–September) and winter (October–March). During each collection period, the dusts and rain water were transferred via a collection pipe (plastic) into two plastic containers placed underneath the dust collectors on the ground. After returning samples to the laboratory, they were kept in the fridge before further chemical treatment. The plastic containers used for collection were thoroughly pre-washed, acidified with 10% nitric acid (HNO3) and washed again with double distilled water before placing in the field each time.
2.4. Chemical treatment of rain water and gamma measurement
Before chemical treatment, each dust-washed rain water sample was transferred into a pre-washed 2 litre plastic bottle with proper labeling which was acidified with 10% nitric acid (HNO3) and double distilled water. Each collection from two dust collectors was treated for chemical separation individually with proper identifications under a fume cupboard. Radionuclides were removed from the dust washed rain water samples (i.e., solution) by co-precipitation with manganese dioxide (Short Citation1999), separated from the supernatant liquid by filtration through a 0.45 µm membrane filter (Cellulose Nitrate filter paper supplied by Whatman International Limited) with the help of a vacuum pump. When the whole solution was filtered, the filter paper with its residues, i.e., the dust sample was dried at 40 °C in an oven and then placed onto a pre-weighed piece of cling film. After that, the filter paper along with the cling film was wrapped up, rolled like a cigarette and carefully placed inside the low volume plastic sample holder with proper identification for gamma measurements using a well-type High Purity Germanium (HPGe) detector.
2.5. Gamma measurements of eolian dusts
Gamma measurements of all dust samples were made using a well-type HPGe detector, operated with an electric field of 3000 V with negative bias and with a resolution of 1.89 and 2.45 at 59.7 keV and 1332 keV, respectively. The detector had a crystal length of 6.08 cm, diameter of 5.52 cm, effective well depth of 4.42 cm and well diameter of 1.65 cm. The detector configuration was set in the 40-2000 keV range, for detecting photons and the liquid nitrogen reservoir of the HPGe detector was regularly filled with liquid nitrogen at 77°K. To avoid back-scattering and reduce background activity, the detector was well-shielded by lead and copper sheets. The sample holder employed was of 0.5 cm diameter and 5 cm height.
The energy calibration of the detector was done using NPRL 137Cs and 241Am point sources and used to check regularly before starting of the sample counts and the HPGe (well-type) detectors have been calibrated using NPL standard sources adsorbed onto a powdered resin base. The calibration of these secondary standards was checked against the University of Liverpool Environmental Radioactivity Research Center’s (ERRC) HPGe coaxial detector. The absolute efficiencies of the detectors were determined using calibrated sources and sediment samples of known activity. Corrections were made for the effect of self-absorption of low energy γ-rays within the sample (Appleby, Richardson, and Nolan Citation1992). Radioactivities of dust samples were calculated using ERLIB software that includes corrections for the effect of self-absorption of low energy γ-rays within the sample (Appleby, Richardson, and Nolan Citation1992).
2.6. Microscopic particle size analysis
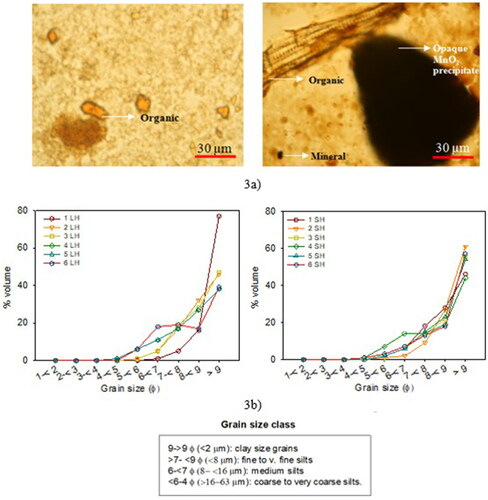
As the amounts of dust particles were insufficient to perform a standard laboratory particle size analysis (PSA) using a laser granulometer, optical microscopic grain size analyses were performed using a Nikon optical microscopic at ×600 magnification for twelve microscope slides of dust samples from both the long and short height dust collectors (six from each collector). A total of 50 ‘field-of-view’ observations were made on each slide to reduce possible analytical uncertainty. All observations were made starting from an end point of the slide and viewing it in same direction and continuing the observations in successive parallel rows to avoid any repetition of same image during grain count analyses. Percent volume was calculated based on the relative number of grains in each size class from a total number of 50 grains in each sample. For example, if 15 of the 50 grains observed were in the size range 8–4 µm, this would be an equivalent grain number volume of 30%. The same metric is applied to the relative proportions of organic and mineral particles. The total number of grains (both organic and mineral) observed were counted according to nine grain size classes: 500–250, 250–125, 125–63, 63–31, 31–16, 16–8, 8–4, 4–2 and <2 µm (medium sand, fine sand, very fine sand, coarse silt, medium silt, fine silt, very fine silt, clay/mud size range particles). In addition to determining the grain size category, each particle was classified, according to its appearance, as organic (translucent, orange to brown colored with rounded edges or internal structure) or mineral (clear to opaque, light or no color, straight or jagged edges), excluding any residual particles of MnO2 from the co-precipitation analysis ().
Figure 3. (a) Example microphotographs of representative dust samples. (b) Particle size distributions, by volume, of collected dust samples. Grain size is shown in φ to emphasize the importance of the finer grain sizes in the distribution, where φ = -log2 mm of the grain diameter, i.e., 8–9 φ = 4-2 µm, >9 φ = <2 µm.
3. Results
3.1. Radionuclide data and total annual effective dose estimations
summarizes the radionuclide analytical data of eolian dust samples from six dust collections. The dust collections, dating roughly between April to early September are considered as ‘summer’ and from September to early April are considered as ‘winter’. No 241Am could be detected above the minimum detectable activity limits whereas 137Cs could be detected for all dust samples. For the long height collector, the 137Cs activity concentrations varied from 20 ± 4 to 794 ± 113 Bq kg−1 with an average of 193 Bq kg−1; whereas for the short height collector, these values varied from 15 ± 4 to 252 ± 8 Bq kg−1 with an average of 109 Bq kg−1. The highest activities for the long and short height collectors were found to be 794 ± 113 and 295 ± 8 Bq kg−1, respectively.
Table 1. Radionuclide activity data for 137Cs and 241Am (Bq kg−1) in eolian dust samples from long height (LH) and short height (SH) dust collectors.
Following detailed calculation procedures stated in Rahman et al. (Citation2013), considering the minimum and maximum outdoor occupancy hours of 312 h and 730 h, the measured 137Cs activity concentration ranged (15–794) Bq kg−1 in investigated dust samples of this study correspond to the estimated minimum and maximum total annual effective dose range (including external and inhalation) of (1–41) µSv y−1 and (2–95) µSv y−1, respectively. It is seen that for minimum outdoor occupancy hours, the maximum estimated total annual effective dose of 41 µSv y−1, falls within the world average value of 70 µSv y−1 (UNSCEAR Citation2000), whereas for the maximum outdoor occupancy hour the total annual effective dose of 95 µSv y−1 is 36% higher than the world average value, which is significant. Other studies have also revealed higher 137Cs activity concentration data from the Dee estuary compared with other saltmarshes in the UK (Bonnett, Appleby, and Oldfield Citation1988; Hutchinson and Prandle Citation1994; Oldfield et al. Citation1993; Rahman Citation2010; Rahman et al. Citation2013). This exposure pathway indicates a non-negligible concern and further in-depth investigation on the health impact is recommended.
The average mass of dust per day for the long height collector varies from 0.004 to 0.021 g day−1 whereas it varies from 0.002 to 0.037 g day−1, for the short height collector (). also reveals that there is an overall increasing trend of activity levels of 137Cs for both collectors in winter, with the exception of the activity level of the second dust sample collection from the short collector, which is unexpectedly high. Moreover, data of reveals that there is no particular increasing trend of dust accumulation. From first principles, it is reasonable to expect comparatively higher wind erosion and dust production in winter than in summer as the saltmarsh surface is covered less by vegetation compared to summer and winds are also generally higher in winter (e.g., Poirier Citation2014). However, the saltmarsh surface is unlikely to dry out in winter and this probably reduces the potential for wind erosion during winter.
3.2. Microscopic particle size analytical data
A detailed study on radionuclide association with sized particle done by Rahman (Citation2010) revealed that higher radionuclide activities are observed in fine silt to clay particles (<2 µm), i.e., there is an increasing trend with decreasing particle size (). Hence, microscopic analysis was undertaken to identify % volume of particle size fractions of <63 µm within the collected dust samples.
Table 2. 241Am and 137Cs surface activities (Bq kg−1, dry wt basis) in surface sediment (non particle size fractioned) and particle size fractioned samples of surface (1 cm) and short core (10 cm) sediments from the Dee estuary saltmarshes of NW England, UK (Rahman Citation2010).
illustrates the % volume against grain size (from 500 to >2 µm size ranges) distribution patterns for both long and short height dust collectors. It needs to be mentioned here that particles less than 4 µm could not be identified due to limitations of the magnification at × 600. It is seen that there is a gradual increase in % volume of grains from coarse silts to clay particles (i.e., from 4 µm to >2 µm) for all dust samples from both collectors. It is seen that the highest percentage volume of grains was found for the grains in range of 2 to >2 µm. On average, approximately 75% of grains were fine organic particles. Indeed, there may be some contribution from the MnO2 precipitate arising from the chemical treatment of rain water to collect the radionuclides. shows an example digital photograph of the common view microscopic slides of dust samples. The microscopic view of representative slides of all dust samples in this study revealed that there are mainly two types of particles: organic and mineral. The optical density of the organic particles is high compared to the mineral particles. The particles with light brown or orange colors are the organic matter whereas particles with clear to opaque, light or no color, straight or jagged edges are the mineral particles (mainly feldspar type). Particles with opaque type are assumed as the MnO2 precipitate.
3.3. Possible reasons for the absence of 241Am in dust samples
Though 241Am is present in the Dee estuary saltmarsh surface sediments, it is absent in the windblown dust samples. A better explanation of relatively high concentration of 137Cs in organic matter compared to 241Am can also be understood from analyzing characteristics of these two radionuclides, as various radionuclides behave differently in the environment and their chemical form, distribution coefficient (TF), mobility and other factors of radionuclides have an influence on their transfer to plants (Golmakani, Moghaddam, and Hosseini Citation2008). As such, 137Cs is environmentally mobile, acting like potassium, and can exist in both solution or particulate forms. It is thus readily taken up by plants through absorption/adsorption process and also be attached with mineral particles and be attached on to the saltmarsh plants during tidal inundation. In contrast, 241Am exists more in particulate form in environment, and is relatively immobile due to its low solubility characteristic. It is less readily taken up by saltmarsh plants, mainly adsorbs on to mineral matter and, thus, remains largely in the soil or sediment (Duursma Citation1972; Evans, Alberts, and Clark Citation1983; Comans et al. Citation1989; EGE Citation1994; Appleby Citation1997).
Therefore, it is assumed in this study that the high % volume of organic (ca. 75%) and lower % volume of mineral (ca. 25%) dust particles are the main reasons for the relatively high activity levels of 137Cs and below minimum detectable activity levels of 241Am. However, opaque black particles (i.e., MnO2 precipitate) were counted as opaque ‘minerals’ and thus contributed to the % volume of ‘minerals’. Hence, the mineral contents may slightly be overestimated and the % volume of organic contents are likely higher than the estimated value (i.e., >75%). In addition, although rain-derived atmospheric 137Cs (i.e., from fallout) is also included within the dust samples in this study due to the sampling method, our literature survey confirmed that this contribution is insignificant at the time of the sampling (Mitchell Citation2010; RIFE, 2017).
4. Interpretation and discussion
For a better understanding, the radionuclide analytical data from the dust samples can be interpreted and discussed following three steps. In the first step, the radionuclide data from collected dust samples will be examined to validate the source of origin of measured 137Cs; i.e., to investigate whether it originated from the saltmarsh or from fallout. In the second step, microscopic data from all dust samples will be examined to identify % volume of grains present within the dust samples in the size range of <63 µm and also the types of particles (i.e., organic and mineral). 137Cs activity data from the dust and size-fractioned samples (i.e., <63 µm grains) will be compared to observed radioactivity levels in saltmarsh sediments to identify possible reasons for activity variations of 137Cs in the dust samples. In the third step, radionuclide data of dust samples will be examined to identify the seasonal variations of dust accumulation rate and associated radionuclide activity. Moreover, to justify the potential of having saltmarsh-derived 137Cs in dust samples collected from nearby residential area, meteorological data of the Hilbre Island weather station will also be considered.
4.1. Validation of the source of origin of 137Cs
Dusts accumulate from both dry and wet deposition of dust from atmosphere. Dry deposition may come from roadside soil, inland soil and from nearby saltmarsh areas, wet deposition is via rainfall. Fallout-derived 137Cs can be found in both inland and in coastal areas but the Sellafield-derived 137Cs are found in estuary saltmarshes (Oldfield al., Citation1993; Bonnett, Leeks, and Cambray Citation1989; Hutchinson Citation1994). It is therefore important to consider the origin of the measured 137Cs within the collected dust samples. Atmospheric fallout of 137Cs has arisen from nuclear weapons testing since 1945 and from the Chernobyl accident (1986) in Russia. It was shown by Peirson and Salmon (Citation1959) that the deposition of weapon test 137Cs is a linear function of rainfall and the accumulation of the fallout 137Cs activity is generally found to be higher in upland regions of the United Kingdom where the annual rainfall is high (Chandler and Gregory Citation1976, Clark and Smith Citation1988, Smith and Clark Citation1989). Lake sediments also form an important component of any study of fallout deposition as these records incorporate direct fallout onto the lake together with a proportion of fallout on to the catchment and subsequently transferred to the lake via runoff.
As rain-derived atmospheric 137Cs (i.e., from fallout) was included within the dust samples due to the sampling method, recent radioactivity data from air, rain water and lake sediments from different parts of UK along with North West England have been investigated to identify and confirm the source of measured 137Cs in dust samples. The literature survey confirmed that this contribution is insignificant at the time of the study (Mitchell Citation2010; RIFE, 2017). As reported by Mitchell (Citation2010), 137Cs concentrations in air and rain water samples collected during 2010 from seven sites of all around UK found below the analytical detection limit and were comparable to the previous 10 year’s data. Also, the results showed a continuing decline of anthropogenic radioactivity in the environment. In another report, RIFE (2017) showed that the 137Cs concentrations in air and rain water collected from nine stations around UK were found in the range between <0.5.3 × 10−7 to <1.0 × 10⁻⁷ Bq kg−1 and <0.0074 to <0.017 Bq l−1, respectively, which are negligible. The results were also less than 0.01% of those observed in 1986, the year of the Chernobyl accident. Hence, it is apparent that rain-derived atmospheric fallout contribution of 137Cs included within the dust samples in present study is insignificant. Moreover, the records of fallout 137Cs activity in rain water from NW England found it to be below the analytical detection limit (personal communication, Peter Appleby) and past decay-corrected (to 2008, i.e., the time of sampling) lake sediment records of 137Cs fallout activities (Appleby et al. Citation2003, Bonnett, Leeks, and Cambray Citation1989; Rahman Citation2010) also revealed that the 137Cs fallout radioactivity is negligible in NW England at the time of sampling. Hence, the available data indicates that the 137Cs present in dust samples of this study originated mainly from the Dee estuary saltmarsh.
4.2. Particle size data and associations
The particle size data from six sediment cores (; after study of Rahman Citation2010) from the Dee estuary saltmarsh reveal that the mean grain size of the top 20 cm sediments, i.e., where the peak activities of Sellafield-derived 137Cs are located (Rahman Citation2010; Rahman and Plater Citation2014; Rahman et al. Citation2013) is <10 µm. This means, the dust samples from the Dee estuary are derived from sediments of the same size. Also, comparison of the 137Cs activity data () show that the 137Cs activity levels of dust samples are similar to the existing saltmarsh surface 137Cs activity range, with the exception of one dust sample from the higher collector where a high 137Cs activity was found high (794 Bq kg−1) compared to surface activity range of the marsh sediments (). The potential reason for this high activity can be explained by observing down-core activity profiles () and the measured surface and peak activity dataset of the saltmarsh sediments (Rahman et al. Citation2013). Here, it can be seen that the value 794 Bq kg−1 falls within the activity profiles of both sides of peak activities for all six cores from the Dee estuary (). Thus, there is every possibility of having high 137Cs activities in dust samples derived either from highly active samples from other positions of Dee estuary surface saltmarsh sediments that have not been measured or from sediments that has been redistributed from depth as a result of physical erosion, e.g., from the cliff of the lower saltmarsh (Rahman Citation2010).
Figure 4. Summary figures of 137Cs (Bq kg−1), LOI (%) and mean grain size (8–9 φ = 4–2 µm, >9 φ = <2 µm) data from six long cores (20 cm) of the Dee estuary upper saltmarshes after study of Rahman (Citation2010).
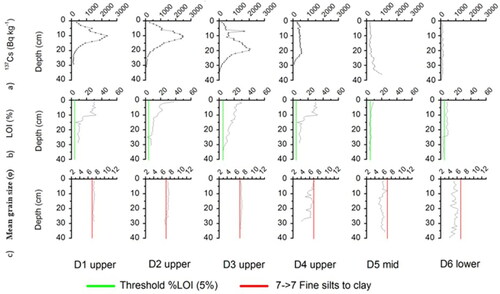
Furthermore, it can be seen from the Dee estuary saltmarsh long cores profiles () that the surface sediments are rich in organic content (ca. 30%-40%) and is apparent from the Loss on Ignition (LOI) down-core profile which reduces with core depth. Moreover, though there is no data available on 137Cs concentrations from the Dee estuary saltmarsh plants, data on vegetation from another Sellafield-contaminated UK saltmarsh conducted by Beresford et al. [Citation2007] reported high activities of 1500 ± 670 Bq kg−1 and 380 ± 116 Bq kg−1, for 137Cs and 241Am, respectively, which are significant. Hence, as dust samples in present study were up to 75% organic particles (and potentially higher), a valid the reason could be due to the uptake of more soluble highly active 137Cs radionuclides by the saltmarsh plants from the saltmarsh sediments which then decomposed after their growth period and later transformed into dust size particles. Thus, it is assumed that the 137Cs concentrations in collected dust samples in present study are saltmarsh generated and 137Cs attached to both the organic and mineral dusts are responsible for the activity concentrations.
4.3. Justification for potential saltmarsh to land transfer of 137Cs
Dry sediments from the saltmarsh surface can be lifted and suspended into air via wind erosion. It is well known that the grain movement is initiated when the wind-induced lift and shear velocity at the bed overcome the force of gravity acting on the particles. Three types of particle movement may occur during wind erosion and these are: suspension, saltation and surface creep. Out of these three movements, saltation is the most common. All movements also depend on the available grain size, and there is a certain wind threshold velocity for each grain size (Bagnold Citation1941; Greeley and Iversen Citation1985; Pye Citation1987).
The wind friction speed threshold curve for the Earth was first derived by Bagnold (Citation1941). In 1985, Greeley and Iversen presented wind threshold friction speed curves () for the particles ranging from 10 to 10,000 µm for Earth, Mars and Venus, where they showed that for Earth, the particle size of ca. 100 µm (fine sand) is most easily be moved by a wind speed of ca. 0.2 m s−1 (denoted as V in ), and as grain size reduces the wind threshold friction speed value increases. However, Greeley and Iversen’s threshold wind friction speed data (1985) were limited only to 10 µm size particles and no study has been made beyond this size so far (personal communication). Moreover, there are no specific wind friction threshold speed data for the fine particles in size range from 10 to <2 µm, i.e., for fine silts to clay size particles. However, after study of Greeley and Iversen (Citation1985), another study led by Kjelgaard et al. (Citation2004) mentioned the value of wind friction threshold speed for PM10 group particles (i.e., <10 µm, but not for a wider range of finer particles) based on field experiments from agricultural soils of Columbia Plateau. Kjelgaard et al. (Citation2004) found from their experiment that the emission of PM10 from these soils appears to occur at a threshold friction speed of 0.4 m s−1 (V) and an approximate threshold wind velocity (V2m) of 8 m s−1 at 2 m height. They also found that soil disturbance can result in reduced threshold values, ca. 0.3 at 6 m s−1 for V and V2m, respectively.
Figure 5. (a) Threshold friction speed versus particle diameter for the Earth from study of Greeley and Iverson (1985) (modified form with original curve). (b) Estimated threshold friction speed versus particle diameter for the Earth; extracted from Greeley and Iverson (1985) study, and extended, modified form reproduced in present study based on practical data of Kjelgaard et al. (Citation2004).
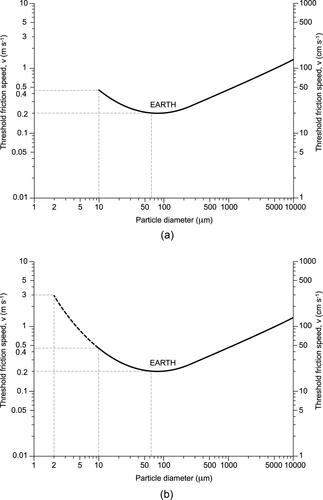
It is observed that for Earth, the wind threshold friction speed (V) for 10 µm size particles found by Greeley and Iverson (Citation1985) is also ca. 0.45 m s−1 which matches very closely with the threshold friction speed (V) for a soil particle size group of <10 µm investigated by Kjelgaard et al. [Citation2004]. Hence, the consistency of threshold friction velocities for 10 and <10 µm size particles encourages extrapolation of the threshold curve of Greeley and Iverson (Citation1985) further to 2 µm in this study for a better estimation of approximate threshold friction velocities for each individual finer grain size fractions from 10-2 µm, as shown in . Hence, from the extrapolated curve, the wind speed friction velocities for particles of 63, 31, 16, 8, 4, and 2 µm were estimated at approximately 0.2, 0.25, 0.35, 0.5, 1.0, and 3 m s−1 ().
Thus, to estimate approximate threshold windspeeds at 2 m height above the saltmarsh surface and to justify the potential eolian transfer of 137Cs attached to finer grains from the saltmarsh, wind speed data (at 10 m height) of the Hilbre weather station () were analyzed. Here we note that the wind speed follows a logarithmic profile above the bed. In this coastal location, adjacent to an aerodynamically smooth bed (sea surface, tidal flat and saltmarsh), we assume the majority of frictional reduction in wind speed is achieved close to the bed and that the wind speed data for 10 m height is an acceptable approximation for that at 2 m height. Further, that the wind speed at 10 m may exceed that at 2 m provides us with a likely maximum estimate of erosion and transport potential for dusts derived from the saltmarsh.
Table 3. Comparison of dust accumulation rate with meteorological data at 2 m height from the Hilbre weather station near the Dee estuary during dust collection periods (wind data supplied by the National Oceanography Center, Liverpool).
At first, the logarithmic decrease in wind velocity approaching the bed, i.e., the threshold friction speed (V) of finer particles (<10 µm) for the saltmarsh surface, was estimated using the values of wind threshold velocity (V2m) of 8 m s−1 at 2 m height (Kjelgaard et al. Citation2004) and a saltmarsh surface roughness value (z0) of 0.0002 m (Kitwiroon et al. Citation2002) in the well-known Prandtl-von Karman logarithmic wind profile equation (Priestly, 1959):
where VZ is the wind speed at height z, V is the wind threshold friction speed, k is Karman’s constant (0.4) and z0 is the surface roughness length.
The estimated threshold wind friction speed (V) for saltmarsh surface was found to be 0.35 m s−1, and is in good agreement with the estimated shear wind speeds (V) for 10-< 10 µm diameter particles of Greeley and Iverson (Citation1985) and Kjelgaard et al. (Citation2004). This agreement further justifies the use of estimated wind friction speeds, V, of finer particles (63-< 2 µm) for an approximation of threshold wind speeds, VZ, for these particles at 2 m height. The estimated values of VZ for 63, 31, 16, 8, 4, and 2 µm size particles were found to be 5, 6, 8, 12, 23, and 69 m s−1, respectively.
The wind speed data from Hilbre reveal that for the whole dust collection period the wind speed varied from 0 to 22 m s−1, with a mean wind speed variation of 5–8 m s−1. The wind gust values ranged from 0 to 28 m s−1 with the mean wind gust variation of 7 to 10 m s−1 (). Thus, comparison of the wind speed data from Hilbre with estimated threshold wind speeds for finer particles confirm that the wind over Parkgate saltmarsh during the whole dust collection period were high enough to entrain fine 63–4 µm (i.e., coarse to fine silts) particles but not clay particles. If this is the case, then it can be assumed that the available 137Cs activities present within the dust samples in this study were generated from contaminated Parkgate saltmarshes and associated mainly with silt size particles. The presence of clay size particles within the dust samples indicates that there may be another source of the finest dusts, e.g., atmospheric dust, the nearby road side and inland areas or, indeed, the MnO2 precipitate from the analysis. However, we cannot exclude the likely transfer of agglomerated clay particles, which act aerodynamically as coarser (compound) grains and then break down during the laboratory analyses. Furthermore, there is also potential for clay particles to be transferred from the saltmarsh surface via saltation or reptation (ballistic impact) processes. Without data for further examination of this, our interpretation centers on the transport of ‘solitary’ grains via suspension or intermittent suspension
show the mean and maximum wind speed, wind gusts and total mass of dust per day data from both dust collectors for six the collection periods. Whilst we generally observe higher 137Cs activities in the winter season samples () this is not accompanied by a higher sediment accumulation or a substantial difference in the wind field characteristics. Further, there is no consistent trend in the recorded grain size distributions (), which is consistent with no overall change in the prevailing wind field. Without clear evidence of causation, we speculate that the 137Cs loading is higher during winter when the saltmarsh is in a phase of annual deterioration, i.e., a higher source availability rather than a higher net flux of particles. The non-linear sampling period along with the summative nature of the sampling (covering extended periods of time of variable wind speed and weather) limits further examination of this phenomenon.
5. Conclusion
Detailed examination of radionuclide and grain size data from dust samples in this study reveals that as majority of the dust is organic (ca. 75%) then it is likely that the dust does not come only directly from the saltmarsh surface but largely from the decomposition of plants growing on the saltmarsh. Consequently, it is likely that more organic dust particles originated from plants (rich in 137Cs, but poor in 241Am) during summer and autumn at the end at the main plant growth period, which can also be observed from the mass flux data. Also detailed analyses of activity concentration data of 137Cs from the saltmarsh surface, down core sediment (historic peak activity data) and dust samples reveal that there is a potential for the eolian transport of radioactive dust particles inland from nearby contaminated saltmarshes, and that the estimated wind threshold velocities (5–23 m s−1) for finer particles (63–4 µm, except <4 µm) and available mean and maximum wind speed data range of 5–28 m s −1 over the Dee estuary saltmarsh surface (at 2 m height) shows that it is possible to liberate saltmarsh-derived radioactive dust. Radiological risk analysis reveals that although the maximum value of 41 µSv y−1 for the total annual outdoor effective dose for minimum occupancy falls below the world average value (70 µSv y−1) the maximum value of 95 µSv y−1 for the total annual outdoor effective dose for maximum occupancy is 36% higher than the world average value. Hence, the health risk posed to coastal populations by 137Cs present in saltmarsh-derived airborne dusts is non-negligible.
Acknowledgments
The present research work was funded by Overseas Research Scholarship and University of Liverpool International Scholarship. The authors would like to thank Paul Nolan, Barbara Mauz and Peter Appleby for their advisory input during the research works. Special thanks to John Boyle for allowing us to deploy dust collectors in the front yard of his residence next to the Dee estuary upper saltmarsh.
Declaration of interests
The authors declare that they have no known competing financial interests or personal relationships that could have appeared to influence the work reported in this article.
References
- Appleby, P. G. 1997. Sediment records of fallout radionuclides and their application to studies of sediment-water interactions. Water. Air. Soil Pollut. 99 (1-4):573–85. doi:10.1007/BF02406896.
- Appleby, P. G., E. Y. Haworth, H. Michel, D. B. Short, G. Laptev, and G. T. Piliposian. 2003. The transport and mass balance of fallout radionuclides in Blelham Tarn, Cumbria (UK). J. Paleolimnology 29 (4):459–73. doi:10.1023/A:1024437426878.
- Appleby, P. G., N. Richardson, and P. J. Nolan. 1992. Self-absorption corrections for well-type germanium detectors. Nucl. Instrum. Methods Phys. Res. Sect. B. 71 (2):228–33. doi:10.1016/0168-583X(92)95328-O.
- Aston, S. R., D. J. Assinder, D. A. Stanners, and J. E. Rae. 1981. Plutonium occurrence and phase distribution in sediments of the Wyre Estuary North-west England. Marin. Poll. Bull. 12 (9):308–14. doi:10.1016/0025-326X(81)90082-5.
- Aston, S. R., and D. A. Stanners. 1982. The transport to and deposition of americium in intertidal sediments of the Ravenglass estuary and its relationship to plutonium. Env. Poll. (Series B) 3 (1):1–9. doi:10.1016/0143-148X(82)90038-6.
- Bagnold, R. A. 1941. The physics of blown sand and desert dunes. London: Methuen.
- BEIS. 2018. Scope of and Exemptions from the Radioactive Substances legislation in England, Wales and Northern Ireland. Department for Business, Energy and Industrial Strategy, UK Govt. https://assets.publishing.service.gov.uk/government/uploads/system/uploads/attachmentdata/file/731733/RSL_Guidance_update_BEIS_format_v5_180803.pdf
- Bonnett, P. J. P., P. G. Appleby, and F. Oldfield. 1988. Radionuclides in coastal and estuarine sediments from Wirral and Lancashire. Sci. Tot. Environ. 70:215–36. doi:10.1016/0048-9697(88)90261-6.
- Bonnett, P. J. P., G. J. L. Leeks, and R. S. Cambray. 1989. Transport processes for Chernobyl labeled sediments: Preliminary evidence from upland mid-Wales. Land Degrad. Dev. 1 (1):39–50. doi:10.1002/ldr.3400010105.
- Beresford N. A. B. J. Howard, R. W. Mayes, and C. S. Lamb. 2007. The transfer of radionuclides from saltmarsh vegetation to sheep tissues and milk. J. Environ. Radioact. 98 (1-2):36–49. doi:10.1016/j.jenvrad.2006.10.003.
- Chandler, T. J., and S. Gregory. 1976. The climate of the British Isles, 390. London: Longman.
- Charlesworth, M. E., M. Service, and C. E. Gibson. 2006. The distribution and transport of Sellafield derived 137Cs and 241Am to western Irish Sea sediments. Sci. Tot. Environ. 3541:83–92. doi:10.1016/j.scitotenv.2004.12.062.
- Clark, M. J., and P. B. Smith. 1988. Wet and dry deposition of Chernobyl releases. Nature 332 (6161):245–9. doi:10.1038/332245a0.
- Clifton, J. 1998. Relationship between radionuclide activity and sediment composition in Eastern Irish Sea intertidal sediments. PhD thes., University of Liverpool, Liverpool. 98.
- Clifton, J., P. McDonald, A. Plater, and F. Oldfield. 1997. Relationships between radionuclide content and textural properties in Irish Sea intertidal sediments. Water. Air. Soil Pollut. 99 (1-4):209–16. doi:10.1007/BF02406860.
- Comans, R. N. J., J. J. Middelburg, J. Zonderhuis, J. R. W. Woittiez, G. J. D. Lange, H. A. Das, and C. H. V. D. Weijden. 1989. Mobilization of radiocesium in pore water of lake sediments. Nature 339 (6223):367–9. doi:10.1038/339367a0.
- Davidson, N. C. 1996. Coasts and seas of the United Kingdom, Region 13 Northern Irish Sea: Colwyn Bay to Stranraer, including the Isle of Man, Joint Nature Conservation Committee (Coastal Directories Series), ed. J. H. Barne, C. F. Robson, S. S. Kaznowska, J. P. Doody, and N. C. Davidson, Chapter 4.1, 69–72. Peterborough: Estuaries.
- Duursma, E. K. 1972. Geochemical aspects and applications of radionuclides in the sea. In Ocean marine biology: An annual review, ed. H. Barnes, vol. 10, 137–223.
- Evans, W. D., J. J. Alberts, and R. A. Clark. 1983. Reversible ion exchange fixation of 137Cs to leading mobilization from reservoir sediments. Geochim. Cosmochim. Acta 47 (6):1041–9. doi:10.1016/0016-7037(83)90234-X.
- Elliott, A. J. 2004. A probabilistic description of the wind over Liverpool Bay with application to oil spill simulations. Estuarine Coastal Shelf Sci. 61 (4):569–81. doi:10.1016/j.ecss.2004.06.022.
- EGE. 1994. Environmental consequences of the Chernobyl accident and their remediation: Twenty years of experience. Report of the UN Chernobyl Forum Expert Group ‘Environment’, Working Material.
- Frindlington, M. A., P. McDonald, J. E. Rae, and J. R. L. Allen. 1995. Elucidation Twenty of saltmarsh dynamics using historical radionuclide deposits. Proceedings 10th International Conference Heavy Metals in the Environment, CEP Consultants, Edinburgh, 18–22.
- Golmakani, S., M. V. Moghaddam, and T. Hosseini. 2008. Factors affecting the transfer of radionuclides from the environment to plants. Radi. Prot. Dosim. 130 (3):368–75. doi:10.1093/rpd/ncn063.
- Greeley, R., and J. Iversen. 1985. Wind as a geological process on Earth, Mars, Venus and Titan. New York: Cambridge Planetary Science Series, Cambridge University Press.
- Horrill, A. D., T. Dent, N. A. Beresford, and D. Singleton. 1992. Monitoring radionuclides in tidally inundated pastures. MAFF Report 2142. Institute of Terrestrial Ecology, Cumbria.
- HPA. 2010. Department of the Environment. Expert Panel on Air Quality Standards 6th Report. Particles. HMSO 1995; crown copyright © Health Protection Agency 2010.
- Huckle, J. M., R. H. Marrs, and J. A. Potter. 2004. Spatial and temporal changes in saltmarsh distribution in the Dee estuary, NW England, determined from aerial photographs. Wetlands Ecol. Manage. 12 (5):483–98. doi:10.1007/s11273-005-5166-z.
- Hutchinson, S. M. 1994. Distribution of 137Cs in saltmarsh sediments in the Dee estuary, NW England. Marin. Poll. Bull. 28 (4):262–5.
- Hutchinson, S. M., and D. Prandle. 1994. Siltation in the saltmarsh of the Dee estuary derived from 137Cs analysis of shallow cores. Estua. Coast. Shelf Sci. 38 (5):471–8. doi:10.1006/ecss.1994.1032.
- Kjelgaard, J., B. Sharratt, I. Sundram, B. Lamb, C. Claiborn, K. Saxton, and D. Chandler. 2004. PM10 emission from agricultural soils on the Columbia Plateau: Comparison of dynamic and time integrated field-scale measurements and entrainment mechanisms. Agricult. Forest Meteo 125 (3-4):259–77. doi:10.1016/j.agrformet.2004.04.004.
- Kitwiroon, N., R. S. Sokhi, L. Luhana, and R. M. Teeuw. 2002. Improvements in air quality modeling by using surface boundary layer parameters derived from satellite land cover data. Water Air & Soil Poll., Focus 2: 29–41.
- Mackenzie, A. B., G. T. Cook, P. McDonald, and S. R. Jones. 1998. The influence of mixing timescales and re-dissolution processes on the distribution of radionuclides in northeast Irish Sea sediments. J. Environ. Radio 39 (1):35–53. doi:10.1016/S0265-931X(97)00044-1.
- MacKenzie, A. B., and R. D. Scott. 1993. Sellafield waste radionuclides in Irish Sea intertidal and salt marsh sediments. Environ. Geochem. Health. 15 (2-3):173–84. doi:10.1007/BF02627835.
- Maekawa, K. 2002. Overview of medical care for highly exposed victims. In The medical basis for radiation-accident preparedness: the clinical care of victims. Proceedings: fourth international REAC/TS conference on the medical basis for radiation-accident preparedness, March 2001, Orlando, FL, ed. R. C. Ricks, M. E. Berger, and F. M. O’Hare, Jr., 313–318.
- Marker, M. E. 1967. The Dee estuary: its progressive silting and salt marsh development. Trans. Inst. Br. Geogr. 41 (41):65–71. doi:10.2307/621327.
- McDonald, P., G. T. Cook, M. S. Baxter, and J. C. Thomson. 1990. Radionuclide transfer from Sellafield to south west Scotland. J. Environ. Radioa. 12 (3):285–98. doi:10.1016/0265-931X(90)90027-S.
- McKay, W. A., and N. J. Pattenden. 1990. The transfer of radionuclides from sea to land via the air. A review. J. Environ. Radioa. 12 (1):49–77. doi:10.1016/0265-931X(90)90035-T.
- Mitchell, L. 2010. Monitoring of radioactivity in air and rainwater in the UK, Annual results report, Department of Energy and Climate Change, HPA/MR/4/6661, 2010
- Moore, R. D., J. Wolf, A. J. Souza, and S. S. Flint. 2009. Morphological evolution of the Dee estuary, eastern Irish Sea, UK: A tidal asymmetry approach. Geomorph 103 (4):588–96. doi:10.1016/j.geomorph.2008.08.003.
- Oldfield, F., N. Richardson, P. G. Appleby, and L. Yu. 1993. 241Am and 137Cs activity in fine grained saltmarsh sediments from parts of the N.E. Irish Sea Shoreline. J. Environ. Radioa. 19 (1):1–24. doi:10.1016/0265-931X(93)90055-C.
- Peirson, D. H., and L. Salmon. 1959. Gamma radiation from deposited fallout. Nature 184 (4700):1678–9. doi:10.1038/1841678a0.
- Poirier, E. 2014. Seasonal influences on the ecomorphodynamics of a hypertidal saltmarsh and tidal creek system. MSc thesis; Saint Mary’s University, Halifax, Nova Scotia, © Emma Poirier.
- Pye, K. 1987. Aeolian dust and dust deposits, 334. London: Academic Press.
- Rahman, R. 2010. Radioactive pollution and potential redistribution, exposure and health risks from Sellafield-contaminated saltmarshes in north-west England. PhD thes., UK University of Liverpool, Liverpool, UK.
- Rahman, R., and A. J. Plater. 2014. Particle-size evidence of estuary evolution: A rapid and diagnostic tool for determining the nature of recent saltmarsh accretion. Geomorph 213:139–52. doi:10.1016/j.geomorph.2014.01.004.
- Rahman, R., A. J. Plater, P. J. Nolan, B. Mauz, and P. G. Appleby. 2013. Potential health risks from radioactive contamination of saltmarshes in NW England. J. Environ. Radioact. 119:55–62. doi:10.1016/j.jenvrad.2011.11.011.
- Short, D. B. 1999. Quantitative models of Lake sediments and atmospheric fluxes. PhD thes., University of Liverpool, Liverpool, UK, 98.
- Smith, F. B., and M. J. Clark. 1989. In: The Transport and Deposition of Airborne debris from the Chernobyl Nuclear Power Accident, HMSO, London Meteorological Office Scientific Paper No. 42.
- Sow, M., D. Goossens, and J. L. Rajot. 2006. Calibration of the MDCO dust collector and of four versions of the inverted Frisbee dust deposition sampler. Geomor 82 (3-4):360–75. doi:10.1016/j.geomorph.2006.05.013.
- UNSCEAR. 2000. Sources and effects of ionizing radiation, 453. New York: United Nations.