
 ?Mathematical formulae have been encoded as MathML and are displayed in this HTML version using MathJax in order to improve their display. Uncheck the box to turn MathJax off. This feature requires Javascript. Click on a formula to zoom.
Abstract
COVID-19 is transmitted, at least in part, by airborne particles emitted by infected individuals. Wearing masks is one of the key actions that are required to prevent spreading COVID-19. To understand the variability in the performance, we evaluated the material performance of the whole mask, as manufactured, in terms of the penetration of particles, comfort and the quality factor of multiple copies of 29 different types. All masks were mounted to prevent leakage around the edges so the mask material and manufacture was tested, but the effects of the fit were not considered. The results of this study thus represent the upper bound of the performance of facemasks since leakage around the edges due to poor fit often overwhelms filtration through the mask material. The tests were performed at a steady flow rate of 30 L/min; mean values of the performance parameters were calculated for two different sizes; 0.12 µm and 0.3 µm. Of the masks tested, for 0.12 µm particles, N95 face filtering respirators consistently had the lowest peak penetration 1.7 ± 0.5%, while KN95 masks allowed 3.7 ± 2.6% penetration. In contrast, penetration through pleated procedure masks was 14.7 ± 16.9% due to one outlier - with that outlier removed, penetration decreased to 7.1 ± 4.3%; cloth masks allowed 26.4 ± 9.3% penetration. Tests on multiple copies of different masks demonstrated consistent performance of N95s, but considerably greater variability within the other classes of masks tested, leading to uncertainty in the degree of protection that they would provide.
Copyright © 2021 American Association for Aerosol Research
EDITOR:
1. Introduction
Early in the COVID-19 pandemic, observations that proximity enhanced disease transmission were taken as evidence that the hypothesis of Wells (Citation1934) that droplets that are large enough to settle to the ground quickly dominate respiratory disease transmission, with smaller aerosol particles playing a minor role at most. Assuming that to be true, cloth masks would provide adequate protection for the general public against inhalation of such large particles, allowing N95 filtering facepiece respirators (FFRs) to be preserved for medical professionals, first responders, and others who face the highest risk of exposure to COVID-19. Transmission of the SARS-CoV-2 virus by infected persons who are either asymptomatic or pre-symptomatic (Zhou et al. Citation2021; Ma et al. Citation2020), direct measurements of airborne infectious virus well beyond the recommended 2 m social distancing requirements (Y. Liu, Mendonça, et al. Citation2020; Lednicky et al. Citation2020), observations of viral RNA in micrometer and submicrometer particles in exhaled breath of humans (Zhou et al. Citation2021), and live SARS-CoV-2 virus in exhaled breath of nonhuman primates (Edwards et al. Citation2021), among other evidence, now strongly suggest that smaller particles may contribute substantially to disease COVID-19 transmission (Tellier et al. Citation2019; Morawska and Cao Citation2020; Santarpia et al. Citation2020; Guo et al. Citation2020).
Masks and respirators afford varying degrees of protection to the person wearing them. Those worn by infected individuals further protect the community from the exhaled virus. The degree of protection depends upon the material (filter medium), the design and construction of the mask, manufacture, and fit of the mask (how well it seals to the face), as well as the nature of the particles that carry the virus, the respiration rate, and other factors. A number of studies have reported the efficacy of different materials used in masks, which applies to both inhalation and emission in exhaled breath. However, differences in flow rates, particle size, and the nature of the sample, whether a sample of material of a specific exposed area or a whole mask, make the results from different studies difficult to compare (SI; Konda et al. Citation2020; Zhao et al. Citation2020; Liao et al. Citation2020; Grinshpun et al. Citation2009; Bałazy et al. Citation2006; Eninger et al. Citation2008; He et al. Citation2013; Pan et al. Citation2021; Ardon-Dryer et al. Citation2021), which are summarized, together with the respective flow rates, in the online supplementary information (SI; Tables S4 and S5).
Recommendations to use and general acceptance of cloth masks represent an implicit assumption that the focus of protection should be on relatively large particles, though many of the studies reported have employed measurement methods that focus on submicron particles (Konda et al. Citation2020; Pan et al. Citation2021). Whether this bias is appropriate depends upon the origins of the virus-laden particles that become airborne (Tang et al. Citation2021), as we briefly discuss below.
A substantial body of evidence supports an emphasis on small particles as an important contributor to airborne transmission of respirable diseases, though data on the 0.08–0.12 μm diameter SARA-CoV-2 virus are sparse. Data on other, comparably sized respiratory viruses also suggest small particles are important. In measurements of Influenza A virus emitted by infected individuals, 70% of the virus in exhaled breath was found in the smallest size fraction measured, 0.3–0.5 μm particles. Counts of particles >5 μm were much lower (Fabian et al. Citation2008). A later study of human-rhinovirus-infected subjects found that 25% of the subjects emitted 81% of the virus-laden particles, 82% of which were in the 0.3–0.5 μm size range. Virus-containing particles as large as 10 μm were detected, but at more than two orders of magnitude lower concentrations (Fabian et al. Citation2011). In each of these studies, the instrument employed set the minimum size detected. The SARS-CoV-2 virus is in diameter comparable in size to influenza A (0.08–0.12 μm) (C. Liu, Mendonça, et al. Citation2020; Noda Citation2011). A recent study of particle exhalation from both healthy human and COVID-19 infected nonhuman primate subjects consistently showed the highest particle concentrations in the smallest exhaled breath particles measured, 0.3–0.5 μm, with particle concentrations for particles in the 0.5–1.0 μm range being at least an order of magnitude lower (Edwards et al. Citation2021). We have, therefore, focused this study on 0.12 μm and 0.3 μm particles, sizes that are consistent with the generation of potentially virus-laden particles in the deep airways and asymptomatic transmission, and ones that pose the greatest challenge providing both personal and community protection.
Furthermore, the relative performance of the mask material at these two sizes provides insights into the physics of particles since filtration of particles from gases involves several mechanisms, i.e., impaction, interception, Brownian diffusion, and electrostatic interaction. Due to their inertia, large particles cannot follow the gas flow around small fibers and impact onto fibers. This mechanism is enhanced for particles whose sizes are comparable to the fiber diameter, since particles whose centers pass close to the fibers contact the fiber surface in a process called interception. Small particles reach surfaces by Brownian motion, which may also be enhanced by interception. Fewer intermediate size particles are collected than either large or small ones. For uncharged filter media, the most penetrating particle size (MPPS) is typically a few tenths of a micrometer. One can increase the collection efficiency of the filter medium by increasing the thickness of the filter, e.g., adding layers, but this comes at the cost of increased pressure drop. N95 FFRs and some other high-efficiency masks achieve high filtration efficiency while maintaining low-pressure drop by embedding charge in the fibers. The resulting electrostatic forces enhance the collection of charged particles. Furthermore, induced dipoles in neutral particles cause them to migrate toward the fibers. Once that bound charge is lost by washing or neutralized by deposition of oppositely charged particles, the filtration efficiency of such electret filter media decreases, and the MPPS shifts from ∼ 0.075 μm to the larger sizes typical of uncharged filters (Huang et al. Citation2013; Bałazy et al. Citation2006; Eshbaugh et al. Citation2009).
In order to understand the degree of protection that masks and respirators provide to the individuals who wear them and to the community, quantitative data are needed on mask performance. N95 FFRs clearly demonstrate that very effective masks can be designed, and that, with proper training, masks can be effectively sealed to the face; an efficient filter medium that does not allow infectious particles to penetrate through it is essential. N95 FFRs accomplish this with a multilayered structure that includes non-woven filter medium. The American Society for Testing and Material (ASTM) provides standards for medical masks require a comparably efficient filter material, but many pleated, medical-style masks are not ASTM certified, and may, or may not contain quality filtration media. Though pleated masks tend to leak around the edges, external supports, or minor modifications to them may be able to seal them to the face to improve the degree of protection (Clapp et al. Citation2021).
Different masks and respirators are designed and manufactured to meet different standards, e.g., the National Institute for Occupational Safety and Health (NIOSH) standards for N95 FFRs, ASTM standards for US medical masks (ASTM F2101-19), and for cloth masks (barrier face covering ASTM FF3502-21); similar standards are imposed by agencies in other countries around the world (Rengasamy, Eimer, and Shaffer Citation2009). Each of these standards specifies air flow rates at which masks are to be tested, based mainly on the minute ventilation and peak inspiratory flow rates data derived by Silverman et al. (Citation1943). The minute ventilation rate is the total volume of air inhaled (or exhaled), typically measured over many breaths, divided by the total time over which those breaths were taken (not just the inhalation or exhalation time). Roughly half of that total time is required to inhale that volume, the subject is exhaling during most of the remaining time. Thus, the actual volumetric flow rate through the filter medium is at least double the minute ventilation rate, and peak flow rates are even higher.
Consistency of mask and respirator performance has received relatively little attention. While it is impossible to evaluate the performance of the myriad masks that are being used to constrain the spread of COVID-19, the present study examines the material and manufacturing performance and resistance to breathing of representative examples of key classes, including N95 and KN95 FFRs (designated N and K, respectively, in the discussion that follows), procedure masks (P), and woven cloth masks (C). Twenty-nine different types of masks (145 masks in total) were tested, with several copies of each mask type, and multiple batches of a few masks to assess batch-to-batch variability. Both reduction of risk (reduced fractional penetration through the mask) and difficulty in breathing (pressure drop) are reported for a flow rate (30 L/min) corresponding to the peak inspiratory flow rates during resting to light work load based on the ICRP lung deposition model (Hinds Citation1999; ICRP Citation1994), and comparable to flow rates that have been reported in the literature (Konda et al. Citation2020; Zhao et al. Citation2020; Liao et al. Citation2020; Bałazy et al. Citation2006; Eninger et al. Citation2008; Anderson et al. Citation2006; Ardon-Dryer et al. Citation2021). The data from this study illustrate the range of potential mask protection, and the comfort of masks presently on the market, including the variability for the different classes of the mask, and for multiple copies of specific masks, and demonstrate a need for better quality control in mask manufacture. The results further reveal the particle-size dependence of penetration through the masks, providing insights into the physical mechanisms of particle removal in different masks.
2. Materials and methods
2.1. Approach
The penetration of particles through a filter medium is measured by passing a known flow of an aerosol with known properties through the filter and measuring the concentration of particles upstream and downstream of the filter. The penetration is defined as the ratio of the downstream to upstream particle concentrations.(1)
(1)
For a filter medium that is thick compared to the size (diameter) of its fibers, and when the filter medium is securely mounted so that no gas leaks around its edges,(2)
(2) where γ is the particle penetration probability per unit of filter thickness, t. In addition to capturing particles, the fibers that comprise a mask exert a drag force on the flow through it, leading to a pressure drop ΔP that is proportional to the filter medium thickness, and also increases with the velocity of the air through the filter (usually expressed in terms of a superficial velocity which is that of the air flow at the surface of the mask), and the volume fraction of solid fibers within the filter.
(3)
(3)
For a single filter type, i.e., one layer of a mask that consists of a dense mat of fine fibers, and at the relatively low velocities of breathing, ΔP α t, the thickness of the filter medium. The tradeoff between filtration efficiency and pressure drop is often reported as a so-called quality factor (Hinds Citation1999)(4)
(4) which has been applied to masks as well as air-cleaning and industrial filters. This form for Qf arises naturally in this form from filtration theory in which the penetration, even though some recent papers have replaced the ln with log10 (Zhao et al. Citation2020). We shall use the original and natural definition, with the pressure drop in SI units (kPa). It should be noted that the Qf places a much higher emphasis on pressure drop than particle penetration through the filter medium. According to the WHO, non-medical masks with Qf > 3 kPa−1 are considered acceptable for the general public (World Health Organization Citation2020), suggesting that Qf is a figure of merit for masks.
Mask performance is, therefore, characterized by three key measures, particle penetration, pressure drop through the filter medium, and mask fit; this study characterizes the first two measures. The many reports on filtration performance of masks and mask materials report a number of types of measurements: (i) material efficiency measurements in which a sample of material is installed in a holder that exposes a specified area of the filter medium to an aerosol flow rate to achieve a particular face velocity; (ii) mask efficiency measurements in which the mask is sealed to a flange to measure transmission through the full mask as in the NIOSH and ASTM certification tests; (iii) mask protection assessments in which the mask is fitted to a mannequin head (or in some cases is worn by a person), with particle concentrations being measured upstream and downstream of the mask. This study examined different masks, including some with similar materials but different designs, in order to compare the different masks.
Because particle penetration in the size regime near the MPPS provides insight into the filter properties, and mask shape affects the flow rate through a unit area of the mask, we adapt the NIOSH protocol for N95 FFR certification to meet our research objectives, but with modifications that are noted below. Thus, in this study, we focused on the material performance (type ii) measurements of the whole mask, as manufactured; the effects of fit and leaks around the edges of the mask are not considered.
Designed to certify masks for occupational protection, the NIOSH protocol specifies air flows characteristic of respiration rates during moderate physical labor (85 L/min). We have selected a more modest flow rate typical during light exercise, 30 L/min. The dry salt (typically NaCl) aerosol specified in the NIOSH protocol is designed to probe the MPPS typical of N95s, with a peak in the particle number size distribution of particles of 0.075 μm ± 0.020 μm, and with a geometric standard deviation σg < 1.86.
The aerosol must be electrically neutralized to provide a valid test of the respiratory protection provided by a mask since aerosols produced by spraying a solution tend to be highly charged; this is achieved by exposure to an ambipolar ion cloud that is usually produced by exposing the aerosol to ionizing radiation from radioactive decay or soft x-rays. A neutralized aerosol is neutral only on average; under typical ambient conditions for particles below about 0.3 μm in size, most particles are uncharged, the remainder carry small numbers of charges of either polarity (López-Yglesias and Flagan Citation2013; Hoppel and Frick Citation1986; Fuchs Citation1963) fewer than half of the particles larger than that size are uncharged, but the aerosol is, on average, neutral. The charge-state of the aerosol dramatically affects particle deposition within electret filters, and for some other filter materials.
The NIOSH protocols further specify that the particles used to challenge the masks be measured using a photometer that determines a surrogate for the mass concentration of the specified aerosol, thereby producing a single measure of the efficiency with which particles are captured by, or transmitted through the filter medium of the mask. As discussed above, particle penetration through a high-quality mask varies dramatically with particle size; that variation is a function of the properties of the material so measurements of the penetration efficiency with size for different masks can provide insights into the factors that govern their performance. Therefore, we assessed the material performance as a function of particle size over the size range 0.03–0.8 μm, typical of the challenge aerosols used in the NIOSH certification tests, to provide additional information such as mechanisms of particle penetration, causes of excessive penetration such as leaks inherent in woven fabrics, or loss of retained charges in electret filters. Finally, the NIOSH protocol also constraints the acceptable pressure drop through the mask to 343 Pa (35 mm H2O) during inhalation and 245 Pa (25 mm H2O) during exhalation, both at a constant flow rate of 85 L/min. In order to allow direct comparison of the performance of different masks, we employed the same testing protocol on all masks.
Another focus of this article is the variability from mask-to-mask within a single mask type. Therefore, we have made measurements on multiple copies of each type of mask tested (n = 5), and report the coefficient of variation, CV, for the measured parameters. CV is defined as the ratio of the standard deviation, σ, to the mean, μ, of a sample (Lovie Citation2005; Bałazy et al. Citation2006), i.e.,(5)
(5)
The higher the value of CV the higher the level of variability around the mean. The lower the value of CV the more consistent performance.
2.2. Experimental setup
This article focused on particle penetration and pressure drop through commercially available masks and respirators, so, as in the NIOSH protocol, we tested the entire mask using the experimental system shown in . A polydisperse aerosol was generated by atomizing a dilute solution (1% w/v) of NaCl with a constant-flowrate nebulizer (B. Y. H. Liu and Lee Citation1975). The aerosol was dried by passing the flow through a NafionTM membrane diffusion drier. The aerosol then flowed through a soft x-ray charge conditioner to bring it to a known, steady-state charge distribution in which most submicron particles carry at most one elementary charge. The aerosol flow was then diluted with particle-free air to attain the required flow rate and particle concentration; the entire flow was introduced into a 21 L aluminum chamber through a copper tube penetrating through the acrylic base of the chamber. Separate probes that sampled air in the chamber and behind the mask were connected to feed-throughs in the base of the chamber to measure the aerosol concentration and pressure independently, both upstream and downstream of the mask samples. The masks were sealed to an aluminum substrate within the chamber by clamping with custom-made plates with central cutouts that ensured good compression of the mask’s edge to an underlying gasket. Because the pressure drop through the mask would cause the pleated, procedure masks to collapse onto the flat substrate, only leaving the small sample port open to flow, a wireframe was placed under any masks lacking sufficient structure to maintain their shape during the experiments. Thus, the measurements on these masks represents an optimistic, best case scenario for their performance, similar to that obtained in defined-area tests of the mask material, but including possible defects introduced during mask manufacture.
Figure 1. Schematic of the mask test apparatus showing the aerosol source, conditioning system, the chamber, the fixture apparatus for filter medium evaluation, and associated instruments and controls.
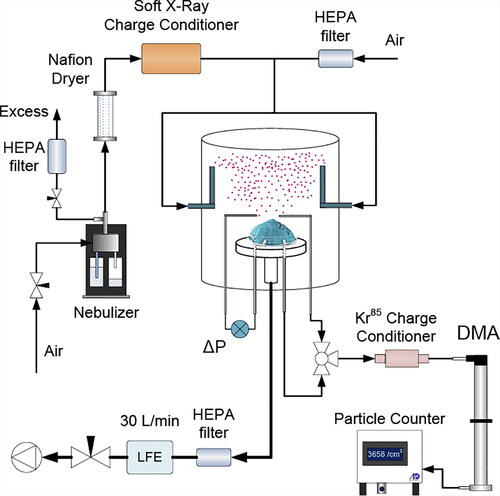
The performance of mask samples was characterized with a Scanning Electrical Mobility Spectrometer (SEMS) (Wang and Flagan Citation1990) (also known as the scanning mobility particle sizer, SMPS), consisting of a Kr85 charge conditioner, a TSI 3081 Long-column Differential Mobility Analyzer (DMA), and a "MAGIC" model 200/210 water-based Condensation Particle Counter (CPC) from Aerosol Dynamics Inc. (Hering, Spielman, and Lewis Citation2014; Hering et al. Citation2019). The DMA extracts charged particles that migrate within a narrow range of velocities from the charge-conditioned, polydisperse, dry, NaCl aerosol. The SEMS scans the DMA through size-space continuously, while the CPC counts the classified particles into time bins (Flagan Citation2008). Fast scans can distort the measurements due to the finite time-response of the CPC, so we employed a sufficiently slow scan (4.5 min) to ensure that the constant-voltage calibration of the instrument applies (Collins, Flagan, and Seinfeld Citation2002). The SEMS employed 0.3 L/min aerosol and 2.8 L/min sheath flows to provide particle size distribution measurements over the 0.03–0.8 μm range. A 3-way valve was employed to probe the aerosol upstream and downstream of the mask samples. Sampling tubes were kept as short as possible to minimize particle losses. Measurements made with no mask present verified consistent counting efficiency between the two sample paths. The upstream particle number concentration was maintained within 7000–9000 cm−3 to provide good counting statistics and minimize coincidence errors in the CPC. The pressure drop through the masks was measured with a Dwyer Model 607-4 differential pressure transducer. After a mask was installed on the substrate, and the chamber was sealed, aerosol was passed through the chamber until the concentration in the chamber reached steady-state, which required about 25–30 min. The measurement protocol consisted of making 3 size distribution measurements upstream of the mask, followed by 3 downstream measurements, and an additional 3 upstream measurements to verify that the aerosol had not changed. A LabViewTM data acquisition system controlled the measurements and recorded all data. Size distributions were extracted from those data using locally developed software that has been extensively validated. The performance parameters for masks, p, ΔP and Qf were calculated from the inverted size distribution and pressure data using EquationEquations (1)(1)
(1) , Equation(3)
(3)
(3) , and Equation(4)
(4)
(4) , respectively. However, since particle penetration varies with particle size, we report performance at two different sizes (i) 0.12 μm, which is the upper limit of the size of SARS-CoV-2 (C. Liu, Mendonça, et al. Citation2020) and close to the most penetrating particle size of electret filters; and (ii) 0.3 μm, near the most penetrating particle size for many non-electret masks (Tcharkhtchi et al. Citation2021) and corresponds to the predicted minimum total deposition for nose breathing based on the ICRP lung deposition model (Hinds Citation1999).
2.3. Masks evaluated
We have tested the performance of 29 different types (brands and models) of masks. These masks are grouped into four classes: (N) NIOSH-certified N95 FFRs, (K) KN95 masks, (P) 3-ply, pleated, disposable, procedure masks, and (C) cloth masks. Among those NIOSH-certified N95 FFRs, 3 models were obtained directly from the manufacturer; additional copies of one of those mask models were obtained from an independent vendor. The other masks were commercially available from different manufacturers and distributors. The specification of each mask is provided in Table S1 in the SI. To evaluate the variability of performance, we tested five copies of each mask.
3. Results and discussion
3.1. Size-resolved particle penetration
Using a polydisperse source aerosol and size-resolved penetration measurements reveal the size-dependent particle penetration through the masks. While the focus of this article is on the variability in mask performance, we begin by presenting representative examples of that size-dependent response for a few masks.
shows penetration versus particle size for five copies of each of six different masks. Figure S1 in the supporting information shows representative pressure drop and quality factor data. shows the data collected with one of the NIOSH-certified N95 FFRs. The top panel of Figure S1a shows the pressure drop variation during the scan over the entire size range. No variation in ΔP is expected since the flow through the mask is unperturbed by the scan of the DMA, and none is seen. Sample N5 shows very consistent performance, with an MPPS, Dmax pen ∼0.06–0.07 μm; the peak penetration was ∼ 2%, while the pressure drop was 21–22 Pa.
Figure 2. Particle penetration through five copies of different (a) N5 (b) C3 (c) K4 (d) K1 (e) P3 (f) P1 masks as a function of particle size.
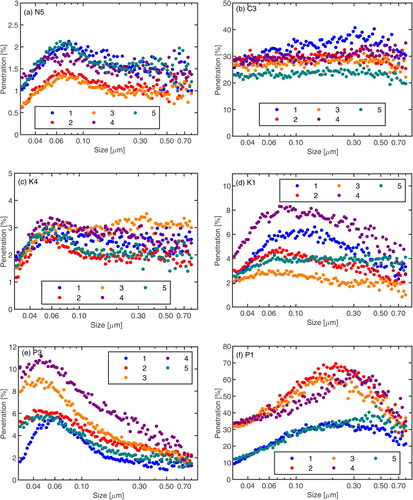
, , S1c, and S1d show the data collected with two different KN95 mask types. Sample K4 shows small variability from mask to mask, Dmax pen of 0.05-0.06 μm, and peak penetration of ∼3%, while sample K1 shows higher pressure drop, larger variability in penetration, with Dmax pen ∼ 0.08–0.1 μm. For procedure masks, , , S1e, and S1f, the pressure drops vary by a factor of 2, penetration varies by a factor of 6, and D max pen ∼ 0.05 μm for 2e, and ∼ 0.2–0.4 μm 2f. For the one cloth mask, , little size dependence is seen in particle penetration, which is midway between the best and the worst of the procedure masks uniformly across the size range. All of the masks tested show substantial variability in their performance. The quality factors determined for the different masks are all well above the minimum of 3 kPa−1 suggested by the WHO (World Health Organization Citation2020) for occupational protection; this is even true for the masks transmitting more than 60% of the masks the particles at D max pen.
3.2. Variability among masks
The penetration through all types of masks, shown in varies substantially from mask to mask, so we focused this work on that variability. To that end, we examined the performance of several copies (n = 5) of each of 29 distinct types of masks. shows the percentage of particles that penetrated through each mask versus the associated pressure drop. Data from masks with better performance, i.e., lower penetration and lower pressure drop, are seen in the lower-left corner of the figure. The NIOSH-certified N95s are tightly clustered in the low penetration, low pressure-drop regime, presumably due to the combined effects of electret filter layers and the tight quality control that is required to ensure that NIOSH standard is met. The data for the other types of masks are more scattered.
Figure 3. Penetration and the pressure drop of 29 different types of masks. NIOSH-certified N95 FFRs are shown in purple, KN95s are shown in blue, procedure masks are shown in red, and cloth masks are shown in orange. Quality factors are shown in black dotted lines and labeled in kPa−1. Note that penetration is calculated for the particle size (a) 0.12 µm, and (b) 0.3 µm, and is shown on a logarithmic scale.
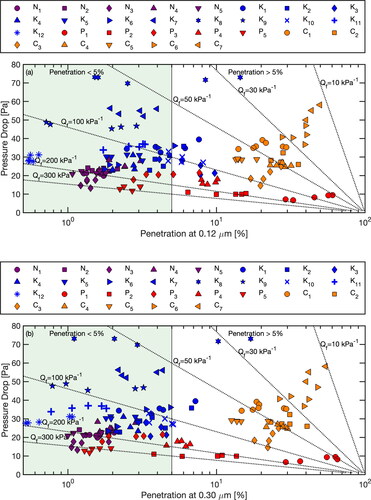
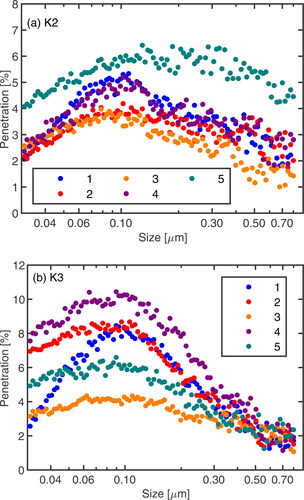
The penetration of 0.12 μm particles through the N95 FFRs was consistently low (< 3.1%) for all N95s, as was the pressure drop (< 28 Pa). KN95s showed somewhat higher and more variable penetration, though it was below 5% for most of the individual masks tested. Variability among some of the masks was large (2-fold for K3, 3- fold for K1, and 9-fold for K8). In addition, some of the KN95s (K7, K8, K9) exhibited significantly higher pressure drops than the others. Overall, the pressure drop spanned a broad range from 20 to 73 Pa. The data shown in and suggest that the filtration media in the KN95s fell into two classes of filter material: most, like K4 shown in contained an electret medium, as revealed by a MPPS of ∼ 0.05–0.06 μm, similar to the N95 shown in ; in contrast, some masks (K2, K3) with low pressure drop () had a larger MPPS of ∼ 0.1–0.2 μm, and may have compensated for the weaker, or nonexistent electret effect with a thinner filter medium, causing the low pressure drop.
Figure 4. Particle penetration through five copies of different (a) K2 (b) K3 masks as a function of particle size.
The procedure masks (none of which were marketed as appropriate for medical use) showed even greater variability in penetration, ranging from low values comparable to the N95s and the better KN95s (2.2%) to > 60%, with the former masks showing strong electret effects (MPPS ∼ 0.05 μm), while the latter ones showed no apparent charge effect (MPPS ∼ 0.2–0.4 μm). The pressure drop varied between 7 and 22 Pa. In contrast to masks and respirators formed from random mats of fibers, cloth masks show little if any variation in particle penetration with particle size () and higher particle penetration (12.6% to 54%). Pressure drops for the masks that we tested were in the range of the other types of masks (15–58 Pa), though it should be noted that the masks selected were ones that appeared to offer some degree of both protection and breathability. The mean values and the standard deviations of the penetration, pressure drop, and quality factor for each type are summarized in Table S2 in the SI.
Because of the high variability of the different types of masks, and the wide differences in performance of some of the specific masks that we tested, we examine the performance of the different masks tested in each of the four major classes, and the variability in the performance of multiple copies of each type of mask in the discussion that follows.
3.3. NIOSH-certified N95 face filtering respirators
In , we take a closer look at the mean penetration and mean pressure drop of five copies of five different NIOSH-certified N95 FFRs, together with the respective quality factors. The data for the N95 FFRs are tightly clustered, but with greater variability in penetration than in pressure drop. N3 had the lowest penetration, 1.4 ± 0.1% at 0.12 μm and 1.3 ± 0.3% at 0.3 μm, and a pressure drop of 16 ± 2 Pa. Penetration through N4, 2.3 ± 0.6% at 0.12 μm and 2.0 ± 0.5% at 0.3 μm, was the highest of the tested N95s; (ΔP = 26 ± 2 Pa). N1 and N5 were manufactured by the same company, but were purchased from different distributors. They showed very consistent performance at 0.12 μm with p = 1.5 ± 0.2% and p = 1.5 ± 0.3%, respectively, with corresponding pressure drops of 21 ± 2 Pa and 22 ± 2 Pa. The quality factors for N95s tested ranged from a high of 271 ± 38 kPa−1 to 149 ± 20 kPa−1 for 0.12 μm particles and from 277 ± 45 kPa−1 to 154 ± 19 kPa−1 for 0.3 μm particles.
Figure 5. Mean penetration and mean pressure drop of NIOSH-certified N95 FFRs. Penetration at 0.12 µm is shown in black, and at 0.3 µm is shown in teal. Quality factors are shown in black dotted lines. The error bars reflect the standard deviation (±1 σ).
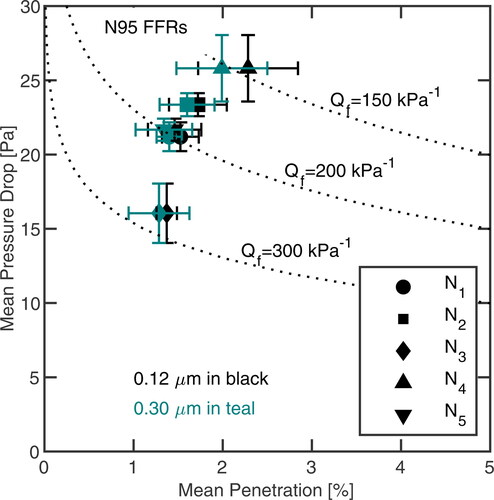
As is apparent in , both mean penetration and pressure drop of N95 FFRs tested showed little variation. The variation in penetration through N1, N2, N3, and N5 (all 3 M N95 FFRs) was ≤ 0.3%, while that through N4 was somewhat larger, 0.6% and 0.5% for 0.12 μm particles and 0.3 μm particles, respectively. The pressure drop varied less than 2 Pa.
3.4. KN95 masks
We have tested KN95s that are commercially available locally; they are manufactured and distributed by different companies, and are labeled as certified according to the Chinese GB2626-2019 or GB2626-2006 standards (Brochot, Saidi, and Bahloul Citation2021; J. Chen and Chen Citation2020; Jun, Yang, and Han Citation2012). The mean and the standard deviation of penetration and pressure drop of five copies of twelve different KN95 masks are shown in . Among those KN95s, the highest Qf at 0.12 μm (177 ± 12 kPa−1) was for K12 due to its low mean penetration (0.6 ± 0.1%) and mean pressure drop (29 ± 2 Pa). In contrast, K8 exhibited the lowest Qf (46 ± 14 kPa−1) at 0.12 μm with relatively high mean penetration (5.7 ± 5.7%) and high pressure drop (72 ± 1 Pa), compared with other KN95s. Similar results were observed at 0.30 μm. Masks K4, K10, K11, and K12 were manufactured by the same company, but were purchased one month apart. Particle penetration through the four batches differs by 4-fold to 10-fold at 0.12 μm with K12 having the minimum penetration of 0.6 ± 0.1%, while K10 had the highest penetration of 5 ± 1.4%. K4 and K11 had p = 2.5 ± 0.4% and p = 2.8 ± 0.6%, respectively. The corresponding pressure drops of four batches varied between 25 ± 3 Pa and 36 ± 1 Pa.
Figure 6. Mean penetration and mean pressure drop of KN95 masks. Penetration at 0.12 µm is shown in black, and at 0.3 µm is shown in teal. Quality factors are shown in black dotted lines. The error bars reflect the standard deviation (±1 σ).
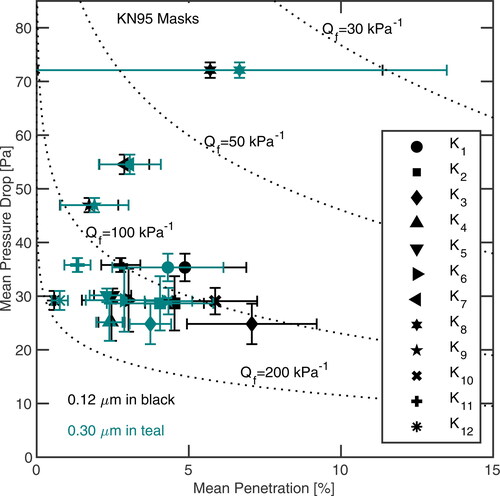
Overall, only nine out of twelve different KN95s types showed mean penetration < 5% for 0.12 μm particles. However, for 0.3 μm particles, the mean penetration was < 5% for all KN95s except K8 (p = 6.7 ± 6.8%). Most KN95s showed significantly larger variation in mean penetration and pressure drop than did the N95 FFRs. The penetration through eight types of KN95s varied more than 0.6% for both 0.12 μm and 0.3 μm particles; the variation of the pressure drop across five types of KN95s exceeded 2 Pa.
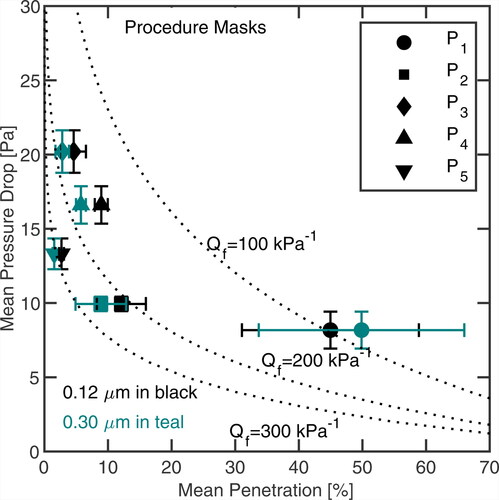
3.5. Procedure masks
We also tested multiple copies of five different brands of procedure masks. Little information was available about these masks, and neither the masks nor their packaging carried any designation of certification. Hence, we will refer to them as procedure masks.
shows the penetration and pressure drop for multiple copies of five different procedure masks. For 0.12 μm particles, the mean penetration through these masks varied between 2.7% and 45%; the mean pressure drop varied between 8 and 20 Pa. The top-performing procedure mask was P5, which had the lowest mean penetration (2.7 ± 0.4%) at 0.12 μm, and the moderate pressure drop (13 ± 1 Pa), comparable to N95 FFRs. The resulting quality factor of the mask at 0.12 μm (274 ± 28 kPa−1) was comparable to the best of the N95 FFRs tested. In contrast, for P1, p = 45.0 ± 13.9% at 0.12 μm, ΔP = 8 ± 1 Pa, and Qf = 110 ± 57 kPa−1, the highest penetration of all of the tested nonwoven masks. For 0.3 μm particles, the mean penetration through procedure masks varied between 1.5% and 50%. The Qf ranged from a high of 316 ± 35 kPa−1 to 98 ± 61 kPa−1. Thus, even the mask that allowed half of the particles to penetrate through it exhibited a quality factor well in excess of the WHO interim recommendations for protecting the general public.
Figure 7. Mean penetration and mean pressure drop of procedure masks. Penetration at 0.12 µm is shown in black, and at 0.3 µm is shown in teal. Quality factors are shown in black dotted lines. The error bars reflect the standard deviation (±1 σ).
3.6. Cloth masks
shows the penetration and pressure drop for multiple copies of seven different cloth masks. Some types are 100% cotton (the most common material used in cloth masks), while others use a cotton-polyester blend. Most of them had ear loops. For 0.12 μm particles, the best of the masks tested allowed about 15% of the particles to pass through the mask; penetration through the least efficient cloth mask tested was 44%, higher than the penetration through all of the N95 FFRs and KN95s tested, and most of the procedure masks. The mean pressure drop ranged from 20 to 54 Pa, a bit higher than observed for the NIOSH-certified N95 FFRs.
Figure 8. Mean penetration and mean pressure drop of cloth masks. Penetration at 0.12 µm is shown in black, and at 0.3 µm is shown in teal. Quality factors are shown in black dotted lines. The error bars reflect the standard deviation (±1 σ).
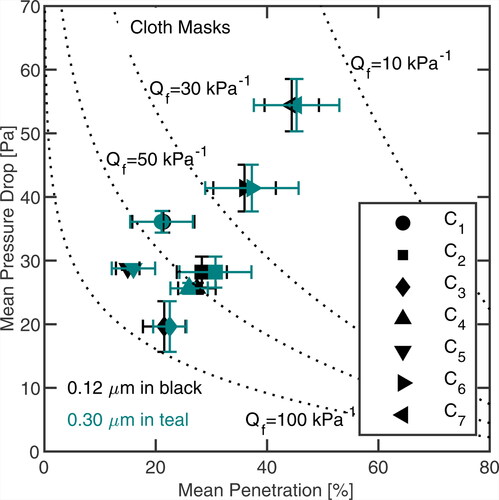
Among the tested cloth masks, C5 has a pocket in which a PM2.5 or other filter element can be inserted, and was tested with the supplied PM2.5 filter in place, yielding the lowest mean penetration (15.0 ± 2.1%) of all the cloth masks tested. We note that the cloth around the filter pocket of C5 was permeable and may allow leakage. The cloth may be pulled into contact with the face during inhalation, forcing air to flow through the filter, but during exhalation, air is likely to leak out through the lower efficiency cloth. Since these tests were performed with the mask sealed to a base rather than mounted onto a face-form using the provided straps, it is possible that leakage through the cloth may account for many of the particles that penetrate, and that the pressure drop (29 ± 1 Pa) may underestimate the pressure drop when the mask is worn. Mean quality factors for the cloth masks at 0.12 μm ranged from 15 ± 3 kPa−1 for a mask with p = 44.4 ± 4.9% to 83 ± 23% for one with p = 21.5 ± 3.8%.
3.7. Coefficient of variation of penetration and pressure drop
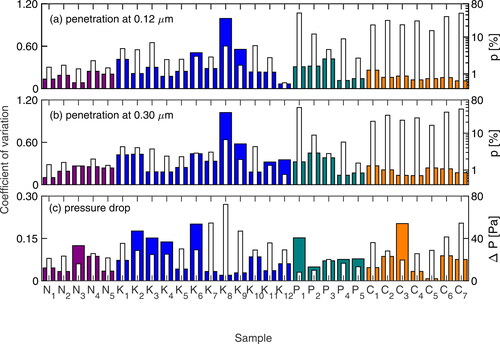
A key finding of this study is the high variability amongst the different masks tested. shows that the coefficient of variation of the penetration at 0.12 μm for NIOSH-certified N95 FFRS, KN95s, procedure masks, and cloth masks varied from 0.08–0.25, 0.07–0.99, 0.11–0.42, and 0.11–0.26, respectively. The corresponding values 0.3 μm were 0.09–0.27, 0.18–1.02, 0.13–0.45, and 0.12–0.27 (). Overall, the lowest value at 0.12 μm was for K12 and at 0.30 µm was for N1. The highest was for K8 at both sizes. shows that the coefficient of variation of pressure drop for NIOSH-certified N95 FFRs, KN95s, procedure masks, and cloth masks ranged from 0.03–0.12, 0.02–0.20, 0.05–0.15, and 0.01–0.20, respectively. Overall, the minimum value was for C5, and the maximum value was for C3 and K6.
Figure 9. Coefficient of variation for (a) penetration at 0.12 µm; (b) penetration at 0.3 µm; (c) pressure drop are shown in filled bar graph. Filled colors represent different classes; NIOSH-certified N95 FFRs are shown in purple, KN95s are shown in blue, procedure masks are shown in teal, and cloth masks are shown in orange. The white bars represent the mean values of (a) penetration at 0.12 µm; (b) penetration at 0.3 µm; (c) pressure drop for each sample.
3.8. Summary of four classes
shows a summary of the penetration and the pressure drop of four classes. The corresponding mean values and the standard deviation of pressure drop, penetration, and quality factor of each class are summarized in Table S3 in the SI.
Figure 10. Mean penetration and mean pressure drop of four classes (a) including all mask models (b) separating the P1 masks from the other procedure masks. Penetration at 0.12 µm is shown in black, and at 0.3 µm is shown in teal. The error bars reflect the standard deviation (±1 σ).
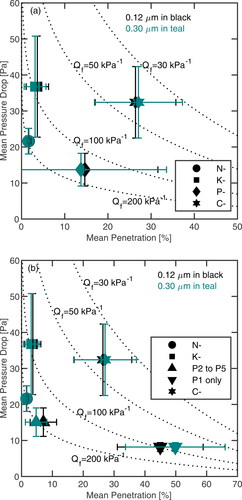
As shown in and Table S3, NIOSH-certified N95 FFRs had a penetration of 1.7 ± 0.5% for 0.12 μm particles and 1.6 ± 0.4% for 0.3 μm particles, while the pressure drop was 22 ± 4 Pa. Overall, N95 masks showed the lowest variation in both penetration and pressure drop. The KN95s, had a p = 3.7 ± 2.6% at 0.12 μm and p = 3.1 ± 2.5% at 0.3 μm. The corresponding ΔP = 37 ± 14 Pa. Compared to the NIOSH-certified N95 class, the KN95 class showed greater variability in both penetration and pressure drop. The tested procedure masks provided moderate penetration (13–15%), but the overall pressure drop was significantly lower than the other classes. Among the four classes, cloth masks showed the highest mean penetration (26–27%), and relatively high-pressure drop (32 Pa). This class also showed 9–10% variability in penetration and about 10 Pa variability in the pressure drop. The highest variability in the pressure drop (14 Pa) was for the KN95 class, and the highest variability in the penetration (17–20%) at both sizes was for procedure masks. However, one procedure mask, P1, was a clear outlier based on the results of the Student’s t-test; this variability decreased to 4% after separating the P1 masks from the other procedure masks, as shown in . Unfortunately, there were no features other than the results of these tests that would identify P1 as being different from the other procedure masks.
3.9. Discussion
According to our results, NIOSH-certified N95 FFRs showed the lowest variation in both penetration and pressure drop. To attain this high and consistent performance, N95 FFRs have one or more intermediate layers of a non-woven, mesh of randomly oriented, micron-sized polymeric (typically polypropylene) fibers that are charged during the manufacturing process (Yim et al. Citation2020). The stored charge within the fibers enhances the collection of charged particles by inducing electrophoretic migration of charged particles toward the fibers, and uncharged particles through dielectrophoretic migration in electric field gradients. Because these electret effects shift the MPPS below 0.1 µm, penetration increases with decreasing size for these masks. Electret enhancement of the filter performance persists as long as the filter remains charged. However, those charges on polypropylene fibers can degrade significantly if the mask is used multiple times, or is washed.
Legitimate KN95 masks are certified according to Chinese standards (Brochot, Saidi, and Bahloul Citation2021; J. Chen and Chen Citation2020; Jun, Yang, and Han Citation2012). Like the NIOSH-certified N95 FFRs, they are made from multiple layers of non-woven electret fibers that are charged to attain high efficiency at low-pressure drop. Most of the tested KN95s employ earloops rather than straps that fasten around the head. Head straps are required by the NIOSH standard for N95 FFRs due to the superior fit they provide. While this difference does not affect the present test, earloops give a much less secure fit and, thereby, degrade protection for equivalent materials (Sickbert-Bennett et al. Citation2020). As in the N95 FFRs, penetration of 0.12 μm particles is higher than that of 0.3 μm ones due to the electret effects on filtration efficiency. In addition, it can capture uncharged particles due to dipole interactions through a process known as dielectrophoresis. The combined mechanisms shift the MPPS from 0.3 μm for an uncharged filter to 0.12 μm and reduce penetration for high-quality electret-based KN95s. The high variability in the particle penetration and pressure drop through those KN95s makes the protection that they provide uncertain.
The WHO defines medical masks as surgical or procedure masks that are flat or pleated. Unlike N95 FFRs and surgical masks that employ straps that fasten around the head to ensure a tight fit to the face, procedure masks often have earloops (World Health Organization Citation2020). Due to the short supply of surgical masks, procedure masks are more commonly used by the general public, so they were examined in this study. The primary purpose for which medical procedure masks were originally intended is to reduce the spread of bioaerosols from the wearer to others (a patient) from the aerosol exhaled by the wearer (He et al. Citation2013). Previous studies have reported that surgical and procedure masks provided lower protection than N95 FFRs when challenged with aerosols containing pathogens (Grinshpun et al. Citation2009; C.C. Chen and Willeke Citation1992), but a recent study shows that the ASTM-certified medical masks that fasten using ties around the head rather than with earloops can provide a reasonable degree of protection, while those with earloops were markedly inferior (Sickbert-Bennett et al. Citation2020). One comparison found no significant difference in the degree of protection given by N95 FFRs and surgical masks from the influenza virus (Johnson et al. Citation2009). Many of the masks available to the general public are pleated procedure masks formed from multiple layers of non-woven polymeric materials, often carrying no designation as to whether these masks satisfy ASTM or any other standards. They usually have earloops rather than the head ties that are employed on surgical masks.
Owing to the shortage of N95 and quality medical masks around the world, many countries recommend that people wear cloth masks to limit the spread of COVID-19. Most cloth masks employ fabrics in which threads are woven or knitted into regular arrays. A key parameter used to characterize woven fabrics is the thread count, the number of threads per square inch, including the length warp and width weft threads. Threads are made by twisting much smaller fibers together. For some fabrics, the fibers are comparable in size to the fibers in the non-woven filters; as such, if they were not twisted into much larger threads, they might be more effective at capturing particles by all three non-charge mechanisms, i.e., diffusion, impaction, and interception. The weaving process may further leave a pattern of holes through which air may leak without being filtered. Most of the cloth masks did not show significant size dependence in particle penetration, similar to that in . Leakage through the open space in the weave may be responsible for this flat response.
Although numerous studies have reported on the performance of various types of masks (Konda et al. Citation2020; Zhao et al. Citation2020; Liao et al. Citation2020; Grinshpun et al. Citation2009; Bałazy et al. Citation2006; Eninger et al. Citation2008; He et al. Citation2013; Pan et al. Citation2021; Ardon-Dryer et al. Citation2021), few studies have specifically investigated the coefficient of variation of penetration. Bałazy et al. (Citation2006) previously reported that the coefficient of variation of the penetration for multiple copies of two types of N95 FFRs from two different manufacturers, tested at the same flow rate that we employed; their values ranged from 0.21–0.48 and 0.32–0.54 over the particle size range of 0.02–0.1 μm respectively, somewhat higher than the present values.
When looking at data from the entire collection of masks of each type (), there appears to be no difference in penetration between the two sizes that we examine in this study, i.e., the differences are small compared to the standard deviations. This is due to the large model-to-model variability. However, if we examine the results for individual mask types shown in , differences generally consistent with expected size dependence are seen. For the N95 masks, penetration of 0.12 µm particles was higher than that for 0.3 µm particles for 4/5 of the mask types tested; for KN95s the fraction was 8/12, while for procedure masks it was 4/5. In the latter case, the outlier mask that did not exhibit the shift in the MPPS associated with the electret effect was the one for which the larger particles showed the highest penetration. For cloth masks that showed a little variation of penetration with size and exhibited no electret effect, the larger particles nonetheless showed the highest penetration for each mask model.
The quality factors determined for different masks ranged from 15 kPa−1 to 316 kPa−1. These values are well above the minimum of 3 kPa−1 considered acceptable by the WHO for the general public (World Health Organization Citation2020); even for some of those masks that transmit more than 50–60% of the particles at the most penetrating particle size. The quality factor is the ratio of two quantities, both of which are proportional to the depth of the filter bed (Hinds Citation1999). Filtration efficiency can be enhanced by increasing the thickness of the filter medium, which increases the pressure drop, but the quality factor does not change. While it is a useful tool in the design of masks and other filters that attain a particular degree of protection, the so-called quality factor says nothing about the protection that a mask provides, or about the quality of the mask. Instead, it describes the quality of the filter medium without regard to the performance of a particular filtration device (e.g., mask). Thus, the quality factor is irrelevant to the performance of masks, though it may be quite useful in their design.
4. Conclusions
In this study, we have measured the ability of presently used filter materials to prevent particle penetration through masks and respirators, with particular emphasis on the variability in the protection that mask material provides. According to our results, while properly worn NIOSH-certified N95 FFRs and KN95s (the ones we have tested) potentially reduce inhale dose by a factor of 43–77 and 14–59, respectively. Procedure masks and cloth masks could potentially reduce the dose by a factor of 2–45 and 2–7, respectively - if they can be sealed to the face. For a mask to approach the level of protection suggested by the material tests that we performed, the mask must cover the nose and the mouth, and attach firmly over the bridge of the nose, block the area between the nose and the cheekbone, and fit tightly around the face and under the chin. Without such a tight fit, the exhaled breath can leak out around the edges without passing through any material designed to filter out particles. The leakage of inhaled breath may be smaller, but still significant.
We further determined the variability of the performance of mask material and manufacture. The observed low values in variation of penetration and pressure drop of NIOSH-certified N95 FFRs clearly demonstrated very high and consistent performance. Some of the KN95s were quite consistent, but others, including ones marked as having met the same Chinese GB2626 standard, were highly variable. These masks may not provide the expected level of protection, even though they are seemingly certified by the standard. Similarly, the performance of most procedure masks and cloth masks tested were found to be highly variable. They showed a significant variation in penetration and pressure drop. While many commercially available masks are advertised as having good filtration efficiency, the degree to which their performance has actually been tested is not known.
Some procedure masks are constructed from multiple layers of high quality filter material, and, in the filter penetration measurements reported here, perform nearly as well as the certified masks. If modified or augmented in a way that provides a good seal to the face, these masks could provide excellent protection from both small and large virus-laden particles, providing both personal and community protection. Some procedure masks (1 of 5 types tested), while visually indistinguishable from other procedure masks appear to be fabricated from manifestly inferior materials, allowing half of the particles to penetrate through the mask.
The tested cloth masks were not as effective as those from non-woven filter media because the micron-sized fibers that could make an efficient filter are twisted into large threads that are much less effective as filter media. Efforts to achieve low penetration through cloth masks with multiple layers increase pressure drop. Still, some cloth masks do reduce penetration below 20% if they seal to the face, offering a degree of protection that is consistent with the efficacy of widespread mask wearing in slowing the spread of COVID-19. Masks made from non-woven, electret materials do afford much better protection, however.
Even when only cloth and procedure masks are available, mask-wearing mandates have been shown to reduce transmission of COVID-19 in spite of the relatively high penetration of virus-laden particles through and leakage around such masks. The relatively low degree of personal protection, and discomfort due to the pressure drop through the masks has, however, contributed to skepticism about wearing masks.
The variability in mask performance that this study has revealed raises a key challenge in communities. The low variability in penetration and pressure drop for the N95 FFRs compared to the other classes of masks is a direct result of the stringent standards that must be met to attain NIOSH certification. Manufacturers must implement effective quality control to maintain that certification. Quality control, or perhaps compliance with the standard is apparently less effective for the KN95 masks. Lacking standards, cloth masks and non-medical procedure masks are much more variable. Some of the procedure masks that we tested contain highly effective, non-woven filter media, but are indistinguishable from markedly inferior masks initiative. Quatitative testing is needed along with verifiable labeling to ensure that masks meet specific standards, and, thereby, to control the large influx of inferior, and possibly counterfeit masks into the market.
Author contributions
RCF planned and designed the experiments. BP, SA and YH prepared the experimental setup. BP carried out the measurements, analyzed the data, and generated the figures. BP and RCF wrote and edited the manuscript. All authors reviewed the manuscript.
uast_a_2003291_sm4019.docx
Download MS Word (8.9 MB)Acknowledgments
The authors acknowledge Professor Niles Pierce and Caltech book store for supplying some samples. The authors also like to thank Ryan Ward and Benjamin Laccetti for useful discussions.
Disclosure statement
No potential conflict of interest was reported by the authors.
Additional information
Funding
References
- Anderson, N. J., P. E. Cassidy, L. L. Janssen, and D. R. Dengel; Exercise Science. 2006. Moderate and heavy work loads. J. Int. Soc. Respirator. Protect. 23 (1943):53–63.
- Ardon-Dryer, K., J. Warzywoda, R. Tekin, J. Biros, S. Almodovar, B. L. Weeks, L. J. Hope-Weeks, and A. Jr. Sacco. 2021. Mask material filtration efficiency and mask fitting at the crossroads: implications during pandemic times. Aerosol Air Qual. Res. 21 (7):200571. doi:10.4209/aaqr.200571.
- Bałazy, A., M. Toivola, T. Reponen, A. Podgórski, A. Zimmer, and S. A. Grinshpun. 2006. Manikin-based performance evaluation of N95 filtering-facepiece respirators challenged with nanoparticles. Ann. Occup. Hyg. 50 (3):259–69.
- Brochot, C., M. N. Saidi, and A. Bahloul. 2021. how effective is the filtration of ‘KN95’ filtering facepiece respirators during the COVID-19 pandemic? Ann. Work Expo. Health. 65 (3):358–66. doi:10.1093/annweh/wxaa101.
- Brooks, J. T., D. H. Beezhold, J. D. Noti, J. P. Coyle, R. C. Derk, F. M. Blachere, and W. G. Lindsley. 2021. Maximizing fit for cloth and medical procedure masks to improve performance and reduce SARS-CoV-2 transmission and exposure. Mmwr. Morb. Mortal. Wkly. Rep. 70 (7):254–7. doi:10.15585/mmwr.mm7007e1.
- Chen, C.-C., and K. Willeke. 1992. Aerosol penetration through surgical masks. Am. J. Infect. Control. 20 (4):177–84. doi:10.1016/S0196-6553(05)80143-9.
- Chen, J., and Y.-J. Chen. 2020. Will the cross-standard substitution policy resolve the shortage of personal protection equipment? Available at- SSRN 3694465
- Clapp, P. W., E. E. Sickbert-Bennett, J. M. Samet, J. Berntsen, K. L. Zeman, D. J. Anderson, D. J. Weber, and W. D. Bennett. 2021. Evaluation of cloth masks and modified procedure masks as personal protective equipment for the public during the COVID-19 pandemic. JAMA Intern. Med. 181 (4):463. doi:10.1001/jamainternmed.2020.8168.
- Collins, D. R., R. C. Flagan, and J. H. Seinfeld. 2002. Improved inversion of scanning DMA data. Aeros. Sci. Technol. 36 (1):1–9. doi:10.1080/027868202753339032.
- Edwards, D. A., D. Ausiello, J. Salzman, T. Devlin, R. Langer, B. J. Beddingfield, A. C. Fears, L. A. Doyle-Meyers, R. K. Redmann, S. Z. Killeen, et al. 2021. Exhaled aerosol increases with COVID-19 infection, age, and obesity. Proc. Natl. Acad. Sci. U S A. 118 (8):e2021830118. doi:10.1073/pnas.2021830118.
- Eninger, R. M., T. Honda, A. Adhikari, H. Heinonen-Tanski, T. Reponen, and S. A. Grinshpun. 2008. Filter performance of N99 and N95 facepiece respirators against viruses and ultrafine particles. Annals of Occupational Hygiene 52 (5):385–96. doi:10.1093/annhyg/men019.
- Eshbaugh, J. P., P. D. Gardner, A. W. Richardson, and K. C. Hofacre. 2009. N95 and P100 respirator filter efficiency under high constant and cyclic flow. J. Occup. Environ. Hyg. 6 (1):52–61. doi:10.1080/15459620802558196.
- Fabian, P., J. Brain, E. A. Houseman, J. Gern, and D. K. Milton. 2011. Origin of exhaled breath particles from healthy and human rhinovirus-infected subjects. J Aerosol Med Pulm Drug Deliv. 24 (3):137–47. doi:10.1089/jamp.2010.0815.
- Fabian, P., J. J. McDevitt, W. H. DeHaan, R. O. P. Fung, B. J. Cowling, K. H. Chan, G. M. Leung, and D. K. Milton. 2008. Influenza virus in human exhaled breath: An observational study. PLoS One 3 (7):e2691. doi:10.1371/journal.pone.0002691.
- Flagan, R. C. 2008. Differential mobility analysis of aerosols: A tutorial. KONA 26 (0):254–68. doi:10.14356/kona.2008023.
- Fuchs, N. A. 1963. On the stationary charge distribution on aerosol particles in a bipolar ionic atmosphere. Geofisica Pura e Applicata 56 (1):185–93. doi:10.1007/BF01993343.
- Grinshpun, S. A., H. Haruta, R. M. Eninger, T. Reponen, R. T. McKay, and S.-A. Lee. 2009. Performance of an N95 filtering facepiece particulate respirator and a surgical mask during human breathing: two pathways for particle penetration. Journal of Occupational and Environmental Hygiene 6 (10):593–603. doi:10.1080/15459620903120086.
- Guo, Z.-D., Z.-Y. Wang, S.-F. Zhang, X. Li, L. Li, C. Li, Y. Cui, et al. 2020. Aerosol and surface distribution of severe acute respiratory syndrome coronavirus 2 in hospital wards, Wuhan, China, 2020. Emerg. Infect Dis. 26 (7):10–3201.
- He, X., T. Reponen, R. T. McKay, and S. A. Grinshpun. 2013. Effect of particle size on the performance of an N95 filtering facepiece respirator and a surgical mask at various breathing conditions. Aerosol Sci. Technol. 47 (11):1180–7. doi:10.1080/02786826.2013.829209.
- Hering, S. V., G. S. Lewis, S. R. Spielman, and A. Eiguren-Fernandez. 2019. A MAGIC concept for self-sustained, water-based, ultrafine particle counting. Aerosol Sci. Technol. 53 (1):63–72. doi:10.1080/02786826.2018.1538549.
- Hering, S. V., S. R. Spielman, and G. S. Lewis. 2014. Moderated, water-based, condensational particle growth in a laminar flow. Aerosol Sci Technol 48 (4):401–8. doi:10.1080/02786826.2014.881460.
- Hinds, W. C. 1999. Aerosol technology: Properties, behavior, and measurement of airborne particles. New York: John Wiley & Sons.
- Hoppel, W. A., and G. M. Frick. 1986. Ion—aerosol attachment coefficients and the steady-state charge distribution on aerosols in a bipolar ion environment. Aerosol Sci. Technol. 5 (1):1–21. doi:10.1080/02786828608959073.
- Huang, S.-H., C.-W. Chen, Y.-M. Kuo, C.-Y. Lai, R. McKay, and C.-C. Chen. 2013. Factors affecting filter penetration and quality factor of particulate respirators. Aerosol Air Qual. Res. 13 (1):162–71. doi:10.4209/aaqr.2012.07.0179.
- ICRP. 1994. ICRP 1994.Pdf.
- Johnson, D. F., J. D. Druce, C. Birch, and M. L. Grayson. 2009. A Quantitative assessment of the efficacy of surgical and N95 masks to filter influenza virus in patients with acute influenza infection. Clin. Infect. Dis. 49 (2):275–7. doi:10.1086/600041.
- Jun, Z. X., Y. H. Yang, and Y. Han. 2012. NIOSH test method and judgment methodology to particle respirator filter efficiency and suggestion to national standard GB2626-2006. China Pers. Protect. Equip. 5:25–29.
- Konda, A., A. Prakash, G. A. Moss, M. Schmoldt, G. D. Grant, and S. Guha. 2020. Aerosol filtration efficiency of common fabrics used in respiratory cloth masks. ACS Na 14 (5):6339–47. doi:10.1021/acsnano.0c03252.
- Lednicky, J. A., M. Lauzardo, Z. H. Fan, A. Jutla, T. B. Tilly, M. Gangwar, M. Usmani, S. N. Shankar, K. Mohamed, A. Eiguren-Fernandez, et al. 2020. Viable SARS-CoV-2 in the air of a hospital room with COVID-19 patients. Int. J. Infect. Dis. 100:476–82. doi:10.1016/j.ijid.2020.09.025.
- Liao, L., W. Xiao, M. Zhao, X. Yu, H. Wang, Q. Wang, S. Chu, and Y. Cui. 2020. Can N95 respirators be reused after disinfection? How many times? ACS Nano. 14 (5):6348–56. doi:10.1021/acsnano.0c03597.
- Liu, B. Y., and K. W. Lee. 1975. An aerosol generator of high stability. Am. Ind. Hyg. Assoc. J. 36 (12):861–5. doi:10.1080/0002889758507357.
- Liu, C., L. Mendonça, Y. Yang, Y. Gao, C. Shen, J. Liu, T. Ni, B. Ju, C. Liu, X. Tang, et al. 2020. The architecture of inactivated SARS-CoV-2 with postfusion spikes revealed by Cryo-EM and Cryo-ET. Structure 28 (11):1218–24. doi:10.1016/j.str.2020.10.001.
- Liu, Y., Z. Ning, Y. Chen, M. Guo, Y. Liu, N. K. Gali, L. Sun, Y. Duan, J. Cai, D. Westerdahl, et al. 2020. Aerodynamic analysis of SARS-CoV-2 in two Wuhan hospitals. Nature 582 (7813):557–60. doi:10.1038/s41586-020-2271-3.
- López-Yglesias, X., and R. C. Flagan. 2013. Ion–aerosol flux coefficients and the steady-state charge distribution of aerosols in a bipolar ion environment. Aerosol Sci. Technol. 47 (6):688–704. doi:10.1080/02786826.2013.783684.
- Lovie, P. 2005. Coefficient of variation. In Encyclopedia of statistics in behavioral science. Oxford, UK: John Wiley & Sons.
- Ma, J. X., Qi, H. Chen, X. Li, Z. Zhang, H. Wang, L. Sun, et al. 2020. COVID-19 patients in earlier stages exhaled millions of SARS-CoV-2 per Hour. Clin. Infect. Dis 72 (10):e652–e654. doi:10.1093/cid/ciaa1283.
- Morawska, L., and J. Cao. 2020. Airborne transmission of SARS-CoV-2: The world should face the reality. Environ. Int. 139:105730. doi:10.1016/j.envint.2020.105730.
- Noda, T. 2011. Native morphology of influenza virions. Front. Microbiol. 2:269. doi:10.3389/fmicb.2011.00269.
- Pan, J., C. Harb, W. Leng, and L. C. Marr. 2021. Inward and outward effectiveness of cloth masks, a surgical mask, and a face shield. Aerosol Sci. Technol. 1–16.
- Rengasamy, S., B. C. Eimer, and R. E. Shaffer. 2009. Comparison of nanoparticle filtration performance of NIOSH-approved and CE-marked particulate filtering facepiece respirators. Ann. Occup. Hyg. 53 (2):117–28. doi:10.1093/annhyg/men086.
- Santarpia, J. L., D. N. Rivera, V. L. Herrera, M. J. Morwitzer, H. M. Creager, G. W. Santarpia, K. K. Crown, D. M. Brett-Major, E. R. Schnaubelt, M. J. Broadhurst, et al. 2020. Aerosol and surface contamination of SARS-CoV-2 observed in quarantine and isolation care. Sci. Rep. 10 (1):1–8. doi:10.1038/s41598-020-69286-3.
- Sickbert-Bennett, E. E., J. M. Samet, P. W. Clapp, H. Chen, J. Berntsen, K. L. Zeman, H. Tong, D. J. Weber, and W. D. Bennett. 2020. Filtration efficiency of hospital face mask alternatives available for use during the COVID-19 pandemic. JAMA Intern Med 180 (12):1607–12. doi:10.1001/jamainternmed.2020.4221.
- Silverman, L. G., Lee, A. R. Yancey, L. Amory, and L. J. Barney. 1943. Fundamental factors in the design of respiratory equipment. In Inspiratory airflow measurements on human subjects with and without resistance Bulletin: 5339. Office of Scientific Research and Development.
- Tang, J. W., W. P. Bahnfleth, P. M. Bluyssen, G. Buonanno, J. L. Jimenez, J. Kurnitski, Y. Li, S. Miller, C. Sekhar, L. Morawska, et al. 2021. Dismantling myths on the airborne transmission of severe acute respiratory syndrome coronavirus (SARS-CoV-2). Journal of Hospital Infection 110:89–96. doi:10.1016/j.jhin.2020.12.022.
- Tcharkhtchi, A., N. Abbasnezhad, M. Zarbini Seydani, N. Zirak, S. Farzaneh, and M. Shirinbayan. 2021. An overview of filtration efficiency through the masks: mechanisms of the aerosols penetration. Bioact. Mater. 6 (1):106–22. doi:10.1016/j.bioactmat.2020.08.002.
- Tellier, R., Y. Li, B. J. Cowling, and J. W. Tang. 2019. Recognition of aerosol transmission of infectious agents: a commentary. BMC Infect Dis. 19 (1):101. doi:10.1186/s12879-019-3707-y.
- Wang, S. C., and R. C. Flagan. 1990. Scanning electrical mobility spectrometer. Aerosol Sci. Technol. 13 (2):230–40. doi:10.1080/02786829008959441.
- Wells, W. F. 1934. On air-borne infection. Study II. Droplets and droplet nuclei. American Journal of Hygiene 20 (3):611–8. doi:10.1093/oxfordjournals.aje.a118097.
- World Health Organization. 2020. Advice on the use of masks in the context of COVID-19: Interim guidance, 5 June 2020.
- Yim, W., D. Cheng, S. H. Patel, R. Kou, Y. S. Meng, and J. V. Jokerst. 2020. KN95 and N95 respirators retain filtration efficiency despite a loss of dipole charge during decontamination. ACS Appl Mater Interfaces 12 (49):54473–80. doi:10.1021/acsami.0c17333.
- Zhao, M., L. Liao, W. Xiao, X. Yu, H. Wang, Q. Wang, Y. L. Lin, F. S. Kilinc-Balci, A. Price, L. Chu, et al. 2020. Household materials selection for homemade cloth face coverings and their filtration efficiency enhancement with triboelectric charging. Nano Lett. 20 (7):5544–52. doi:10.1021/acs.nanolett.0c02211.
- Zhou, L. M., Yao, X. Zhang, B. Hu, X. Li, H. Chen, L. Zhang, Y. Liu, M. Du, B. Sun, et al. 2021 . Breath-, air- and surface-borne SARS-CoV-2 in hospitals. J Aerosol Sci. 152:105693. doi:10.1016/j.jaerosci.2020.105693.