
 ?Mathematical formulae have been encoded as MathML and are displayed in this HTML version using MathJax in order to improve their display. Uncheck the box to turn MathJax off. This feature requires Javascript. Click on a formula to zoom.
Abstract
Biofuel combustion is an important source of particulate light absorbing organic carbon (OC), also known as brown carbon (BrC). We applied spectrophotometry to characterize methanol-extracted BrC from emission tests of ‘real-world’ biofuel combustion in India and Malawi, including wood stoves (‘traditional’, ‘improved’ and ‘chimney’) and artisanal charcoal kilns. Average mass absorption coefficient (MACbulk,λ) of extracted BrC was highest for ‘traditional’, followed by ‘improved’, ‘chimney’, and ‘charcoal’, at near-ultraviolet to blue wavelengths, with this order reversed for BrC absorption Angstrom exponent (AAE). MACbulk,λ in UV wavelengths was positively correlated with the elemental carbon to organic aerosol ratio (EC/OA), though the correlation was weaker than that observed in laboratory cookstove samples. BrC imaginary refractive indices (k) were anti-correlated with wavelength dependence (w), thus less wavelength dependent BrC had higher light absorptivity. MACbulk,λ correlated with the fraction of OC evolving at higher temperature steps in thermo-optical analysis, consistent with a link between BrC absorptivity and OC volatility, and suggesting that BrC absorption may be parameterized using existing OC data. Modeling analyses showed that BrC makes a strong contribution to overall absorption (average of 48% to 80% at 365 nm), and a strong negative correlation between EC/OA and the relative contribution of BrC to total aerosol (BrC + BC) light absorption; the latter trend is dominated by the quantity versus optical properties of BrC. The estimated direct radiative effect of BrC is approximately equal to that of BC for biofuel combustion emissions in India, highlighting the importance of BrC in the climate energy budget.
Copyright © 2022 American Association for Aerosol Research
EDITOR:
1. Introduction
Biomass and biofuel burning combustion is a major source of global black carbon (BC) and organic carbon (OC) emissions (Bond et al. Citation2004). BC is light absorbing and contributes to global warming (Bond et al. Citation2013), while OC has traditionally been treated as light scattering, contributing to global cooling. However, evidence from the past two decades suggest that some fraction of OC absorbs light at near-UV and shorter visible wavelengths with strong wavelength dependence (Saleh Citation2020; Lack and Cappa Citation2010; Kirchstetter, Novakov, and Hobbs Citation2004), unlike BC that absorbs light across the spectral range with weak wavelength dependence. This light absorbing OC is known as brown carbon (BrC) (Andreae and Gelencsér Citation2006), which affects earth’s radiative balance by absorbing incoming solar radiation (Chakrabarty et al. Citation2016; Saleh et al. Citation2015; Chen and Bond Citation2010).
Residential biofuel burning in cookstoves accounts for approximately 12% of ambient PM2.5 globally (Chafe et al. Citation2014) and 25% of OC emitted from biomass burning worldwide (Bond et al. Citation2004). Although cookstove emissions have been extensively characterized in the laboratory and in the field (Champion and Grieshop Citation2019; Grieshop et al. Citation2017; Pandey et al. Citation2017; Jetter et al. Citation2012; Jetter and Kariher Citation2009), optical properties of emitted particles, especially the light absorbing OC (BrC), have not been widely studied. Several studies have quantified BrC absorption from cookstove emissions during controlled laboratory testing. Xie et al. (Citation2018) investigated the influence of fuel types on methanol-extracted BrC mass absorption cross-section (MAC) and found that MAC of BrC from red oak combustion in stoves was 2–6 times higher than that from charcoal and kerosene stoves. Another laboratory cookstove study (Sun et al. Citation2017) applied the integrating sphere method to separate the BrC contribution to aerosol absorption and attributed 26.5% of total light absorption from residential coal combustion emissions to BrC. Pandey et al. (Citation2020) measured BrC and BC absorption on filters collected during field cookstove emissions testing and found similar contributions from the two components to total absorption. Several studies have also examined the influence of BrC from biomass and biofuel burning emissions on direct radiative forcing and regional/global climate via simplified calculations (Pandey et al. Citation2020; Saleh et al. Citation2015). However, considering the high variability in biofuel emissions observed in field versus lab studies (Johnson et al. Citation2008, Citation2019; Mitchell et al. Citation2019; Weyant et al. Citation2019; Shen et al. Citation2015), further evaluation of the optical properties and radiative impacts of these BrC emissions is needed.
The physicochemical properties of particles emitted during combustion depend heavily on combustion conditions. Saleh et al. (Citation2014) suggested that BC/OC, as a proxy of combustion condition, can serve as a metric for parameterizing BrC optical properties, primarily because the prevalence of organic precursors of BC in BrC depends on combustion conditions. These precursors tend to be more light absorbing than the remaining BrC as they nearly reach the BC formation threshold (Saleh, Cheng, and Atwi Citation2018) during the combustion process. Several subsequent biomass and biofuel burning studies explored BC/OA and modified combustion efficiency (MCE = ΔCO2/(ΔCO2 + ΔCO); where Δ indicates a background corrected mixing ratio)—another proxy of combustion conditions—as indicators of BrC production during controlled lab burns. For example, Xie et al. (2018) observed strong association between burn condition (e.g., EC (elemental carbon)/OC and MCE) and BrC optical properties (e.g., MAC and absorption angstrom exponent, AAE). Several lab biomass burning studies (McClure et al. Citation2020; Kumar et al. Citation2018) also observed a dependence of BrC absorption on EC/OC (or BC/OC). On the other hand, studies have typically found weak associations between BrC absorption and MCE (Pokhrel et al. Citation2016; McMeeking et al. Citation2014). To our knowledge, no study has explored the influence of burn conditions during field cookstove use on BrC absorption.
This study quantifies BrC absorption from ‘real-world’ emission samples from four combustion categories representing a wide range of activities common in low/middle income countries with a high reliance on solid fuel combustion for energy: traditional biomass stoves, improved biomass stoves, improved chimney stoves and charcoal production kilns. The main research questions we explore here are: (a) What are the light absorption properties of BrC from diverse ‘real-world’ emissions of biofuels combustions? (b) How do these properties compare with those measured in lab studies? (c) Can we explain variability in these properties using more easily available factors (e.g., combustion conditions, thermal-optical OC-EC measurements)? (d) What are the relative radiative impacts of the co-emitted BC and OC?
2. Methodology
2.1. Site description and biofuel combustion
We characterized BrC absorption in biofuel emissions measured during field campaigns in India and Malawi. In India, we measured cookstove emissions during uncontrolled cooking activities with varying fuel types, cooking durations, types of foods, and time of day at two study sites: Kullu district in northern India and Koppal district in southern India. The study sites and design are described in detail elsewhere (Islam et al. Citation2021) and only briefly mentioned here. 253 emission tests were conducted for a range of stoves including traditional solid fuel stoves (including three stone fire and simple mud/clay chulhas—TSF hereafter), improved/alternative biomass stoves (including Envirofit and Prakti rocket stoves and Teri gasifier), traditional and improved chimney tandoor stoves, and liquefied petroleum gas (LPG) stoves. To explore BrC absorption and its possible dependence on stove technologies, combustion conditions, and OC fractions from OC-EC analysis, we chose a subset of biomass stoves tests that span a wide range of OC-to-EC ratio (0.73–15) and MCE (0.88–0.98). We selected 48 filter samples for BrC extraction from this campaign: 34 TSF, 9 improved biomass and 5 chimney stoves tests (Figure S1). In Malawi, we measured emissions from small industries including charcoal kilns and brick kilns in addition to a variety of stove technologies (e.g., TSF and improved biomass). Here we used filter samples from 5 charcoal kiln tests. Charcoal kilns use pyrolysis to carbonize fuel and are known to emit predominantly OC (Keita et al. Citation2018; Pennise et al. Citation2001; Lacaux et al. Citation1994), and are thus distinct from combustion sources which are predominantly flaming (e.g., cookstoves). For this study we selected charcoal kiln samples (OC-to-EC ratio: 15–54, MCE: 0.83–0.89) in order to explore the influence of vastly different ‘real-world’ combustion conditions on BrC emissions. Note that for stoves, emissions were measured during a complete cooking/combustion event, while complete combustion events of charcoal kilns (usually 24–36 h) were not captured due to battery capacity limitations of the mobile instruments. Hence, we conducted two tests at each kiln: the first test captured the startup of the kiln, and the second 1–2 h later.
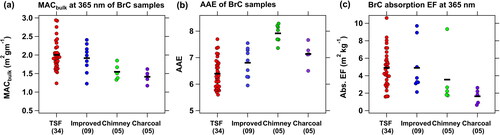
Figure 1. Groupwise properties of BrC samples from the four biofuel combustion types: TSF, Improved, Chimney and Charcoal: (a) MACbulk at 365 nm, (b) AAE, and (c) absorption EFs at 365 nm. Labels on category axis show the group name and the number of samples in parenthesis. Lines and markers in all the subplots are colored to differentiate between the combustion sources (red: TSF stoves, blue: improved stoves, green: chimney stoves, purple: charcoal kilns). This color convention is followed in all figures in this article unless stated otherwise.
2.2. Emission testing
We applied the ‘plume probe’ method (Champion and Grieshop Citation2019; Wathore, Mortimer, and Grieshop Citation2017; Roden et al. Citation2006) for emission measurement in which a six armed stainless steel probe was used to collect a representative sample of emissions from the plume. For the cookstoves, the probe was placed 1–1.5 m above the cookstove (Figure S2). In households with a chimney, the probe sampled immediately above the chimney’s exit (Figure S3). For the charcoal kiln emission measurement, the probe was set up near a vent in the earthen kiln (Figure S4). Emissions were measured using the Stove Emission Measurement System (STEMS), a battery-powered portable instrument package that includes an electrochemical carbon monoxide (CO) sensor, a nondispersive infrared carbon dioxide (CO2) sensor, a 635 nm wavelength laser light scattering PM sensor and a temperature/relative humidity sensor (Islam et al. Citation2021). STEMS has two parallel 47 mm filter trains to collect integrated PM: one contains a bare quartz filter; the other contains a quartz filter behind a Teflon filter. Punches from the quartz filters were used for thermo-optical organic and elemental carbon (OC/EC) analysis (via Sunset OC-EC analyzer) while the Teflon filters were analyzed for gravimetric PM2.5, described elsewhere (Islam et al. Citation2021). Quartz filters behind the Teflon were used to correct the gas phase absorption artifacts (Islam et al. Citation2021) in quantifying OC mass. Here, we only extracted OC from the bare quartz filters, since a previous stove study (Xie et al. Citation2018) found no substantial changes in BrC absorption properties after artifact correction. From emission measurements, we calculated MCE and EC/OA as proxies for burn conditions. OA was calculated using OA/OC values of 1.9 ± 0.56 (average ± standard deviation) that were observed in a previous lab study characterizing TSF and improved biomass stove emissions (Reece, Sinha, and Grieshop Citation2017).
Figure 2. Imaginary refractive index, k of BrC samples at 551 nm against wavelength dependence of absorption (w). Also shown are the observed k550-w ranges of BrC samples from different sources (cross bars), compiled by Saleh (Citation2020). Pink and black lines indicate the fit lines between k550 and w for bulk OA and the highly absorptive part of OA, respectively, developed by Lu et al. (Citation2015).
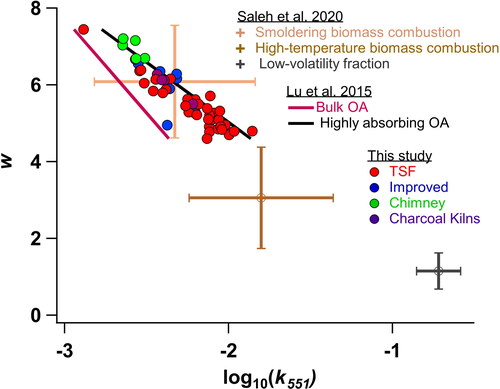
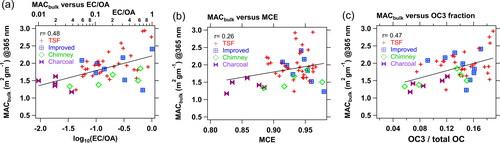
Figure 3. MACbulk,365 values of BrC samples vs. (a) EC/OA, (b) MCE, and (c) OC3 fraction are shown in the subplots.
2.3. Light absorption measurement of BrC
We solvent-extracted methanol-soluble BrC from the bare quartz filters collected during emission measurements. Methanol has shown moderately high extraction efficiency (85% to 98% of OC mass) in prior studies (Xie et al. Citation2018; Cheng et al. Citation2016). The advantage of a solvent-based OC extraction approach (Shetty et al. Citation2019; Liu et al. Citation2013; Chen and Bond Citation2010) is that it excludes EC inferences from the absorption spectra. However, a drawback is that methanol and other solvents (e.g., water, acetone) may not extract the lowest-volatility organic carbon, often found to be the most absorbing fraction (Cheng et al. Citation2020; Saleh Citation2020; Adler et al. Citation2019; Corbin et al. Citation2019; Saleh et al. Citation2014). For our extraction, we placed a filter punch (1 cm2) into 5 mL methanol and sonicated the solution for 1.5 min since sonication was observed to increase extraction efficiency by 10–15% (Polidori et al. Citation2008). Following sonication, we filtered the extract using a syringe through 0.45 µm PTFE syringe filter to remove solid particles and impurities. We then used a spectrophotometer (Horiba Aqualog) to collect the absorption spectra (239 to 800 nm wavelengths with 3 nm interval) of the BrC extract. Sonication destroyed the filter punch and hence we were not able to quantify OC extraction efficiency. A study with cookstove samples (Xie et al. Citation2018) observed high extraction efficiency (∼93%) of OC by methanol without sonication and calculated the light absorption properties of OC assuming 100% extraction efficiency; we follow the same practice for our calculations.
2.4. Estimation of light absorption properties
We converted the light absorption of the bulk solution measured by the spectrophotometer to light absorption coefficient (Bab,λ, Mm−1) in the sampled air using EquationEquation (1)(1)
(1) .
(1)
(1)
where Aλ is the absorption measured at wavelength λ, Abl is the minimum absorption between 650 nm and 700 nm (which was subtracted from Aλ to correct for baseline drift), Vl is the volume of the extract (5 ml), Va (m3) is the volume of the air sampled through the quartz filter during emission measurements, L is the spectrophotometer optical path length (0.01 m) and Areafilter/Areapunch is the ratio of filter-to-punch areas.
We calculated bulk mass absorption cross-section (MACbulk,λ, m2 g−1), also expressed as alpha-density ratio (α/ρ) in some studies (Chen and Bond Citation2010; Sun, Biedermann, and Bond Citation2007) where α is absorption coefficient and ρ is the density of dissolved substance, using the calculated Bab,λ in m−1 and OC mass concentration in sampled air (COC) in g m−3 (EquationEquation (2)(2)
(2) ). Note that MACbulk denotes the mass absorption cross-section of the extracted BrC solution, which is distinct from the MAC of aerosol (MACaer). We used Mie modeling to convert MACbulk to MACaer for use in radiative forcing calculation (Sec. 2.5).
(2)
(2)
We estimated the imaginary part (k) of the complex refractive index (m = n + ik) of the extract (EquationEquation (3)(3)
(3) ) employing the calculated MACbulk, as in other OC extraction studies (Chen and Bond Citation2010; Kirchstetter, Novakov, and Hobbs Citation2004), assuming that k is proportional to α (α = 4πk/λ). We assumed a density value (ρ) of 1.2 gm cm−3 (Lu et al. Citation2015) for this calculation. We calculated AAE as the slope of log-transformed MACbulk vs wavelength over the wavelength range of 239–551 nm.
(3)
(3)
We also estimated absorption emission factor (Abs. EF, m2 kg−1) for extracted samples using the calculated Bap in m−1 from EquationEquation (1)(1)
(1) , carbon fraction in fuelwood (Cfuel = 0.50) and background-corrected carbon dioxide (ΔCO2) and carbon monoxide (ΔCO) mass concentrations in emissions in g m−3 as shown in EquationEquation (4)
(4)
(4) . Note that for the charcoal kiln, which pyrolizes rather than burns the wood fuel, we multiplied Cfuel by 0.45, an estimate of the fraction of fuel carbon that goes to emitted gases during charcoal production (Bertschi et al. Citation2003; Pennise et al. Citation2001). We applied the non-parametric Wilcoxon rank sum test at 5% significance level to compare BrC light absorption and combustion properties between biofuel combustion categories.
(4)
(4)
2.5. Relative absorption and contribution to radiative effect by BC and BrC
We applied a Mie model (Saleh et al. Citation2014) to estimate the particle light absorption attributed to BC and BrC using kBrC of extracts (estimated in Sec. 2.4) as inputs. Other inputs including real and imaginary parts of the refractive index of BC (mBC = 1.85 + 0.71i) and the real part of the refractive index of BrC (1.6) were obtained from literature (Saleh et al. Citation2013, Citation2014; Lack and Cappa Citation2010; Bond and Bergstrom Citation2006; Bond, Habib, and Bergstrom Citation2006). In the absence of particle size measurements in the field, we used size distributions of total aerosol measured in our lab (Figure S5) using a scanning mobility particle sizer (SMPS, TSI Inc.). We assumed that OC and EC occurred in the same size distribution as the total aerosol and that the laboratory distributions applied to the field emissions. The median geometric mean diameter (inter quartile range) of emissions from stoves in lab measurements was 84 (47) nm, in line with the values—76 (22) nm—observed during field testing of Indian stove emissions (TSF and improved biomass) (Eilenberg et al. Citation2018). To estimate mass distributions of in-field OC and EC respectively for use in the Mie model, we scaled the normalized lab particle mass distributions with the in-field mass measurements of OC and EC. The scaling factors for OC and EC were the ratio of total aerosol mass from the lab size distribution to the OC and EC mass measured in field emissions, respectively. Note that we only had particle size measurements of TSF and improved stove emissions, so the relative absorption and radiative impact analysis were limited to TSF and improved stove samples only.
For radiative impact analysis, we followed the approach of Saleh et al. (Citation2014) using the simple forcing efficiency (SFE) modeling framework (Bond and Bergstrom Citation2006). Wavelength dependent SFE (W g−1) is calculated using EquationEquation (5)(5)
(5) :
(5)
(5)
where ds(λ)/d(λ) is the solar irradiance from the ASTM G173-03 reference spectra, τatm is the atmospheric transmission (0.79), Fc is the cloud fraction (0.6), a is the surface albedo (0.19), β is the backscatter fraction (0.17), and MACaer and MSCaer are the aerosol mass absorption and mass scattering cross-sections from Mie modeling.
Additionally, we calculated the ratio of simplified direct radiative effect (DRE) of PM (as represented by OA + EC, the dominant PM components) to EC alone using the respective SFE values as follows (Saleh et al. Citation2014):
(6)
(6)
Estimating the contribution of BrC to absorption and radiative forcing requires knowledge of mixing state, which we do not have. Hence, we considered three mixing state scenarios (see Saleh et al. Citation2014 for more details on assumptions) for the estimation of relative absorption and radiative forcing of BC and BrC, and to evaluate sensitivity to mixing state assumptions: (a) 100% external mixing, (b) 50% external mixing and (c) 0% external mixing. Note that the remaining percentages in scenario (b) and (c) were internally mixed particles (50% and 100% respectively), which were assumed to have a core-shell morphology. To incorporate additional information on the mixing state of cookstove emissions, we also categorized our samples based on a MCE threshold of 0.95: (a) 0%–80% external mixing for MCE > 0.95, and (b) 80%–100% external mixing for MCE < 0.95, following the study of Ting et al. (Citation2018), which parameterized mixing state based upon MCE. We selected 50% and 90% external mixing as the central estimates for these two categories, respectively.
Finally, we put these calculated climate properties in a larger context, we used the SFE values to approximate annual average DRE (unit: W m−2) from PM (OA + EC) emitted from residential combustion over the Indian subcontinent in 2010. We calculated DRE as the product of PM column burden (g m−2) and SFE (W g−1) for 50% and 90% external mixing scenarios. PM (OA + EC) column burden attributed to residential biofuel burning over India was obtained from The Modern-Era Retrospective analysis for Research and Applications, Version 2 (MERRA-2) (Gelaro et al. Citation2017) reanalysis dataset (0.5° × 0.625° grid resolution) followed by a source-specific scaling using sectoral vs total emission rates from the Emission Database for Community Emissions Data System (CEDS) (McDuffie et al. Citation2020) emission inventory. An implicit assumption in this approach is that the carbonaceous aerosol column burden is dominated by emissions within the column. This does not account for chemical evolution and transport of emissions between grid cells, which would require detailed chemical transport modeling, but provides a first-order approximation for converting SFE values into radiative effect. The CEDS emission inventory has a finer grid resolution (0.5° × 0.5°) relative to MERRA-2. Therefore, we regridded CEDS grid cells to the coarser MERRA-2 grid resolution. Calculation of SFE for each column required spatially resolved MSCaer, MACaer and surface albedos. Spatially resolved surface albedos were derived from the MERRA-2 dataset (Figure S6). To calculate MSCaer and MACaer from EC/OA in each column, we developed wavelength-specific simple linear regression equations between MSCaer and MACaer and EC/OA for TSF and improved stove samples (Figure S7). We obtained the DRE of BrC absorption by calculating DRE with and without BrC absorption (assuming non-absorbing OC) and taking the difference between the two.
3. Result and discussion
3.1. Combustion conditions and emission factors
Figure S8 shows the OC and EC emission factors (EFs), EC/OA and MCEs from the experiments selected for BrC analysis. In general, OC EFs from the four groups (TSF, Improved, Chimney, Charcoal) are overlapping and group means are within 21% of each other (Figure S8a), but the chimney and charcoal groups each contain a high outlier EF. In terms of EC EF, stove samples are similar in magnitude but charcoal kiln samples are significantly lower than those of the stoves (Figure S6b). For example, mean EC EF of charcoal kiln samples are 94% (p = 0.0002), 95% (p = 0.001) and 93% (p = 0.004) lower than those of TSF, improved and chimney stove samples respectively. This is likely because charcoal production proceeds via air-starved pyrolysis (on purpose) that involves lower combustion temperature (and hence lower EC production) relative to stove combustion. For the same reason, mean EC/OA and MCE of charcoal kiln samples are substantially lower than those of stove samples (Figure S8c and S8d). Mean EC/OA and MCE of charcoal kiln samples are 92–94% and 8–9% lower respectively than those of stove samples. Note the small change in MCE (<10%) due to change in burn condition (e.g., flaming to smoldering) compared to that of EC/OA (>90%), suggesting that EC/OA is a more sensitive proxy for combustion conditions than MCE. Pokhrel et al. (Citation2016) also observed a small change in MCE (∼1.5%) compared to EC/OA (∼100%) from eight different sawgrass burns in the lab and reached the same conclusion. Among our three stove groups, EC/OA and MCE—similar to OC EF and EC EF—do not show any significant differences.
3.2. Light absorption properties of BrC
Figure S9 shows averaged MACbulk spectra (with standard deviation) of BrC samples as a function of wavelength for the four biofuel combustion types: TSF, improved, chimney and charcoal (kiln). For the discussion of optical properties and their inter stove/fuel comparison we use the 365 nm wavelength throughout the manuscript except during literature comparisons in which different wavelengths were reported (e.g., discussion of BrC k). Note that BrC properties at other wavelengths can be calculated using the AAE values discussed below. Additionally, MACbulk of BrC samples showed strong positive correlations between wavelengths (Figure S10). shows that the BrC MACbulk,365 of samples vary between our four biofuel combustion categories. Mean MACbulk,365 was the highest for ‘TSF’, followed by ‘improved’, ‘chimney’, and ‘charcoal’. Although mean MACbulk,365 of ‘improved’ was lower than ‘TSF’, their MACbulk,365 distributions were not significantly different. However, MACbulk,365 distributions of ‘chimney’ and ‘charcoal’ were significantly different than these two non-chimney stove types (‘TSF’ and ‘improved’). For example, mean MACbulk,365 of ‘chimney’ and ‘charcoal’ were 23% (19%) and 30% (27%) lower (p < 0.05) than ‘TSF’ (‘improved’) respectively. These percentages were different for other wavelengths as explained by the wavelength dependence of BrC MACbulk (i.e., AAE). High AAE values (>5.5) of the extracted organic samples indicated strong wavelength dependence of brown carbon absorption (). Mean AAE was the highest for ‘chimney’, followed by ‘charcoal’, ‘improved’ and ‘TSF’ groups. Mean AAE of ‘chimney’ was 10%, 16% and 23% higher (p < 0.05) than those for ‘charcoal’, ‘improved’ and ‘TSF’ respectively. AAE at group levels was anti-correlated with MAC, consistent with other observations that more absorbing BrC has flatter absorption spectra (Cheng et al. Citation2020; Saleh, Cheng, and Atwi Citation2018).
shows the Abs. EF of samples from the biofuel sources at 365 nm. We observe differences in Abs. EFs across biofuel combustion types. Mean Abs. EF showed a decreasing trend from non-chimney stoves (‘TSF’ and ‘improved’) to ‘chimney’ to ‘charcoal’. For example, mean Abs. EF of ‘chimney’ and ‘charcoal’ samples were 63% (49%) and 74% (63%) lower (p < 0.05) than those of TSF (improved) samples, respectively. Like MACbulk, we did not observe significant difference in Abs. EF distributions between the non-chimney stoves (e.g., ‘TSF’ and ‘improved’). Abs. EF distributions for other wavelengths display similar trends (Figure S11).
The calculated BrC k values of the samples (Figure S12) vary across combustion types in a manner similar to MACbulk, as expected from the relation between k and MACbulk (EquationEquation (3)(3)
(3) ). Note that for the BrC k discussion and literature comparison, instead of 365 nm, we used 551 nm wavelength (the spectrophotometer we used had 3 nm reporting resolution and doesn’t report at 550 nm) as the studies we compared our results with mostly had k reported at 550 nm. k551 shows strong negative correlation with wavelength dependence, w (=AAE − 1) in the visible spectrum (). This inverse relationship between k551 and w suggests that less wavelength dependent BrC has higher light absorptivity. The observed strong wavelength dependence of BrC k in the visible spectrum in this study is consistent with the literature (Saleh Citation2020; Saleh, Cheng, and Atwi Citation2018; Sengupta et al. Citation2018). ‘k550 − w pair’ values from biofuel combustion in this study lie between smoldering biomass burning and high temperature biomass combustion zones mapped in a recent review study (Saleh Citation2020) and recreated in . BrC is categorized into four classes based on k550 − w pairs in that study and our BrC falls into the ‘weakly absorbing BrC’ class bounded by k550 of 10−3–10−2 and w of 4–7. Another study (Lu et al. Citation2015) also summarized k550 and wavelength dependence (w) values of BrC from biomass and biofuel burning, and proposed least square exponential fits between k550 and w for two cases: bulk OA and the highly absorbing part of OA. Our k551 values lie between these two fit lines for the respective w values (). k550 and w values of BrC from lab cookstove tests (Xie et al. Citation2018), shown in Saleh (Citation2020), had higher k550 and lower w values (fell into ‘high-temperature biomass combustion’ zone) than the in-field stove test samples of our study, indicating that BrC from lab stove tests was more light absorbing that that from field tests. This is interesting since OC EFs from in-field stove tests are typically found to be higher than those from lab tests (Grieshop et al. Citation2017; Wathore, Mortimer, and Grieshop Citation2017; Roden et al. Citation2009). This can be explained by the fact that in-field stoves usually exhibit lower efficiency burning (relative to lab combustion), leading to more smoldering/higher OC emissions. However, our results suggest that this OC is less light-absorbing (lower kOA and higher w) than that produced during lab tests. This low absorption bias of BrC of our in-field biofuel combustion samples may also be partially due to methanol-insoluble BrC missed during our extraction.
3.2.1. Comparison with BrC properties in the literature
BrC MACbulk from lab (and some in-field) cookstove tests are higher than that of in-field stove test samples of this study. For example, mean TSF MACbulk measured at 360 nm in a field study of brushwood burned in a traditional stove (Fleming et al. Citation2018) was 85% higher than mean MACbulk of TSF samples at 365 nm in this study. In addition, lab testing of TSF stoves (Xie et al. Citation2018) found a 51% higher mean MACbulk,365 than this study. However, MACbulk,365 for laboratory-simulated biomass-burning emissions (Xie, Hays, and Holder Citation2017) was lower than our MACbulk of TSF samples. A previous lab study (Xie et al. Citation2018) found mean MACbulk for improved biomass stoves (Envirofit, Eco-chulha) 2–5 times higher than for our in-field improved stove (Envirofit, Prakti) samples. MACbulk,365 are highly distinct for charcoal production (here) and during combustion in a charcoal stove. The charcoal combustion samples from Xie et al. (Citation2018) had mean MACbulk, 365 of ∼2 m2 g−1, 40% higher than our charcoal kiln samples. However, MACbulk values from biomass pyrolysis (0.61 ± 0.29 m2 g−1 at 400 nm) observed in a lab study (Chen and Bond Citation2010) were in line with those from our charcoal kiln samples (0.65 ± 0.07 m2 g−1 at 401 nm), which were predominantly sampling pyrolysis emissions.
The calculated AAE values of BrC samples in this study were also somewhat different than the similar stove models tested in other studies. For example, mean AAE of TSF stove samples in this study (6.4 ± 0.6) was within 6–15% of those measured in field studies in India (Pandey et al. Citation2020; Fleming et al. Citation2018). Mean AAE estimated in a lab study (Xie et al. Citation2018) from TSF stove samples was also within 10% of what we observed in this study. For the improved stove samples, our average AAE value (6.8 ± 0.6) was similar in magnitude to Envirofit stoves but higher than the EcoChulha stoves tested in the same lab study (Xie et al. Citation2018).
BrC k values in this study (Figure S12) are in agreement with k values observed during smoldering/pyrolysis and high temperature biomass combustions in some previous studies. k values of BrC from smoldering combustion of some peat species (Sengupta et al. Citation2018; Sumlin et al. Citation2018; Chakrabarty et al. Citation2016), converted to 550 nm by (Saleh Citation2020), were similar in magnitude to k550 of ‘chimney’, ‘improved’ and ‘charcoal’ samples of this study, although k550 from pine needle smoldering (Browne et al. Citation2019) was smaller than ours. TSF k550 (0.0069 ± 0.0027) values from our study were in line with high temperature burning of biomass species in previous studies (McClure et al. Citation2020; Saleh et al. Citation2014). However, mean k550 of ‘TSF’ in this study was lower than those from high flame combustion of biomass observed in several studies (McClure et al. Citation2020; Kumar et al. Citation2018; Sengupta et al. Citation2018; Xie et al. Citation2018; Saleh et al. Citation2014; Kirchstetter, Novakov, and Hobbs Citation2004). Overall, BrC samples of our in-field study were more (less) absorbing and less (more) wavelength dependent than laboratory open biomass (cookstove) emission samples, suggesting they are intermediate to these categories. In the next two sections, we explore the links between BrC absorption properties with combustion conditions and sample characteristics to understand this variation.
3.3. Dependence of BrC light-absorption properties on combustion conditions
MACbulk shows positive correlation with EC/OA at wavelengths below 450 nm, with the correlation weakening at higher wavelengths. The correlation we observe at 365 nm wavelength () is weaker than for lab stove test samples (Xie et al. Citation2018) for a similar wavelength range. For example, the correlation coefficient between MACbulk,365 and EC/OA obtained for the lab samples was 0.73 versus 0.48 in our study. However, our study samples present a wider range of EC/OA and associated MACbulk values than their study, which should better represent the range of ‘real-world’ emissions. In contrast to lab stove tests, open biomass burning in the lab (Xie, Hays, and Holder Citation2017) showed weaker correlation between MACbulk,365 and EC/OA (r = 0.24) relative to our data. AAE values in this study do not show any trend with EC/OA, unlike lab studies where weak to moderate negative correlations were observed for stove tests and biomass burning (Xie, Hays, and Holder Citation2017, Xie et al. Citation2018)
shows MCE and MACbulk,365 values in our study, which cover a wider range than those in the lab cookstove study (Xie et al. Citation2018). We see a weak positive correlation between MACbulk and MCE throughout the wavelength spectra (r < 0.30), indicating that MCE is a weaker indicator, compared to EC/OC, of the influence of burn conditions on brown carbon production. Figure S13 also illustrates the same finding. This finding is consistent with the lab study, in which MACbulk correlates more strongly with OC/EC than MCE. However, that lab study showed stronger correlation than our study, possibly due to having a set of very high MCE tests (>0.99) from an improved biomass stove (EcoChula), with higher MACbulk values. Like EC/OA, MCE does not show an association with AAE.
3.4. Link between volatility and BrC properties
Volatility of OC has been found to be associated with its light absorption properties with less volatile BrC being highly light absorptive (McClure et al. Citation2020; Saleh et al. Citation2014; Saleh, Cheng, and Atwi Citation2018), with volatility indicated by thermodenuder treatment (heating to 100–400 °C). Ma et al. (Citation2016) observed a link between volatility and ‘OC peaks’ (relative contribution from different temperature steps during thermo-optical analysis) from the OC-EC analyzer and hence, we explored whether OC peaks are indicators of BrC light absorption. Our OC-EC analysis employed a temperature protocol that measures OC at five, increasing temperature steps (Table S1). The OC1 peak evolves during the lowest temperature step and is considered the most volatile OC fraction, whereas the OC4 peak is thought to be the least volatile as it is associated with the two highest temperature steps. Note that the temperature protocol used in our OC-EC analyses (Table S1) was developed for the highly loaded biomass burning emission samples tested here (to avoid detector saturation and avoid OC charring or early evolution of EC) and does not match protocols commonly used for ambient samples (e.g., CSN, IMPROVE_A). The temperature set points in our protocol are most similar to the EUSAAR protocol (Cavalli et al. Citation2010). Therefore, the peaks defined here are not directly transferable across analysis protocols but may provide insight into the links between volatility and absorption. and S14 show the association between MACbulk,365 and OC fractions (e.g., OC1/total OC). We observe moderately strong negative correlation (r = −0.44) between OC1 fraction and MACbulk,365. In contrast, OC3 and OC4 fractions show moderately strong positive correlations with MACbulk,365 (r = 0.47 and 0.36, respectively). These observations are consistent with the less volatile components, which evolve from the filter at higher temperatures, being associated with higher specific absorption. The direction of the relationship between OC fractions and MACbulk remains the same for other wavelengths, though the magnitude of correlation coefficients varies (Table S2). Note that and S14 are based on transmittance based OC-EC measurement. The OC-EC analyzer we used also offers reflectance based measurements and the association between MACbulk and OC fractions defined using laser reflectance outputs was similar to that for transmittance (Table S3). Like MACbulk, AAE also shows association with OC fractions but in the opposite direction (Table S3), with AAE positively correlated with OC1 fraction, and negatively correlated with OC3 and OC4 fractions. The direction of associations between BrC light absorption properties (MACbulk, AAE) and OC fractions suggests that OC peaks can be linked to volatility, and supports the finding that less volatile BrC has high light absorptivity and lower wavelength dependence (). Note that attempts at multivariate analyses including OC fractions, stove types and combustion properties (MCE, EC/OA) as covariates lead to only minor differences in explanatory power of MACbulk and AAE, and so are not discussed here.
3.5. Relative absorption and radiative effect of BrC
3.5.1. Relative absorption of BrC
Figure S15a shows the relative contribution of BrC to total light absorption by PM at 365 nm estimated using Mie modeling for three different mixing state scenarios (100%, 50% and 0% external mixing) as discussed in Sec. 2.5. For all scenarios, the BrC contribution is highly variable, but the range of BrC contributions decrease sharply with reduced assumed external mixing (Figure S15a). For example, average BrC contributions for the 100%, 50%, and 0% external mixing scenarios are 79%, 59%, and 48%, respectively. Decreased external mixing corresponds to more internally mixed particles (BrC in core-shell configuration with BC), which causes absorption enhancement of BC by lensing, and thus decreases the relative contribution of BrC to total absorption. However, note that even though relative the BrC contribution drops with decreased external mixing, the absolute absorption by BrC does not drop; the absolute absorption by BC increases and the overall absorption (BC + OA) increases, as shown in Figure S16. The absorption contribution of BrC samples categorized by the MCE threshold (discussed in Sec. 2.5) is shown in Figure S15b. Although the BrC contribution is highly variable for both categories, the samples with MCE < 0.95 tend to show higher contribution than that of MCE > 0.95. For example, BrC contribution varies between 37% and 95% for MCE < 0.95 category, while for MCE > 0.95, it ranges from 10% to 80%. This is because samples with MCE < 0.95 had greater contributions from smoldering combustion, which likely produced more externally mixed BrC (80%–100%) than that from flaming dominated combustion (MCE > 0.95) (Ting et al. Citation2018).
The values of relative BrC absorption observed in this study are in line with literature values. For example, the average BrC contribution for the 50% and 0% external mixing cases are consistent with results from previous lab studies that apportioned BrC contribution in savanna and wood burning smoke for similar wavelength ranges (Kirchstetter and Thatcher Citation2012; Kirchstetter, Novakov, and Hobbs Citation2004). The average BrC contribution for 100% external mixing at 551 nm (40%) also lies within the range of average values (30%–41%) reported by another field cookstove study (Pandey et al. Citation2020) for different BC AAEs (0.9–1.5) at 550 nm. However, note that a mixing state assumption was not explicitly stated in these other studies.
The variation in BrC contribution we observed in Figure S15 is correlated with the EC/OA of samples. Figure S17 shows the percentage of BrC absorption at 365 nm against EC/OA for the different external mixing scenarios. EC/OA shows a strong negative correlation (r = −0.90 to −0.93) with BrC contribution for 0%, 50% and 100% external mixing scenarios, indicating that BrC contribution to total absorption increases as the amount of organic carbon increases (relative to EC). A lab study (Pokhrel et al. Citation2017) also found a strong negative association between percentage of BrC absorption and EC/OA (r = −0.72 to −0.86 at 532 nm) in biomass burning emissions. Although BrC specific absorption shows a weak positive association with EC/OA (), the trend shown in Figure S17 is dominated by the overall decrease in BrC mass fraction. Like EC/OA, MCE also shows moderate negative correlation with percentage of BrC absorption in all mixing state scenario (r = −0.50 to −0.56) (Figure S18), indicating that higher MCE disfavors the formation of OC and increases EC/OA, which in turn lowers the relative BrC contribution.
3.5.2. Radiative effect
Figure S19 shows the integrated (240–800 nm) SFE of BrC absorption (difference between ‘BC with absorptive OC’ and ‘BC with clear OC’) over ground for different external mixing scenarios, expanding on the analysis of Saleh et al. (Citation2014). It should be noted that the comparison with ‘clear OC’ is not to suggest that any of these emissions are actually clear, but to isolate the impact of the measured absorption properties of this OC relative to a baseline (often made) assumption of non-absorbing OC. SFE values vary widely across samples for all mixing scenarios. SFE values of all samples are positive and show a decreasing trend with the decrease in external mixing percentages. For example, average integrated BrC SFE for the 100%, 50% and 0% external mixing are 13.1, 10.3, and 8.7 W g−1, respectively.
shows the simplified DRE/DREBC of the samples for the 50% external mixing scenario with both light absorbing and ‘clear’ OC. We see a gradual increase in the DRE/DREBC with the increase in EC/OA, and the ratio transits from DRE/DREBC < 0 (likely cooling) to DRE/DREBC > 0 (likely warming). Samples from both traditional and improved stoves show a similar trend, although DRE ratios of traditional stove samples are substantially higher than those of improved stoves, especially at lower EC/OA. The differences in DRE ratio between the ‘BC core with absorptive OC coating’ case and the ‘BC core with clear OC coating’ case in indicate the contribution of BrC absorption to the DRE ratio, which shows a decreasing trend with the increase in EC/OA. Due to the BrC contribution, ‘BC core with absorptive OC coating’ case transitions from DRE/DREBC < 0 to DRE/DREBC > 0 at a smaller EC/OA (∼0.1) relative to the ‘BC core with clear OC coating’ case (EC/OA ∼ 0.2), indicating the potential of BrC absorption to influence overall warming. also shows the DRE ratios from a lab biomass burning study (Saleh et al. Citation2014), where a similar trend of DRE ratio against EC/OA to our study is observed. However, their transition from DRE/DREBC < 0 to DRE/DREBC > 0 due to BrC occurs at a smaller EC/OA (∼0.06) than our study. Further, this study mentions 0.05 to 0.1 values as the atmospherically relevant EC/OA range; however, our study shows that EC/OA from ‘real-world’ biofuel combustion extends beyond that range and that transition from DRE/DREBC < 0 to DRE/DREBC > 0 due to BrC may occur above that range. Figure S20 in the SI, similar to , shows the simplified DRE ratios for the 100% external mixing scenario. We observe a similar trend of DRE/DREBC against EC/OA to that for the 50% external mixing case, although the transition occurs at a higher EC/OA (relative to 50% external mixing). Simplified DRE/DREBC of the samples categorized by MCE are shown in for the variable mixing state approach (i.e., 90% external mixing for MCE < 0.95, and 50% external mixing for MCE > 0.95). Most of the samples from flaming dominated combustion (MCE > 0.95) show transitions from DRE/DREBC < 0 to DRE/DREBC > 0 due to the BrC absorption contribution, while samples from smoldering combustion (MCE < 0.95) shows this transition only when EC/OA is higher than 0.13. Therefore, both BrC properties and mixing state moderate the DRE impacts of biofuel combustion emissions.
Figure 4. DRE/DREBC vs. EC/OA (a) for TSF and improved stove samples for the 50% external mixing scenario, and (b) for the same samples as subplot (a) but categorized by a MCE threshold of 0.95. Two different mixing state assumptions were applied in subplot (b) for two MCE based categories: 90% external mixing for MCE <0.95 and 50% external mixing for MCE > 0.95. Brown and green markers indicate the DRE ratio for BC core with absorptive OC coating and with clear coating respectively, and the brown vertical line denotes the effect of inclusion of BrC absorption on the ratio. The red horizontal line (at DRE ratio = 0) demarcates DRE ratio < 0 (OC reduces DRE) and > 0 (OC increases DRE). The brown and green curves in subplot (a) are adapted from the study of Saleh et al. (Citation2014) of biomass burning emissions and represent the same coating scenarios as brown and green markers, respectively.
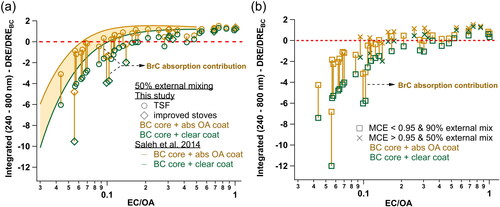
Figure 5. Spatial distribution of DRE of PM emitted from TSF stoves over India for (a) PM with BrC absorption, (b) PM without BrC absorption, and (c) BrC absorption for the ‘flaming-dominated’ 50% external mixing scenario. Subplot d, e and f are the same as a, b and c, respectively, but for the smoldering-dominated’ 90% external mixing scenario.
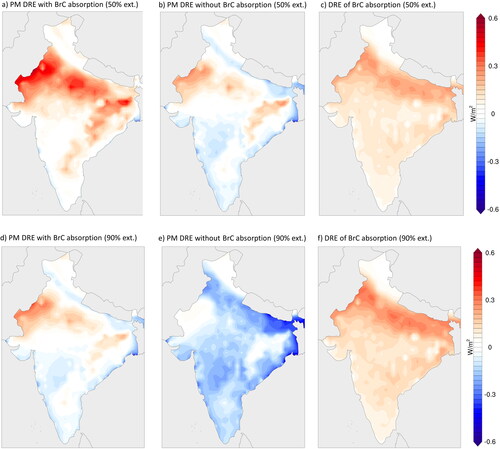
To demonstrate the potential for large impacts on DRE of residential combustion BrC emissions, show estimated DRE of PM emitted from TSF stoves over India with light absorbing OC (i.e., BrC) and clear OC, respectively, assuming 50% external mixing. shows the DRE of BrC absorption, calculated as the difference between the DRE values in . In general, TSF PM exerts a stronger radiative effect (larger positive DRE values) over Northern India compared to Southern India mainly due to the higher levels of residential burning emissions. The spatial variability in DRE is also partially driven by differences in surface albedo, with the smallest DRE being associated with regions that have smallest surface albedo (Figure S6). Furthermore, illustrates the important effect of BrC absorption, which contributes up to +0.3 W/m2 over Northern India (), approximately half of the overall DRE of TSF PM (). f display the same as c, respectively, but for a 90% external mixing scenario. This smoldering dominated scenario has lower DRE both with and without the BrC contribution () relative to flaming dominated scenario (), but interestingly the DRE of BrC panels (), which indicate the net contribution from BrC absorption, are similar. This suggests that the influence of BrC absorption and mixing state are—to some degree—decoupled when considering the net DRE. A figure similar to but using the improved stoves data (Figure S21), indicates a slightly higher BrC contribution to PM DRE from improved stove samples relative to TSF.
4. Conclusion
This study presents optical properties of methanol-extracted BrC from ‘real-world’ biofuel combustion emission samples. MACbulk and AAE of BrC samples varied across four diverse biofuel combustion sources, indicating the importance of a source-specific inventory of BrC optical properties. A moderate positive correlation between BrC MACbulk and EC/OA suggests a link between BrC light-absorption properties and combustion conditions even in highly variable ‘real-world’ combustion conditions. Note that this relation was observed previously only for lab based stove and biomass burning studies (Xie, Hays, and Holder Citation2017; Xie et al. Citation2018; Pokhrel et al. Citation2016; Lu et al. Citation2015). This study, like prior studies (Xie et al. Citation2018; Pokhrel et al. Citation2016), also suggests that EC/OA is a better proxy of combustion conditions than MCE to parameterize optical properties. Additionally, observed associations between OC peak fractions and BrC light absorption properties (MACbulk, AAE) suggest that less volatile BrC has higher light absorptivity, consistent with other studies (McClure et al. Citation2020; Saleh et al. Citation2014; Saleh, Cheng, and Atwi Citation2018). Overall, our analyses indicate that BrC light-absorption properties can be partially predicted based on factors that are easily available from emission measurements (e.g., combustion conditions, OC fractions in thermal-optical OC-EC measurements). Based on BrC classification via k550 − w pairs (Saleh Citation2020), our BrC samples fall into the smoldering combustion zone (), unlike lab stove samples that were dominated by high temperature combustion. This finding indicates the importance of performing in-field stove testing along with lab testing to understand the BrC properties in emissions under highly variable ‘real-world’ conditions.
EC/OA showed positive association with BrC MACbulk and negative association with the relative contribution of BrC to aerosol absorption, suggesting that though the BrC becomes darker (more light absorbing) when the relative amount of BC (to OC) increases, the variation in BrC absorption is driven by the relative amount of OC. A lab biomass burning study (Pokhrel et al. Citation2017) also arrived at the same conclusion. Lack of BC-OC mixing state information can lead to some uncertainty as demonstrated by a factor of ∼2.5 variation in mean relative BrC absorption across mixing state assumptions (0% vs. 100% external mixing). However, this factor reduces to ∼1.6 when we categorized our samples based on MCE following the observations of Ting et al. (Citation2018), and used 50% and 90% external mixing as the central estimates for flaming- and smoldering-dominated combustion, respectively. Note that previous studies (Stevens and Dastoor Citation2019; Pokhrel et al. Citation2017) reported a factor of up to 4.3 variation in BrC absorption contribution across methods used to differentiate BrC from BC. Our samples from biofuel emissions also showed that BrC absorption can transition net radiative forcing from cooling to warming relative to non-absorbing OC. Finally, estimates of annual average DRE calculations over the Indian subcontinent suggest that the radiative warming contributed by BrC absorption from residential biofuel combustion emissions is in the same range as that from the co-emitted BC. Overall, this suggests that BrC should be treated as a major player along with BC in understanding the direct radiative effect of household combustion emissions.
Supplemental Material
Download MS Word (5.2 MB)Acknowledgments
We thank Dr. Rob Bailis from Stockholm Environment Institute for the overall management of the project from which India samples were derived. We are grateful to Grishma Jain, Karthik S, Roshan Wathore and to the numerous field staff involved in this project for their support. We deeply thank all community households in rural Kullu and Koppal for allowing us to conduct testing in their kitchens. We also thank partner NGOs (Samuha and Jagriti) for their support and collaboration. We thank Ashley Bittner from NCSU for providing charcoal kiln filter samples and supporting data for analysis, Twapa Ghambi for support during kiln measurements and community members in Mikundi, Malawi for facilitating this sampling. Finally, we thank Andrew Whitesell from North Carolina State University and Alyssa Sanderson from Michigan State University for their work on filter preparation and analysis.
Disclosure statement
This article has not been formally reviewed by EPA and NSF. The views expressed are solely those of the authors and do not necessarily reflect those of the Agency or Foundation. EPA and NSF do not endorse any products or commercial services mentioned in this publication.
Additional information
Funding
References
- Adler, G., N. L. Wagner, K. D. Lamb, K. M. Manfred, J. P. Schwarz, A. Franchin, A. M. Middlebrook, R. A. Washenfelder, C. C. Womack, R. J. Yokelson, et al. 2019. Evidence in biomass burning smoke for a light-absorbing aerosol with properties intermediate between brown and black carbon. Aerosol Sci. Technol. 53 (9):976–89. doi: 10.1080/02786826.2019.1617832.
- Andreae, M. O., and A. Gelencsér. 2006. Black carbon or brown carbon? The nature of light-absorbing carbonaceous aerosols. Atmos. Chem. Phys. 6 (10):3131–48. doi: 10.5194/acp-6-3131-2006.
- Bertschi, I., R. J. Yokelson, D. E. Ward, R. E. Babbitt, R. A. Susott, J. G. Goode, and W. M. Hao. 2003. Trace gas and particle emissions from fires in large diameter and belowground biomass fuels. J. Geophys. Res. 108 (D13):8472. doi: 10.1029/2002JD002100.
- Bond, T. C., and R. W. Bergstrom. 2006. Light absorption by carbonaceous particles: An investigative review. Aerosol. Sci. Technol. 40 (1):27–67. doi: 10.1080/02786820500421521.
- Bond, T. C., D. G. Streets, K. F. Yarber, S. M. Nelson, J.-H. Woo, and Z. Klimont. 2004. A technology-based global inventory of black and organic carbon emissions from combustion. J. Geophys. Res. 109 (D14):D14203. doi: 10.1029/2003JD003697.
- Bond, T. C., G. Habib, and R. W. Bergstrom. 2006. Limitations in the enhancement of visible light absorption due to mixing state. J. Geophys. Res. 111:D20211. doi: 10.1029/2006JD007315.
- Bond, T. C., S. J. Doherty, D. W. Fahey, P. M. Forster, T. Berntsen, B. J. DeAngelo, M. G. Flanner, S. Ghan, B. Kärcher, D. Koch, et al. 2013. Bounding the role of black carbon in the climate system: A scientific assessment. J. Geophys. Res. Atmos. 118 (11):5380–552. doi: 10.1002/jgrd.50171.
- Browne, E. C., X. Zhang, J. P. Franklin, K. J. Ridley, T. W. Kirchstetter, K. R. Wilson, C. D. Cappa, and J. H. Kroll. 2019. Effect of heterogeneous oxidative aging on light absorption by biomass burning organic aerosol. Aerosol. Sci. Technol. 53 (6):663–74. doi: 10.1080/02786826.2019.1599321.
- Cavalli, F., M. Viana, K. E. Yttri, J. Genberg, and J.-P. Putaud. 2010. Toward a standardised thermal-optical protocol for measuring atmospheric organic and elemental carbon: The EUSAAR protocol. Atmos. Meas. Tech. 3 (1):79–89. doi: 10.5194/amt-3-79-2010.
- Chafe, Z. A., M. Brauer, Z. Klimont, R. Van Dingenen, S. Mehta, S. Rao, K. Riahi, F. Dentener, and K. R. Smith. 2014. Household cooking with solid fuels contributes to ambient PM2.5 air pollution and the burden of disease. Environ. Health Perspect. 122 (12). doi: 10.1289/ehp.1206340.
- Chakrabarty, R. K., M. Gyawali, R. L. N. Yatavelli, A. Pandey, A. C. Watts, J. Knue, L.-W. A. Chen, R. R. Pattison, A. Tsibart, V. Samburova, et al. 2016. Brown carbon aerosols from burning of boreal peatlands: Microphysical properties, emission factors, and implications for direct radiative forcing. Atmos. Chem. Phys. 16 (5):3033–40. doi: 10.5194/acp-16-3033-2016.
- Champion, W. M., and A. P. Grieshop. 2019. Pellet-fed gasifier stoves approach gas-stove like performance during in-home use in Rwanda. Environ. Sci. Technol. 53 (11):6570–9. doi: 10.1021/acs.est.9b00009.
- Chen, Y., and T. C. Bond. 2010. Light absorption by organic carbon from wood combustion. Atmos. Chem. Phys. 10 (4):1773–87. doi: 10.5194/acp-10-1773-2010.
- Cheng, Y., K. He, Z. Du, G. Engling, J. Liu, Y. Ma, M. Zheng, and R. J. Weber. 2016. The characteristics of brown carbon aerosol during winter in Beijing. Atmos. Environ. 127:355–64. doi: 10.1016/j.atmosenv.2015.12.035.
- Cheng, Z., K. Atwi, O. E. Hajj, I. Ijeli, D. A. Fischer, G. Smith, and R. Saleh. 2020. Discrepancies between brown carbon light-absorption properties retrieved from online and offline measurements. Aerosol. Sci. Technol. 55 (1):92–103. doi: 10.1080/02786826.2020.1820940.
- Corbin, J. C., H. Czech, D. Massabò, d. M. F. Buatier, G. Jakobi, F. Liu, P. Lobo, C. Mennucci, A. A. Mensah, J. Orasche, et al. 2019. Infrared-absorbing carbonaceous tar can dominate light absorption by marine-engine exhaust. NPJ Clim. Atmos. Sci. Lond. 2:12. doi: 10.1038/s41612-019-0069-5.
- Eilenberg, S. R., K. R. Bilsback, M. Johnson, J. K. Kodros, E. M. Lipsky, A. Naluwagga, K. M. Fedak, M. Benka-Coker, B. Reynolds, J. Peel, et al. 2018. Field measurements of solid-fuel cookstove emissions from uncontrolled cooking in China, Honduras, Uganda, and India. Atmos. Environ. 190:116–25. doi: 10.1016/j.atmosenv.2018.06.041.
- Fleming, L. T., P. Lin, A. Laskin, J. Laskin, R. Weltman, R. D. Edwards, N. K. Arora, A. Yadav, S. Meinardi, D. R. Blake, et al. 2018. Molecular composition of particulate matter emissions from dung and brushwood burning household cookstoves in Haryana, India. Atmos. Chem. Phys. 18 (4):2461–80. doi: 10.5194/acp-18-2461-2018.
- Gelaro, R., W. McCarty, M. J. Suárez, R. Todling, A. Molod, L. Takacs, C. A. Randles, A. Darmenov, M. G. Bosilovich, R. Reichle, et al. 2017. The modern-era retrospective analysis for research and applications, version 2 (MERRA-2). J. Clim. 30 (14):5419–54. doi: 10.1175/JCLI-D-16-0758.1.
- Grieshop, A. P., G. Jain, K. Sethuraman, and J. D. Marshall. 2017. Emission factors of health- and climate-relevant pollutants measured in home during a carbon-finance-approved cookstove intervention in rural India. GeoHealth 1 (5):222–36. doi: 10.1002/2017GH000066.
- Islam, M. M., R. Wathore, H. Zerriffi, J. D. Marshall, R. Bailis, and A. P. Grieshop. 2021. In-use emissions from biomass and LPG stoves measured during a large, multi-year cookstove intervention study in rural India. Sci. Total Environ. 758:143698. doi: 10.1016/j.scitotenv.2020.143698.
- Jetter, J. J., and P. Kariher. 2009. Solid-fuel household cook stoves: Characterization of performance and emissions. Biomass Bioenergy 33 (2):294–305. doi: 10.1016/j.biombioe.2008.05.014.
- Jetter, J., Y. Zhao, K. R. Smith, B. Khan, T. Yelverton, P. DeCarlo, and M. D. Hays. 2012. Pollutant emissions and energy efficiency under controlled conditions for household biomass cookstoves and implications for metrics useful in setting international test standards. Environ. Sci. Technol. 46 (19):10827–34. doi: 10.1021/es301693f.
- Johnson, M. A., C. R. Garland, K. Jagoe, R. Edwards, J. Ndemere, C. Weyant, A. Patel, J. Kithinji, E. Wasirwa, T. Nguyen, et al. 2019. In-home emissions performance of cookstoves in Asia and Africa. Atmosphere 10 (5):290. doi: 10.3390/atmos10050290.
- Johnson, M., R. Edwards, C. Alatorre Frenk, and O. Masera. 2008. In-field greenhouse gas emissions from cookstoves in rural Mexican households. Atmos. Environ. 42 (6):1206–22. doi: 10.1016/j.atmosenv.2007.10.034.
- Keita, S., C. Liousse, V. Yoboué, P. Dominutti, B. Guinot, E.-M. Assamoi, A. Borbon, S. L. Haslett, L. Bouvier, A. Colomb, et al. 2018. Particle and VOC emission factor measurements for anthropogenic sources in West Africa. Atmos. Chem. Phys. 18 (10):7691–708. doi: 10.5194/acp-18-7691-2018.
- Kirchstetter, T. W., and T. L. Thatcher. 2012. Contribution of organic carbon to wood smoke particulate matter absorption of solar radiation. Atmos. Chem. Phys. 12 (14):6067–72. doi: 10.5194/acp-12-6067-2012.
- Kirchstetter, T. W., T. Novakov, and P. V. Hobbs. 2004. Evidence that the spectral dependence of light absorption by aerosols is affected by organic carbon. J. Geophys. Res. 109 (D21). doi: 10.1029/2004JD004999.
- Kumar, N. K., J. C. Corbin, E. A. Bruns, D. Massabó, J. G. Slowik, L. Drinovec, G. Močnik, P. Prati, A. Vlachou, U. Baltensperger, et al. 2018. Production of particulate brown carbon during atmospheric aging of residential wood-burning emissions. Atmos. Chem. Phys. 18 (24):17843–61. doi: 10.5194/acp-18-17843-2018.
- Lacaux, J.-P., D. Brocard, C. Lacaux, R. Delmas, A. Brou, V. Yoboué, and M. Koffi. 1994. Traditional charcoal making: An important source of atmospheric pollution in the African Tropics. Atmos. Res. 35 (1):71–6. doi: 10.1016/0169-8095(94)90073-6.
- Lack, D. A., and C. D. Cappa. 2010. Impact of brown and clear carbon on light absorption enhancement, single scatter albedo and absorption wavelength dependence of black carbon. Atmos. Chem. Phys. 10 (9):4207–20. doi: 10.5194/acp-10-4207-2010.
- Liu, J., M. Bergin, H. Guo, L. King, N. Kotra, E. Edgerton, and R. J. Weber. 2013. Size-resolved measurements of brown carbon in water and methanol extracts and estimates of their contribution to ambient fine-particle light absorption. Atmos. Chem. Phys. 13 (24):12389–404. doi: 10.5194/acp-13-12389-2013.
- Lu, Z., D. G. Streets, E. Winijkul, F. Yan, Y. Chen, T. C. Bond, Y. Feng, M. K. Dubey, S. Liu, J. P. Pinto, et al. 2015. Light absorption properties and radiative effects of primary organic aerosol emissions. Environ. Sci. Technol. 49 (8):4868–77. doi: 10.1021/acs.est.5b00211.
- Ma, J., X. Li, P. Gu, T. R. Dallmann, A. A. Presto, and N. M. Donahue. 2016. Estimating ambient particulate organic carbon concentrations and partitioning using thermal optical measurements and the volatility basis set. Aerosol. Sci. Technol. 50 (6):638–51. doi: 10.1080/02786826.2016.1158778.
- McClure, C. D., C. Y. Lim, D. H. Hagan, J. H. Kroll, and C. D. Cappa. 2020. Biomass-burning-derived particles from a wide variety of fuels – Part 1: Properties of primary particles. Atmos. Chem. Phys. 20 (3):1531–47. doi: 10.5194/acp-20-1531-2020.
- McDuffie, E. E., S. J. Smith, P. O'Rourke, K. Tibrewal, C. Venkataraman, E. A. Marais, B. Zheng, M. Crippa, M. Brauer, and R. V. Martin. 2020. A global anthropogenic emission inventory of atmospheric pollutants from sector- and fuel-specific sources (1970–2017): An application of the Community Emissions Data System (CEDS). Earth Syst. Sci. Data 12 (4):3413–42. doi: 10.5194/essd-12-3413-2020.
- McMeeking, G. R., E. Fortner, T. B. Onasch, J. W. Taylor, M. Flynn, H. Coe, and S. M. Kreidenweis. 2014. Impacts of nonrefractory material on light absorption by aerosols emitted from biomass burning. J. Geophys. Res. Atmos. 119 (21):12272–286. doi: 10.1002/2014JD021750.
- Mitchell, E. J. S., Y. Ting, J. Allan, A. R. Lea-Langton, D. V. Spracklen, G. McFiggans, H. Coe, M. N. Routledge, A. Williams, and J. M. Jones. 2019. Pollutant emissions from improved cookstoves of the type used in sub-Saharan Africa. Combust. Sci. Technol. 192 (8):1582–602. doi: 10.1080/00102202.2019.1614922.
- Pandey, A., A. Hsu, S. Tiwari, S. Pervez, and R. K. Chakrabarty. 2020. Light absorption by organic aerosol emissions rivals that of black carbon from residential biomass fuels in South Asia. Environ. Sci. Technol. Lett. 7 (4):266–72. doi: 10.1021/acs.estlett.0c00058.
- Pandey, A., S. Patel, S. Pervez, S. Tiwari, G. Yadama, J. C. Chow, J. G. Watson, P. Biswas, and R. K. Chakrabarty. 2017. Aerosol emissions factors from traditional biomass cookstoves in India: Insights from field measurements. Atmos. Chem. Phys. 17 (22):13721–9. doi: 10.5194/acp-17-13721-2017.
- Pennise, D. M., K. R. Smith, J. P. Kithinji, M. E. Rezende, T. J. Raad, J. Zhang, and C. Fan. 2001. Emissions of greenhouse gases and other airborne pollutants from charcoal making in Kenya and Brazil. J. Geophys. Res. 106 (D20):24143–55. doi: 10.1029/2000JD000041.
- Pokhrel, R. P., E. R. Beamesderfer, N. L. Wagner, J. M. Langridge, D. A. Lack, T. Jayarathne, E. A. Stone, C. E. Stockwell, R. J. Yokelson, and S. M. Murphy. 2017. Relative importance of black carbon, brown carbon, and absorption enhancement from clear coatings in biomass burning emissions. Atmos. Chem. Phys. 17 (8):5063–78. doi: 10.5194/acp-17-5063-2017.
- Pokhrel, R. P., N. L. Wagner, J. M. Langridge, D. A. Lack, T. Jayarathne, E. A. Stone, C. E. Stockwell, R. J. Yokelson, and S. M. Murphy. 2016. Parameterization of single-scattering albedo (SSA) and absorption Ångström exponent (AAE) with EC/OC for aerosol emissions from biomass burning. Atmos. Chem. Phys. 16 (15):9549–61. doi: 10.5194/acp-16-9549-2016.
- Polidori, A., B. J. Turpin, C. I. Davidson, L. A. Rodenburg, and F. Maimone. 2008. Organic PM 2.5 : Fractionation by polarity, FTIR spectroscopy, and OM/OC ratio for the Pittsburgh aerosol. Aerosol. Sci. Technol. 42 (3):233–46. doi: 10.1080/02786820801958767.
- Reece, S. M., A. Sinha, and A. P. Grieshop. 2017. Primary and photochemically aged aerosol emissions from biomass cookstoves: Chemical and physical characterization. Environ. Sci. Technol. 51 (16):9379–90. doi: 10.1021/acs.est.7b01881.
- Roden, C. A., T. C. Bond, S. Conway, A. B. Osorto Pinel, N. MacCarty, and D. Still. 2009. Laboratory and field investigations of particulate and carbon monoxide emissions from traditional and improved cookstoves. Atmos. Environ. 43 (6):1170–81. doi: 10.1016/j.atmosenv.2008.05.041.
- Roden, C. A., T. C. Bond, S. Conway, and A. B. O. Pinel. 2006. Emission factors and real-time optical properties of particles emitted from traditional wood burning cookstoves. Environ. Sci. Technol. 40 (21):6750–7. doi: 10.1021/es052080i.
- Saleh, R. 2020. From measurements to models: Toward accurate representation of brown carbon in climate calculations. Curr. Pollut. Rep. 6:90–104. doi: 10.1007/s40726-020-00139-3.
- Saleh, R., C. J. Hennigan, G. R. McMeeking, W. K. Chuang, E. S. Robinson, H. Coe, N. M. Donahue, and A. L. Robinson. 2013. Absorptivity of brown carbon in fresh and photo-chemically aged biomass-burning emissions. Atmos. Chem. Phys. 13 (15):7683–93. doi: 10.5194/acp-13-7683-2013.
- Saleh, R., E. S. Robinson, D. S. Tkacik, A. T. Ahern, S. Liu, A. C. Aiken, R. C. Sullivan, A. A. Presto, M. K. Dubey, R. J. Yokelson, et al. 2014. Brownness of organics in aerosols from biomass burning linked to their black carbon content. Nature Geosci. 7 (9):647–50. doi: 10.1038/ngeo2220.
- Saleh, R., M. Marks, J. Heo, P. J. Adams, N. M. Donahue, and A. L. Robinson. 2015. Contribution of brown carbon and lensing to the direct radiative effect of carbonaceous aerosols from biomass and biofuel burning emissions. J. Geophys. Res. Atmos. 120 (19):10285–296. doi: 10.1002/2015JD023697.
- Saleh, R., Z. Cheng, and K. Atwi. 2018. The Brown–black continuum of light-absorbing combustion aerosols. Environ. Sci. Technol. Lett. 5 (8):508–13. doi: 10.1021/acs.estlett.8b00305.
- Sengupta, D., V. Samburova, C. Bhattarai, E. Kirillova, L. Mazzoleni, M. Iaukea-Lum, A. Watts, H. Moosmüller, and A. Khlystov. 2018. Light absorption by polar and non-polar aerosol compounds from laboratory biomass combustion. Atmos. Chem. Phys. 18 (15):10849–67. doi: 10.5194/acp-18-10849-2018.
- Shen, G., Y. Chen, C. Xue, N. Lin, Y. Huang, H. Shen, Y. Wang, T. Li, Y. Zhang, S. Su, et al. 2015. Pollutant emissions from improved coal- and wood-fuelled cookstoves in rural households. Environ. Sci. Technol. 49 (11):6590–8. doi: 10.1021/es506343z.
- Shetty, N. J., A. Pandey, S. Baker, W. M. Hao, and R. K. Chakrabarty. 2019. Measuring light absorption by freshly emitted organic aerosols: Optical artifacts in traditional solvent-extraction-based methods. Atmos. Chem. Phys. 19 (13):8817–30. doi: 10.5194/acp-19-8817-2019.
- Stevens, R., and A. Dastoor. 2019. A review of the representation of aerosol mixing state in atmospheric models. Atmosphere 10 (4):168. doi: 10.3390/atmos10040168.
- Sumlin, B. J., Y. W. Heinson, N. Shetty, A. Pandey, R. S. Pattison, S. Baker, W. M. Hao, and R. K. Chakrabarty. 2018. UV–Vis–IR spectral complex refractive indices and optical properties of brown carbon aerosol from biomass burning. J. Quant. Spectrosc. Radiat. Transf. 206:392–8. doi: 10.1016/j.jqsrt.2017.12.009.
- Sun, H., L. Biedermann, and T. C. Bond. 2007. Color of brown carbon: A model for ultraviolet and visible light absorption by organic carbon aerosol. Geophys. Res. Lett. 34 (17):L17813. doi: 10.1029/2007GL029797.
- Sun, J., G. Zhi, R. Hitzenberger, Y. Chen, C. Tian, Y. Zhang, Y. Feng, M. Cheng, Y. Zhang, J. Cai, F. Chen, Y. Qiu, et al. 2017. Emission factors and light absorption properties of brown carbon from household coal combustion in China. Atmos. Chem. Phys. 17 (7):4769–80. doi: 10.5194/acp-17-4769-2017.
- Ting, Y., E. J. S. Mitchell, J. D. Allan, D. Liu, D. V. Spracklen, A. Williams, J. M. Jones, A. R. Lea-Langton, G. McFiggans, and H. Coe. 2018. Mixing state of carbonaceous aerosols of primary emissions from “improved” African cookstoves. Environ. Sci. Technol. 52 (17):10134–43. doi: 10.1021/acs.est.8b00456.
- Wathore, R., K. Mortimer, and A. P. Grieshop. 2017. In-use emissions and estimated impacts of traditional, natural- and forced-draft cookstoves in rural Malawi. Environ. Sci. Technol. 51 (3):1929–38. doi: 10.1021/acs.est.6b05557.
- Weyant, C. L., P. Chen, A. Vaidya, C. Li, Q. Zhang, R. Thompson, J. Ellis, Y. Chen, S. Kang, G. R. Shrestha, et al. 2019. Emission measurements from traditional biomass cookstoves in South Asia and Tibet. Environ. Sci. Technol. 53 (6):3306–14. doi: 10.1021/acs.est.8b05199.
- Xie, M., G. Shen, A. L. Holder, M. D. Hays, and J. J. Jetter. 2018. Light absorption of organic carbon emitted from burning wood, charcoal, and kerosene in household cookstoves. Environ. Pollut. 240:60–7. doi: 10.1016/j.envpol.2018.04.085.
- Xie, M., M. D. Hays, and A. L. Holder. 2017. Light-absorbing organic carbon from prescribed and laboratory biomass burning and gasoline vehicle emissions. Sci. Rep. 7 (1):1–9. doi: 10.1038/s41598-017-06981-8.