
 ?Mathematical formulae have been encoded as MathML and are displayed in this HTML version using MathJax in order to improve their display. Uncheck the box to turn MathJax off. This feature requires Javascript. Click on a formula to zoom.
Abstract
Air filtration serves to reduce concentrations of particles in indoor environments. Most standalone, also referred to as portable or in-room, air filtration systems use HEPA filters, and cost generally scales with the clean air delivery rate. A “do-it-yourself” lower-cost alternative, known as the Corsi-Rosenthal Box, that uses MERV-13 filters coupled with a box fan has been recently proposed, but lacks systematic performance characterization. We have characterized the performance of a five-panel Corsi-Rosenthal air cleaner using both research-grade instrumentation (an aerodynamic particle sizer, APS) and a low-cost particle sensor. Measurements of size-resolved and overall decay rates of aerosol particles larger than 0.5 microns emitted into rooms of varying size with and without the air cleaner allowed for determination of the apparent clean air delivery rate—both as a function of size and integrated across particle sizes for a number-weighted median particle diameter of 1.2 ± 0.12 microns. The measurements made in the different rooms produced similar results, demonstrating the robustness of the method used. The size-integrated effective clean air delivery rate increases with fan speed, from about 600 to 850 ft3 min−1 (1019 to 1444 m3 h−1) as determined with the APS. The low-cost sensor yields similar clean air delivery rates as the APS, demonstrating a method by which others who lack access to research-grade instruments can determine the effectiveness of Corsi-Rosenthal Boxes that use components that differ from those used here. Overall, our results demonstrate that our Corsi-Rosenthal air cleaner efficiently reduces suspended particle concentrations in indoor environments.
EDITOR:
1. Introduction
Filtration is a robust and widely used method to reduce particle concentrations in indoor environments (Curtius, Granzin and Schrod Citation2021; Kelly and Fussell Citation2019; McNamara et al. Citation2017; Miller-Leiden et al. Citation1996). Particle filters can be embedded in ventilation systems or added as stand-alone, portable units within rooms (Alavy and Siegel Citation2020; Shaughnessy and Sextro Citation2006). Filters vary widely in their efficiency and are characterized by the minimum efficiency reporting value (MERV), with the highest efficiency filters referred to as high efficiency particulate air (HEPA) filters (ASHRAE Citation2017). Filter efficiency varies with particle size, and HEPA filters remove at least 99.97% of particles having diameters of 0.3 microns, which is typically where the minimum filter efficiency occurs. While ventilation systems rarely use HEPA filters, owing to the accompanying large pressure drop and space requirements, most commercial in-room filtration systems rely on HEPA filters (Shaughnessy and Sextro Citation2006). Various studies support the benefits of portable HEPA-based air cleaners for reducing aerosol concentrations from many sources, including reducing risks of COVID-19 transmission. For example, Liu et al. (Citation2021) reviewed portable HEPA-based air cleaners and concluded that such air cleaners have “potential to eliminate airborne SARS-CoV-2 and augment primary decontamination strategies such as ventilation.” Curtius, Granzin and Schrod (Citation2021) reached similar conclusions based on measurements of aerosol concentration reductions in a classroom. Additionally, portable HEPA-based air cleaners have been shown to significantly reduce concentrations of traffic-related aerosol concentrations in homes close to highways (Cox et al. Citation2018), improve clinical manifestations for patients with allergic rhinitis by reducing particulate matter and dust mite allergen concentrations in bedroom air (Luo et al. Citation2021), and reduce woodsmoke particles in wood-burning communities with measurable health benefits in relatively young and healthy subjects (Allen et al. Citation2011).
The cost of HEPA-based air cleaners generally scales with their capacity, usually characterized by their clean air delivery rate (CADR) (Association of Home Appliance Manufacturers (AHAM) Citation2014). The CADR determines the number of equivalent air changes per hour (ACH) achievable in a room of a given size. For example, the typical floor size of a U.S. classroom is about 1000 ft2 (93 m2) and with a volume of about 8000 ft3 (227 m3). To achieve three ACH in a room this size, for example, requires a CADR of 400 ft3 min−1 (680 m3 h−1). AHAM recommends that the CADR of an air filter is about two-thirds of the room floor area, corresponding to a CADR of 666 ft3 min−1 for a 1000 ft2 classroom. In the context of airborne infectious disease transmission, the risk of long-range transmission continually decreases as the CADR increases (Shen et al. Citation2021). Limitations to in-room filtration include noise, energy consumption, and initial and maintenance costs for replacement filters. An initial cost-survey of commercially available Energy Star rated in-room filters (U.S. EPA Citation2021a) designed for the residential market found costs ranging from $0.71 to $2.66 per CADR in units of ft3 min−1 (Pistochini Citation2021), making them inaccessible to many people and in many contexts.
A recently proposed, easy-to-construct, and low-cost alternative air filter constructed from MERV-13 filters and a box fan provides an opportunity for more people to access filter-based air cleaners in an affordable manner. This do-it-yourself (DIY) air filter, known as the “Corsi-Rosenthal Box” (hereafter, CR Box), is finding use in classrooms and other indoor environments across the U.S. through a grassroots movement driven by social media and the accessibility of the materials (Emanuel Citation2021). Although MERV-13 filters have a lower intrinsic filtration efficiency than HEPA filters, in-room air filtration using MERV-13 filters will still lead to a reduction in particle concentrations. While some work on airflow optimization in the CR Box has been done (Elfstrom Citation2021) and some initial characterization exists (Srikrishna Citation2021; Wieingartner, Rüggeberg and Wipf Citation2021), no systematic evaluation of the performance yet exists. Given the adoption of the CR Box in classrooms and other indoor environments, such evaluation is critical.
Here, we characterize the Corsi-Rosenthal Box performance via measurement of size-dependent particle decay for particles >0.5 microns in a classroom and a home office with and without the CR Box operating. Our method allows for determination of CADR values above the 450 ft3 min−1 (765 m3 h−1) upper-limit of the standard method (Association of Home Appliance Manufacturers (AHAM) Citation2014). We make measurements using both research-grade instrumentation (i.e., an aerodynamic particle sizer) and using a low-cost sensor to illustrate how such measurements can be made by those who lack access to research-grade instrumentation. We compare the results for the CR Box to those measured for two commercial HEPA-based air cleaners in terms of overall efficacy and cost.
2. Materials and methods
Here, we provide an overview of the methods used, with full details in the Supplementary Material. Decay rates of salt particles introduced to two rooms—a furnished but not occupied 5926 ft3 (168 m3) classroom and a 1277 ft3 (36.2 m3) furnished but not occupied home office—were measured with and without the filter-based air cleaners turned on (Figure S1). The salt particles were generated using a portable mesh nebulizer (Wellue) using an aqueous table salt solution (100 g/L). A box fan oriented at the wall operated at low speed throughout the measurements to maintain similar turbulence and mixing conditions between experiments. The measurements with this mixing fan on but the filter-based air cleaners turned off provides the baseline ventilation plus particle deposition rate, as these are the primary loss pathways for particles in a room. The measurements with the filter-based air cleaners turned on additionally include the influence of the filter. The equivalent air changes per hour (ACH) (actual air exchange + particle deposition to indoor surfaces + particle removal by an air cleaner) for each experiment were determined by fitting an exponential decay curve to the time-varying particle concentration (Cp,t) during the decay period with a y-offset that corresponds to the background particle concentration (Cp,bgd):
(1)
(1)
where t is the time in hours,
is the decay lifetime in hours, and
is the concentration at the start of the decay period. Here, we consider both the particle number concentration (p cm−3) and volume concentration (µm−3 cm−3) for the Cp values, although focus on the number concentration measurements.
When the filter-based air cleaners are turned on there is additional turbulence induced by the air filter fan that could alter the baseline deposition rate above that with the mixing fan alone. To assess the influence of this added turbulence we conducted experiments using two fans, the mixing fan and an additional box fan set in the location of the air filter. These experiments indicated that the additional turbulence from the air filter fan increased the baseline natural ventilation rate by 17 ± 11% in the home office but only 3% ± 3% in the classroom (Figure S2). The difference results from the classroom having active ventilation and a substantially higher baseline ACH compared to the home office.
The ACH from filtration (F), ventilation (V), and deposition (D) add in series. Therefore, the equivalent ACH attributable to only the filter-based air cleaners (ACHF) is simply the difference between the value measured with the air filter on (ACHF+V+D) and the baseline ACH from room ventilation and particle deposition (ACHV+D):
(2)
(2)
The ACHV+D values used in EquationEquation (2)
(2)
(2) are taken as the values measured with the air filter off and the mixing fan operating, but adjusted upwards by 17% or 3% to account for additional turbulence from the air filter fan. EquationEquation (2)
(2)
(2) can be used to determine the weighted-average equivalent ACHF across all particle sizes (by fitting to the particle number or mass concentration) or for specific size ranges. The corresponding CADR is:
(3)
(3)
where VR is the room volume. We use ACHX,Np and CADRNp when referring to the value determined from the particle number concentration and ACHX,Vp and CADRVp when determined from the volume concentration, and where X corresponds to F, V, or D (or combinations thereof).
Particle concentrations and decay rates were measured at 5 s time resolution using an aerodynamic particle sizer (APS; TSI model 3321) and a low-cost sensor (LCS; Plantower PMS 5003). The APS characterizes particles into bins from 0.5 to 20 microns diameter according to their aerodynamic diameters (Dpa) and thus allows for determination of size-specific ACH values. Size-specific values are only considered up to Dpa = 5.425 µm as above this value the decays are too noisy to allow for robust fitting, owing to the very low concentrations of particles above this size. The APS yields both number and volume concentrations. Note that, unless otherwise stated, results are reported based on the APS measurements. The LCS converts light scattering observations to report size-dependent particle mass and particle number concentrations using an unknown algorithm with a nominal lower diameter limit of 0.3 microns. The reported number concentrations observed here exhibit linear decays (after natural log transformation), as expected, whereas the mass concentrations from the LCS exhibit distinctly non-linear decays. We therefore consider only the number concentration data from the LCS and discourage the use of the reported mass concentrations in this context.
Three filter-based air cleaners were tested: the Corsi-Rosenthal Box and two commercial HEPA-based air cleaners. The Corsi-Rosenthal Box was originally proposed by Richard Corsi on Twitter and with Jim Rosenthal making the first prototype (Rosenthal Citation2020). The CR Box used here is constructed using three 20” x 20” x 2” and two 16” x 20” x 2” MERV-13 filters (Air Handler, LEED/Green Pleated Air Filter, total cost $34.75) and a 20” box fan (Air King Model 4CH71G, $23.68). (See Figure S3 and the Supplemental Material for a full description and discussion of cost). The CR Box here sits on legs that hold it about 4” (10 cm) off the ground and with the fan pointed upwards or sideways. In one variation, we tested the CR Box inverted such that the fan pointed at the floor, sitting about 4” (10 cm) off the floor. An inverted CR Box would potentially be more robust against potential foreign objects being dropped into the fan. One of the HEPA-based air cleaners (HEPA #1) has a stated tobacco smoke CADR = 300 ft3 min−1 (510 m3 h−1) when operated at maximum speed while the other (HEPA #2) has a stated tobacco smoke CADR = 141 ft3 min−1 (240 m3 h−1) when operated at maximum speed.
The loudness of the filter-based air cleaners and of the box fan alone were measured using a decibel monitor (Extech Instruments HD600) that was situated 5 ft (1.52 m) from the center of the filter-based air cleaners and located perpendicular to the air exhaust. The power use by the filter-based air cleaners was measured using a power logger (Fluke 1735 Power Logger Analyst). The pressure drop for the CR Box was measured using a high-resolution pressure gauge (DG-700, TEC). Estimates of the fan airflow rate alone and as part of the CR box were estimated from air flow velocity measurements (see Supplemental Material).
3. Results and discussion
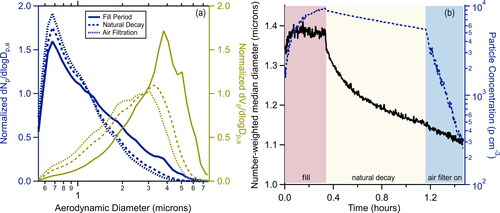
Average particle size distributions are shown in for three periods: when particles were being actively produced, near the end of the natural decay, and near the end of the air filtration period. The number-weighted median particle aerodynamic diameter (Dpa,Np), as characterized by the aerodynamic particle sizer, averaged 1.2 ± 0.12 µm. The volume-weighted median particle aerodynamic diameter (Dpa,Vp) averaged 2.8 ± 0.5 µm. Both the Dpa,Np and Dpa,Vp generally decreased over the course of an experiment, with the Dpa,Np starting at ∼1.4 µm and decaying during both the natural decay period and, to a lesser extent, during the period when the filter-based air cleaners were turned on (). Technically, the CADR is defined relative to the size range for various particle types, specifically smoke (0.09–1 µm), dust (0.5–3 µm), and pollen (0.5–11 µm), and is measured in a sealed chamber of specific size (1,008 ft3). The size-dependent CADR values measured here overlap with all three particle types.
Figure 1. (a) Example number-weighted (left axis, blue) and volume weighted (right axis, gold) particle size distributions measured with the APS and shown for averages during the fill period with active particle production (solid line) period, near the end of the natural decay period (dashed line), and near the end of the active air filtration period (dotted line) for the home office. Number-weighted distributions are normalized to a diameter of 1.2 microns and volume weighted to 2.8 microns, corresponding to the number-weighted and volume-weighted median diameters, respectively. (b) Example results for one experiment in the home office showing the number-weighted median diameter (black solid line) and the particle number concentration (blue dashed line) across the fill period, natural decay period, and active air filtration period.
Example number-based particle decays from the APS measurements for the natural room ventilation and with the various air cleaners on are shown in . The ACHV+D was 3.5 ± 0.2 hr−1 (1σ, precision-based uncertainty) for the unoccupied classroom and the ACHV+D was 1.3 ± 0.1 h−1 for the unoccupied home office. shows the resulting clean air delivery rates for air cleaners that were tested in both the classroom and home office, along with values for noise level and power draw (discussed further below). (Individual graphs for each parameter are provided in Figure S5.) Replicate CADR values for each air filter exhibited only small variations within each room and across the two rooms, although were generally larger for the measurements made in the classroom. The difference between the ACH values with and without the filter on was greater for the smaller home office (). Further, individual ACHV+D values were determined for every air filter measurement in the home office but not the classroom (see Methods). Therefore, we take the CADR values determined from the home office as generally more reliable and, unless otherwise stated, use them in the discussion that follows.
Figure 2. Example particle number decays measured in the home office for the natural ventilation + particle deposition (at t < 0) and with the filter-based air cleaners on (t > 0) shown on a (a) log scale and (b) linear scale. Particle concentrations have been normalized to unity at t = 0.
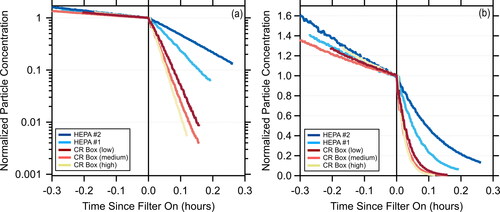
Figure 3. (left axis) The number-weighted clean air delivery rate for the various filter-based air cleaners (left axis, bars) as measured in the home office (left hash marks) and classroom (right hash marks). (right axis) The price normalized CADR (black circles), sound level (dark gray triangles), and power (light gray squares).
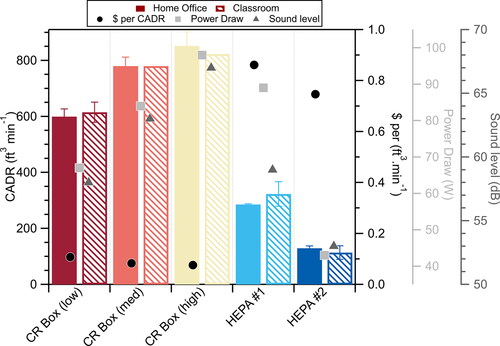
Table 1. Measured equivalent air changes per hour and clean air delivery rates.
Generally, the CADRVp > CADRNp with the exception of HEPA #2 (). The larger value for the CADRVp results from the volume distribution being characterized by a larger median diameter compared to the number distribution and the filtration efficiency for MERV-13 filters increasing with size for particles in the APS measurement range (>0.5 microns). For HEPA #1 the CADRNp = 322 ± 44 ft3 min−1 (547 ± 75 m3 h−1) for the classroom and 285 ± 2 ft3 min−1 (484 ± 3.4 m3 h−1) for the home office, both in very good agreement with the manufacturer’s specification of 300 ft3 min−1 (510 m3 h−1). For HEPA #2 the CADRNp = 113 ± 24 ft3 min−1 (192 ± 41 m3 h−1) for the classroom and CADRNp = 129 ± 8 ft3 min−1 (219 ± 14 m3 h−1) for the home office, also in very good agreement with the manufacturer’s specification of 141 ft3 min−1 (240 m3 h−1). The good agreement between the measured CADRNp and the manufacturer’s specifications provides a validation of the method.
The CADRNp for the Corsi-Rosenthal Box increases reasonably linearly with fan speed (Figure S4), from 600 ± 27 ft3 min−1 (1020 ± 46 m3 h−1) at low speed to 779 ± 32 ft3 min−1 (1324 ± 54 m3 h−1) at medium speed to 852 ± 50 ft3 min−1 (1450 ± 85 m3 h−1) at high speed, as measured for the home office, and from 615 ± 36 ft3 min−1 (1045 ± 61 m3 h−1) to 823 ft3 min−1 (1,400 m3 h−1) for the classroom. A linear fit with zero intercept to the CADRNp for the home office versus the fan total airflow rate estimates for the box fan at the three speeds indicates an effective filter efficiency of 41–58%, with the range indicating uncertainty in the CR Box airflow rates (see Supplementary Material; Figure S4). The air velocity measurements with the filters added indicated a 12% reduction in flow with a pressure drop (Δp) of 6.2 Pa at low speed. Accounting for this flow reduction increases the effective filter efficiency to 47–67%. The corresponding pressure drop at medium speed equaled 7.7 Pa and at high speed equaled 8.5 Pa. The CADRNp also varies linearly with the Δp (Figure S4). The CADR increases by a greater amount going from low to medium speed than it does going from medium to high. Such behavior is consistent with the response of both the airflow rate and Δp to changing the fan speed.
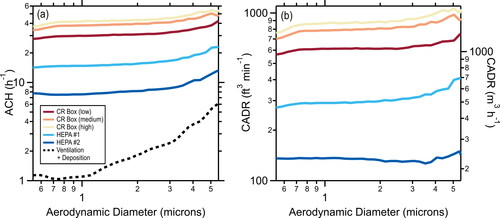
Figure 4. (a) Size-dependent equivalent air changes per hour with the various filter-based air cleaners operating (solid lines) and for the natural room ventilation + particle deposition alone (dashed line), as measured in the home office. (b) The corresponding clean air delivery rates for the various filter-based air cleaners. Results for the classroom are similar (not shown).
The size-dependent efficiency curves for the Air Handler MERV 13 filters indicates a minimum filtration efficiency () of ∼55% for 0.35 micron diameter particles (
), which increases to ∼85% for 0.75 micron diameter particles and to ∼90% for 1 micron dimeter particles (Air Handler via Grainger 2022). Multiplying the observed particle size distribution by 1 -
and comparing with the original particle size distribution indicates an expected size-averaged filtration efficiency of about 87% by number and 93% by mass, larger than observed. This difference may result from a much lower air velocity across the five parallel filters in this study (<148 ft min−1 = 1.07 m s−1) relative to those typically used for HVAC filter testing to determine MERV ratings (492 ft min−1 = 2.5 m s−1) (ASHRAE Citation2017). For MERV-13 filters, inertial impaction and interception are the dominant loss mechanisms for the size range of particles considered here (Flagan Citation1988). For these mechanisms, the single-fiber collection efficiency for fibers in a filter bed increases with the Stokes number, and therefore face velocity, and depends on the particle-to-fiber diameter ratio and fiber packing density. The Stokes number for a 1 micron diameter particle having a density of 1 g cm−1 encountering a 5 micron diameter fiber, fairly typical of modern filters (Kowalski and Bahnfelth 2002; Kowalski, Bahnfelth and Whittam Citation1999), at a face velocity of 492 ft min−1 (2.5 m s−1) equals 3.58, which is in the range over which the single-fiber filtration efficiency is particularly sensitive to changes in velocity (Flagan Citation1988). As such, a lower face velocity should mean lower removal efficiency due to the lessened effect of inertial impaction and interception. Alternatively, the reduced filtration efficiency measured in the experiment could also be attributed to leaks around the filter media, although the filter assembly was taped and visually inspected to seal any openings and thus we suspect that leaks play a minor role.
Size-dependent ACH and CADR values are determined by fitting decay curves to each particle size bin from the APS. The ACH for the natural room decay periods increase substantially with particle size (), likely due to higher particle deposition rates to indoor materials at larger aerodynamic diameters (Hussein and Kulmala Citation2008). The ACH for the filter-based air cleaners also increase with particle size, but to a lesser extent than the natural room decay (). Consequently, the CADR for the filter-based air cleaners, which derive from the difference between the filter on and natural room decay ACH values, exhibit a weaker dependence on particle size compared to the ACH (). The CADR for the CR Box vary only weakly with particle size for all speeds and are relatively constant from about 0.7 to 2.5 microns (). This weak size dependence helps explain why the CADRVp values are only slightly larger than the CADRNp values. However, such a weak size dependence is somewhat unexpected given the MERV-13 filter efficiency should increase sharply above 700 nm to about 1 micron, above which it should be constant and near unity. It is possible that the low face velocities on the filters relative to standard test conditions (ASHRAE Citation2017) led to atypical size dependence. Alternatively, additional turbulence from the filter exhaust air could have altered the particle deposition rates in the room from the baseline measurements leading to a flatter than expected size dependence, although the measurements with the added fan in place of the CR box suggest this had negligible influence. Notably, comparison of the size-specific CADR for particles with Dp,a > 1 µm to the specified fan speeds indicates an much less than unity, even after accounting for the 12% reduction in flow owing to filter resistance. The reason for this apparent lower than expected
for the CR Box is unclear.
The CADR values for the Corsi-Rosenthal Box substantially exceed those of the particular commercial HEPA-based air cleaners used here (). For further comparison, no U.S. Energy Star certified air cleaners have CADR values (for either tobacco smoke, dust, or pollen) matching the CADR value for the CR Box even on low speed (Figure S6). Consideration of the cost-per-unit-air-cleaned for the low-speed CR Box (<$0.072/(ft3 min−1)) and for the two HEPA-based air cleaners (>$0.7/(ft3 min−1)) demonstrates that the DIY air filter is approximately one-tenth the initial cost of a commercially available HEPA-based air cleaners per unit of air cleaned ().
The CR Box loudness varied from 58 dB (low speed) to 67 dB (high speed) (; ). The low speed loudness is similar to that measured for HEPA #1 (59 dB) but higher than that for HEPA #2 (54 dB). For reference, a modern refrigerator has a noise rating of about 50 dB and a LEED certified vacuum must be <70 dB. To attain a CADR equivalent to the CR Box on low speed would require about two HEPA #1 units and 4 HEPA #2 units, which would yield 62 dB and 60 dB, respectively. The power draw for the CR Box varied from 67 W (low speed) to 98 W (high speed) and was 89 W for HEPA #1 and 43 W for HEPA #2, corresponding to 8.9 and 8.7 ft3 min−1.W−1 (15.1 and 14.8 m3 h−1.W−1) for the CR Box and 3.2 and 3.0 ft3 min−1.W−1 (5.4 and 5.1 m3 h−1.W−1) for the HEPA-based air cleaners. For comparison, the most efficient category of U.S. Energy Star certified portable air cleaners must have an efficiency equal or greater than 2.9 ft3 min−1.W−1 (4.9 m3 h−1.W−1, meaning the CR Box is three times more efficient than the Energy Star standard (U.S. EPA Citation2021b).
The CADR values for the inverted CR Box were all suppressed relative to the standard CR Box orientation (with the fan pointed upwards; Table S1). For example, in the inverted orientation the CADRNp = 481 ft3 min−1 (817 m3 h−1) on the low setting, compared to ∼600 ft3 min−1 (1,019 m3 h−1) in the standard orientation. This difference likely resulted from one or both of (i) short circuiting of the airflow wherein clean air exhausted by the fan is preferentially entrained into CR Box filters rather than being dispersed into the broader room, or (ii) increased shear forces that resuspended particles previously deposited on the floor and increase particle number concentrations in air. Therefore, we suggest that orienting a CR Box (or likely any air filter) such that the fan exhaust is toward the floor be avoided.
In addition to the measurements with the APS, we also characterized the CADR for the various air cleaners using a low-cost sensor. Such low-cost sensors are much more accessible to the public than research grade instrumentation, such as an APS. The CADR measurements made with the low-cost sensor yield generally similar results to those made with the APS (Figure S7), with the CADRNp increasing with fan speed for the CR Box and with values for the HEPA-based air cleaners similar to the manufacturer’s specification. However, the specific CADRNp depended on which reported particle size regime was used for the fitting. Such a result is somewhat surprising given that the low-cost sensor is not fundamentally a particle counting measurement, but instead derives particle number from the measured light scattering. The root-mean square difference between the low-cost sensor and APS CADRNp values was smallest for the Np,>1.0 bin (72 ft3 min−1), marginally larger for the Np,>0.5 (76 ft3 min−1) and Np,>0.3 (78 ft3 min−1) bins, and substantially larger for the Np,>2.5 (161 ft3 min−1) and Np,>5.0 (220 ft3 min−1) bins. Without further knowledge of the algorithm behind the low-cost sensor data processing we cannot establish the origin of this apparent size dependence or why the Np,>1.0 bin yields the most similar values. Nonetheless, our results suggest that the use of low-cost sensors can yield a reasonable measure of the relative CADR values between filter-based air cleaners and a reasonable estimate of the absolute CADR values, and thus a means by which those without access to expensive instrumentation can determine the efficacy of DIY filter-based air cleaners. This is particularly important as different combinations of fans and filters (e.g., filter size or MERV rating) may yield results that differ from those presented here. We note that preliminary results for a CR Box using the same filters but a different fan (Lasko, Model B20301) indicate a lower range of CADR values than reported here for the CR Box with the Air King fan.
4. Summary
We have measured the filtration efficiency for particles >0.5 microns of a DIY, open-source air filtration system, the Corsi-Rosenthal Box, comprised of a box fan and MERV-13 filters. At the lowest speed the clean air delivery rate for our Corsi-Rosenthal Box is >600 ft3 min−1 (1,019 m3 h−1) for a median particle diameter of 1.2 microns, demonstrating exceptional performance relative to most commercially available filter-based air cleaners. The CADR increases with fan speed, with the highest value about 850 ft3 min−1 (1,444 m3 h−1) for these particle sizes. However, the filter noise level also increases with fan speed, from 58 dB at low speed to 67 dB at high speed. The CR Box is cost efficient, with a cost-normalized CADR of <$0.072/(ft3 min−1). We also demonstrate good agreement between results obtained using research-grade instrumentation and a low-cost sensor, which provides a methodology by which others can characterize the performance of other DIY air filtration systems. Future efforts to improve and characterize the CR Box might focus on decreasing the CR Box noise level without compromising filtration performance, characterizing the effectiveness for smaller particle sizes, or characterizing different CR Box designs that use different fans and filters or different numbers of filters, which may yield results that differ from those shown here.
Author contributions
RDP, MNK, TP, and CDC made measurements; RDP and CDC analyzed data; all authors interpreted results; RC designed the DIY air filter; CDC and RDP led the writing with contributions from all authors.
Competing interests
The authors declare no competing interests.
Supplemental Material
Download PDF (1.2 MB)Acknowledgments
The authors greatly appreciate the contributions from students in ECI/ATM 149 at UC Davis, who performed some preliminary experiments as part of a lab activity, and thank Joshua Morejohn in the UC Davis Facilities Management for helping with building operations. Jim Rosenthal is thanked for constructing and promoting the first Corsi-Rosenthal box.
Data and materials availability
All data needed to evaluate the conclusions in the article are present in the article and/or the supplementary materials.
References
- Air Handler via Grainger. 2022. Green pleat merv 13, Accessed January 2, 2022 https://www.grainger.com/ec/pdf/Air-Handler-Green-Pleat-Merv-13-Air-Filters-Guide.pdf.
- Alavy, M, and J. A. Siegel. 2020. In-situ effectiveness of residential hvac filters. Indoor Air. 30 (1):156–66. doi: 10.1111/ina.12617.
- Allen, R. W., C. Carlsten, B. Karlen, S. Leckie, S. van Eeden, S. Vedal, I. Wong, and M. Brauer. 2011. An air filter intervention study of endothelial function among healthy adults in a woodsmoke-impacted community. Am J Respir Crit Care Med. 183 (9):1222–30. doi: 10.1164/rccm.201010-1572OC.
- ASHRAE. 2017. Standard 52.2: Method of testing general ventilation air-cleaning devices for removal efficiency by particle size. Atlanta, GA: ASHRAE.
- Association of Home Appliance Manufacturers (AHAM). 2014. ANSI/AHAM AC-1: Method for measuring the performance of portable household electric room air cleaners. Washington, DC: AHAM.
- Cox, J., K. Isiugo, P. Ryan, S. A. Grinshpun, M. Yermakov, C. Desmond, R. Jandarov, S. Vesper, J. Ross, S. Chillrud, et al. 2018. Effectiveness of a portable air cleaner in removing aerosol particles in homes close to highways. Indoor Air. 28 (6):818–27. doi: 10.1111/ina.12502.
- Curtius, J., M. Granzin, and J. Schrod. 2021. Testing mobile air purifiers in a school classroom: reducing the airborne transmission risk for sars-cov-2. Aerosol Sci. Technol. 55 (5):586–99. doi: 10.1080/02786826.2021.1877257.
- Elfstrom, D. 2021. @DavidElfstrom, Title, Posted August 15, 2021, https://twitter.com/DavidElfstrom/status/1427112878616817669.
- Emanuel, G. 2021. Does your kid's classroom need an air purifier? Here's how you can make one yourself, NPR, Published August 26, 2021, https://www.npr.org/sections/back-to-school-live-updates/2021/08/26/1031018250/does-your-kids-classroom-need-an-air-purifier-heres-how-you-can-make-one-yoursel.
- Flagan, R. C. 1988. Fundamentals of air pollution engineering. Englewood Cliffs, NJ: Prentice-Hall.
- Hussein, T, and M. Kulmala. 2008. Indoor aerosol modeling: Basic principles and practical applications. Water. Air. Soil Pollut: Focus 8 (1):23–34. doi: 10.1007/s11267-007-9134-x.
- Kelly, F. J, and J. C. Fussell. 2019. Improving indoor air quality, health and performance within environments where people live, travel, learn and work. Atmos. Environ. 200:90–109. doi: 10.1016/j.atmosenv.2018.11.058.
- Kowalski, W. J., W. P. Bahnfelth, and T. S. Whittam. 1999. Filtration of airborne microorganisms: Modeling and prediction. ASHRAE Transactions: Research 105:4–17.
- Kowalski, W. J, and W. P. Bahnfelth. 2002. Merv filter models for aerobiological applications. Accessed January 2, 2022 https://www.nafahq.org/merv-filter-models/.
- Liu, D. T., K. M. Phillips, M. M. Speth, G. Besser, C. A. Mueller, and A. R. Sedaghat. 2021. Portable hepa purifiers to eliminate airborne sars-cov-2: A systematic review. Otolaryngol. Head Neck Surg. doi: 10.1177/01945998211022636.
- Luo, J. Y., L. L. Ou, J. Ma, X. Y. Lin, L. M. Fan, H. C. Liu, and B. Q. Sun. 2021. Efficacy of air purifier therapy for patients with allergic asthma. Allergol. Immunopath 49:16–24. doi: 10.15586/aei.v49i5.146.
- McNamara, M. L., J. Thornburg, E. O. Semmens, T. J. Ward, and C. W. Noonan. 2017. Reducing indoor air pollutants with air filtration units in wood stove homes. Sci. Total Environ. 592:488–94. doi: 10.1016/j.scitotenv.2017.03.111.
- Miller-Leiden, S., C. Lobascio, W. W. Nazaroff, and J. M. Macher. 1996. Effectiveness of in-room air filtration and dilution ventilation for tuberculosis infection control. J Air Waste Manag Assoc. 46 (9):869–82. doi: 10.1080/10473289.1996.10467523.
- Pistochini, T. 2021. Considerations for use and selection of portable air cleaners for classrooms. Rep. 3. Western Cooling Efficiency Center, University of California, Davis, https://ucdavis.app.box.com/s/81yd5wsylxsc8oi2vtgf569vorph3tfk.
- Rosenthal, J. 2020. A variation on the “box fan with merv 13 filter” air cleaner. Accessed January 2, 2022. https://www.texairfilters.com/a-variation-on-the-box-fan-with-merv-13-filter-air-cleaner/
- Shaughnessy, R. J, and R. G. Sextro. 2006. What is an effective portable air cleaning device? A review. J. Occup. Environ. Hyg. 3 (4):169–81. doi: 10.1080/15459620600580129.
- Shen, J. L., M. Kong, B. Dong, M. J. Birnkrant, and J. S. Zhang. 2021. Airborne transmission of sars-cov-2 in indoor environments: A comprehensive review. Sci. Technol. Built Environ 27 (10):1331–67. doi: 10.1080/23744731.2021.1977693.
- Srikrishna, D. 2021. Price-performance comparison of hepa air purifiers and lower-cost merv 13/14 filters with box fans for filtering out sars-cov-2 and other particulate aerosols in indoor community settings. Preprint on medRxiv. doi: 10.1101/2021.12.04.21267300.
- U.S. EPA. 2021a. Energy star certified air purifiers (cleaners), Accessed December 29, 2021. https://www.energystar.gov/productfinder/product/certified-room-air-cleaners/results.
- U.S. EPA. 2021b. Energy star product specifications for room air cleaners: Eligibility criteria version 2.0, Accessed December 29, 2021. https://www.energystar.gov/sites/default/files/ENERGY%20STAR%20Version%202.0%20Final%20Room%20Air%20Cleaners%20Program%20Requirements_0.pdf.
- Wieingartner, E. T. Rüggeberg, and M. Wipf. 2021. Measurement of the filtration performance of diy air cleaners (cadr values) for aerosol particles with diameters smaller than 1 micrometer. Rep. 13. pp, University of Applied Sciences Northwestern Switzerland, https://makehumantechnology.org/wp-content/uploads/2021/10/Messbericht_DIY_Air_Cleaner_2021-10-8-EN.pdf.