
 ?Mathematical formulae have been encoded as MathML and are displayed in this HTML version using MathJax in order to improve their display. Uncheck the box to turn MathJax off. This feature requires Javascript. Click on a formula to zoom.
Abstract
Brown carbon (BrC) aerosol is an important contributor to positive radiative forcing on Earth, but its influence on the global radiative budget remains uncertain due to the limitations of current analytical methods used to characterize its optical and chemical properties. While online optical instruments provide in situ characterization of BrC light-absorption properties, the wavelengths are often limited due to the light source of optical instruments. Offline measurements can cover the entire UV–Vis wavelength range, but the use of solvents may introduce artifacts. In this study, we compared the mass absorption coefficients at 375 nm (MAC375) measured by online and offline instruments for aerosol samples generated from the nighttime oxidation of heterocyclic volatile organic precursors. Offline samples were extracted with both acetonitrile (ACN) and methanol (MeOH) to investigate the potential solvent effects on the Ångström absorption exponent and BrC chromophores. Our results indicated considerable variations between MeOH-extracted samples and ACN-extracted samples, with pyrrole SOA being especially susceptible to solvent effects. Multi-instrumental analysis confirmed that MeOH could induce solvent artifacts by reacting with conjugated carbonyl chromophores, such as phthalic anhydride, maleic anhydride and maleimide, and subsequently modify the light absorption properties of BrC constituents. Our findings highlight the importance of methanolysis in the formation of artifacts, whereas an inert solvent such as ACN would be ideal for proper characterization of BrC chromophores. Consequently, the results from offline analysis using MeOH as the solvent should be interpreted with caution.
Copyright © 2022 American Association for Aerosol Research
1. Introduction
Brown carbon (BrC) aerosols are light-absorbing organic aerosols that absorb tropospheric solar radiation in the near UV and shorter visible ranges. BrC aerosols are one of the main uncertainties in radiative forcing in the atmosphere. Previous model studies showed that the direct radiative effect of BrC absorption ranges from +0.10 to +0.55 W m−2 (Feng, Ramanathan, and Kotamarthi Citation2013; G. Lin et al. Citation2014; Zhang et al. Citation2020). The Community Atmosphere Model simulation also suggested that BrC may reduce the global coverage of low clouds and hence indirectly decrease the cooling effects of clouds (Brown et al. Citation2018). However, evaluation of BrC’s climate forcing is largely limited due to the absence of chromophores in the current models (Laskin, Laskin, and Nizkorodov Citation2015), which requires in-depth characterization of BrC constituents and their optical properties.
Online analysis (e.g., photoacoustic spectrometer coupled with the cavity ring down extinction spectrometer [PA-CRD-S] and broadband cavity-enhanced spectrometer [BBCES]) is an approach to directly measuring BrC’s optical properties such as absorption coefficient, Ångström absorption exponent (AAE) and the complex refractive index (RI) (Bluvshtein et al. Citation2016; Bluvshtein et al. Citation2017; He et al. Citation2021; Li et al. Citation2020). However, online measurements are limited to several wavelengths or even one wavelength, therefore limiting their ability to explore full spectral dependence of light absorption. In addition, online measurements cannot identify chromophores in BrC aerosols, and hence can hardly guide the parameterization of BrC chemistry in climate models independent of complementary composition measurements. Alternatively, offline analysis can acquire not only spectral light absorption but also chemical compositions of BrC. For example, high performance liquid chromatography coupled with a diode array detector and electrospray ionization high-resolution mass spectrometry (i.e., HPLC–DAD–ESI–HRMS) may isolate the BrC constituents and measure their spectral light-absorption as well as chemical formula. This technique has been applied to identify chromophores in several previous investigations (Hettiyadura et al. Citation2021; Jiang et al. Citation2019; Lin et al. Citation2016, Citation2017, Citation2018). Additionally, when combined with measurements of organic mass, HPLC–DAD–ESI–HRMS and ultraviolet–visible (UV–Vis) spectrophotometry can be used to estimate mass absorption coefficient (MAC) and AAE (Hettiyadura et al. Citation2021; Jiang et al. Citation2019; Lin et al. Citation2017; Xie et al. Citation2019). Thus, offline analysis is critical to improving our understanding of BrC formation and evolution.
Each constituent in BrC has a unique solubility in different solvents. Because offline analysis is based on solvent extraction of BrC constituents, it may lead to less accurate results when compared with the in situ measurements carried out by online analysis. The selection of solvent can be a determining factor for the quality of offline analysis. Methanol (MeOH) in particular has been widely used in both experimental and field studies (Jiang et al. Citation2019; Y.-H. Lin et al. Citation2014; Liu et al. Citation2013; Shen et al. Citation2017; Song et al. Citation2019; Yan et al. Citation2020). This is primarily because MeOH performs exceptionally well in terms of extraction efficiency of oxygenated compounds. In experimental studies, Chen and Bond proposed that MeOH could extract over 92% of the organic constituents in BrC aerosols from wood combustion (Chen and Bond Citation2010), whereas Updyke et al. demonstrated that MeOH could completely extract the organic constituents in secondary BrC aerosols generated from reactions between ammonium and daytime SOA (Updyke, Nguyen, and Nizkorodov Citation2012). In field studies, Cheng et al. reported that ∼85% of organic mass in ambient aerosols in Beijing could be extracted by MeOH (Cheng et al. Citation2016), while Yan et al. (Citation2020) reported that the MeOH-soluble organic components in their aerosol samples could reach up to 93%. Although MeOH-insoluble BrC may be a significant contributor to light absorption of aerosols in some cases (Bai et al. Citation2020), most studies have proposed offline optical properties and chemical compositions of BrC aerosols based on MeOH extraction.
However, MeOH may induce artifacts that alter the aerosol compositions. Walser et al. (Citation2008) reported that methylation could occur on MeOH-extracted aerosol samples from ozonolysis of limonene. Bateman et al. (Citation2008) further explored the artifacts and concluded that MeOH can react with carbonyl constituents in aerosols and generate new compositions including ester, acetal and hemiacetal in the extracted samples. Kristensen and Glasius (Citation2011) also observed that some of their investigated carboxylic acids (pinonic acid and adipic acid) could generate methyl esters after MeOH extraction but remained intact after acetonitrile (ACN) extraction. Thus, it is uncertain whether the possible solvent-analyte reactions in MeOH may also change the optical properties of extracted BrC samples. Previous studies have suggested that ACN may be a better choice for extracting aerosol constituents because it is an aprotic and inert solvent (Bateman et al. Citation2008; Kristensen and Glasius Citation2011; Walser et al. Citation2008), and it has also been utilized in offline analysis of BrC samples (Lin et al. Citation2015; Nguyen et al. Citation2013; Trofimova et al. Citation2019). Given the interplay between solvent solubility and chemical reactivity, it will be important to evaluate the effects of solvents on both light-absorption properties and chemical compositions of BrC samples.
In this study, we compared the offline MAC375 of the MeOH-extracted and ACN-extracted samples with the online measurements to evaluate the solvent effects on BrC’s light absorption. AAE at near-UV and visible regions (AAE290/400 and AAE400/600) of the aerosol samples extracted by MeOH and ACN, respectively, were also compared to assess the discrepancy in wavelength dependence of MAC due to solvent effects. The wavelength of 375 nm is representative of strong BrC absorption in the near-UV range (Feng, Ramanathan, and Kotamarthi Citation2013), while the wavelengths of 290, 400, and 600 nm were selected for AAE calculations to describe the spectral dependence of aerosol light absorption following our previous study (Jiang et al. Citation2019). FTIR and mass spectrometric analyses were performed to further confirm the changes in functional groups and composition of chromophores due to solvent artifacts. Results from this study seek to provide an improved understanding of BrC characterization and reduce uncertainties in assessing their impacts.
2. Methods
2.1. Generation of BrC aerosols
Controlled chamber experiments were performed in a 10 m3 FEP film chamber under dry condition (RH < 20%) at room temperatures (20–25 °C) to produce tested BrC aerosols. The experiments were conducted in dark condition to simulate nighttime oxidation of heterocyclic volatile organic compounds (VOCs) in the presence of NO2 and O3, which has been indicated as a secondary source of BrC aerosols (Jiang et al. Citation2019). NO3 radicals were generated via the reactions between NO2 and O3, with the initial concentration ratio of [NO2]/[O3] being around 0.1 or 0.3 that are similar to the conditions observed in fresh wildfire plumes (Singh et al. Citation2010). O3 was generated by flowing ∼0.4 lpm of pure oxygen through the ozone generator via corona discharge (A2Z Ozone 3 G LAB). The target initial mixing ratio of O3 was ∼1500 ppbv. NO2 was either directly injected with a NO2 cylinder (4789 ppm, Airgas) to achieve 150 ppbv, or it was generated in the chamber prior to the injection of 1500 ppbv O3 by reactions between NO (150 ppbv) and O3 (150 ppbv). During the injections of O3 and NO2, ∼15 lpm of zero air was also injected for 5 min to facilitate mixing in the chamber. This study used pyrrole (TCI America, >99%), 1-methylpyrrole (TCI America, >99%), 2-methylpyrrole (aa blocks, 98%), thiophene (Alfa Aesar, 99%), 2-methylthiophene (Alfa Aesar, 98%), furan (TCI America, >99%), and furfural (Acros Organics, 99%) as model compounds of heterocyclic VOC precursors. After 1 h reaction of NO2 and O3, the heterocyclic VOC precursor was introduced into the chamber by flowing ∼15 lpm of N2 over a heated jar containing the VOC liquid sample to achieve a mixing ratio of ∼200 ppbv in the chamber. Each experiment was duplicated three times, where only one heterocyclic VOC precursor was involved. Aerosol samples for offline analysis were collected on PTFE membrane filters (46.2 mm, 2 µm, Tisch Scientific) from the chamber experiment. Aerosol collection efficiency of our filters was over 99.5%, which was estimated by the ratio of 10-min averaged aerosol volume concentrations ahead of the filter to that behind the filter. Details for sample collection and preparation can be found in our previous study (Jiang et al. Citation2019).
2.2. Online aerosol composition and size measurements
Real-time size-resolved mass distributions and chemical composition of aerosol particles were measured by a mini-Aerosol Mass Spectrometer coupled with a compact time-of-flight mass spectrometer (mAMS, Aerodyne Research Inc.) every 20 s during all experiments (Bahreini et al. Citation2005). Sensitivity and sizing capability of the instrument were calibrated regularly using dry, size-selected ammonium nitrate particles or dry polystyrene latex spheres. The raw data were analyzed as described previously (Allan et al. Citation2004). Given the accuracy of the mass calibrations (20 ppm), high-resolution analysis of the raw mass spectra was also carried out for m/z 20–115 amu to calculate the mass concentrations of all species except ammonium (Bahreini et al. 2012). A scanning electrical mobility spectrometer (SEMS, Brechtel Manufacturing Inc.) was used to determine the number concentration and size distribution of SOA from 10 to 800 nm with 140 bins. The sampled air from the chamber passed through a 30-cm-long diffusion dryer filled with silica gel (Sigma-Aldrich) and Purafil (Thermo Scientific) before reaching mAMS, SEMS, and the photoacoustic extinctiometer (PAX, described below). Details of calculations of the organic aerosol fraction (MFOA), particulate effective density (ρeff), and the total volume concentration of particles used to estimate the SOA mass concentration (CSOA) are provided in the online supporting information (SI) Text S1. Calculated values are summarized in Table S1. The CSOA was used subsequently to calculate online MAC.
Table 1. SOA mass contributions (%) of phthalic anhydride, maleic anhydride, and maleimide in various SOA samples.
2.3. Optical measurements
In this work, both UV–Vis spectra of extracted SOA solution and in situ absorption coefficients of SOA particles were measured. A UV–Vis spectrophotometer (Beckman DU-640) was used to measure the UV–Vis absorbance in the range of 290–700 nm, with the reference wavelength at 700 nm. Before the sample scanning, blank filters extracted by either solvent (MeOH or ACN) were used as spectral blanks, in which no absorption spectra were observed. Each sample was scanned three times, and the average spectra were used for calculating offline MAC profiles, AAE290/400 and AAE400/600. The offline imaginary RI (koffline) was calculated using EquationEquation (1)(1)
(1) , where ρeff is the aerosol effective density, λ is the wavelength, Abs solution(λ) is the absorption of the SOA solution samples, and Cm is the mass concentration of sampled SOA in the solution.
(1)
(1)
We assumed that all the organic mass could be extracted by both solvents, which would be discussed in Section 3, so Cm was calculated based on the flowrate and the average mass concentration of SOA during the sampling, using the organic mass fraction of the aerosols and overall effective densities corresponding to the start of filter collection. The uncertainty of MAC375 will be discussed in Section 3. AAE290/400 and AAE400/600 were calculated by the power-law dependence of light absorption on the wavelengths (EquationEquation (2)(2)
(2) ).
(2)
(2)
In situ measurements of particulate absorption coefficients at 375 nm (βabs,375) were performed by a PAX (Droplet Measurement Technology) at 1 Hz (Dingle et al. Citation2019). Since the absorption measurements were averaged to the scan time of SEMS, the detection limit was defined as two times the standard deviation of the 1-Hz absorption measurements when sampling filtered air, scaled down by s. Online MAC at 375 nm is calculated by EquationEquation (3)
(3)
(3) , where the CSOA calculation is described in the SI Text S1.
(3)
(3)
For comparison, MACoffline(375) was calculated using EquationEquation (4)(4)
(4) , where babs,Mie-converted(375) is the particle-relevant value of light absorption coefficient at 375 nm converted by the Mie theory calculations based on koffline, as described by Liu et al. (Citation2013).
(4)
(4)
The size distribution of aerosols (Figure S1) was considered during the conversion, and the real RI was set as 1.4 based on our previous work (Jiang et al. Citation2019). For simplicity, MAConline(375) will be denoted as “MAC375,online” while the Mie-converted MACoffline(375) corresponding to MeOH and ACN extraction will be denoted as “MAC375,MeOH” and “MAC375,ACN” hereafter.
2.4. Functional group analysis
Functional group analysis of on-filter and solvent-extracted samples was performed using attenuated total reflectance Fourier-transform infrared spectroscopy (ATR-FTIR) measurements (Thermo Nicolet 6700). On-filter samples were measured by being attached to the ATR platform, while extracted samples were concentrated to around 50–100 μl with a gentle flow of nitrogen and dropped on the crystal window of the ATR platform. Each sample was dried for 3–5 min on the ATR platform before measurements. All the measurements were performed with 0.5 cm−1 resolution and 128 scans over 700–4000 cm−1. The acquired IR spectra were analyzed using Igor Pro 7 (WaveMetrics, Lake Oswego, OR, USA). Spectral deconvolution was performed with the Gaussian profiles that were widely used in previous ATR-FTIR studies (Branca et al. Citation2016; Ortuso et al. Citation2019; Srour et al. Citation2017). To smooth the IR spectra, the Savitzky–Golay algorithm (Savitzky and Golay Citation1964) was used with a 21-point window and the second order formulation (Svečnjak et al. Citation2015).
2.5. Chemical composition analysis
Multi-instrumental analyses were performed to identify chromophores that can react with MeOH and characterize their artifact products, including (1) gas chromatography-electron impact mass spectrometry (GC/EI–MS, Agilent Technologies 6890N GC System and 5975 inert XL Mass Selective Detector), (2) liquid chromatography coupled with a diode array detector, an electrospray ionization source and a quadruple-time-of-flight mass spectrometer (LC–DAD–ESI–Q-TOFMS, Agilent Technologies 1260 Infinity II and 6545 Q-TOF LC/MS), and (3) time-of-flight chemical ion mass spectrometry implemented with the Filter Inlet for Gases and AEROsols system (FIGAERO-ToF-CIMS, Aerodyne Research Inc.). The identified chromophores were quantified by the peak integration of the corresponding extracted ion chromatogram (EIC) from the GC/EI–MS data. Operational procedures of GC/EI–MS and LC–DAD–ESI–Q-TOFMS are modified from our previous study (Jiang et al. Citation2019), and the technical details in this study are available in the SI Text S2 and S3.
FIGAERO-ToF-CIMS was used as in situ characterization of chemical compositions and provides a complementary support of compositional analysis. The temperature profile for aerosol collection, desorption, and analysis was as follows: (1) sampling aerosols for 25 min at room temperature, (2) linearly increasing the temperature from 30 °C to 200 °C in 25 min, (3) holding at 200 °C for 15 min, and (4) cooling to 30 °C in 20 min. In our experiments, both negative and positive modes were used for ion detection, where iodide ion (I–) or proton (H+) were the adduct ions for soft ionization. In the negative mode, I– was produced by flowing ∼2.5 lpm of N2 through a permeation tube containing CH3I followed by a 210Po ionizer. Water vapor was also introduced to the ion-molecule reaction (IMR) chamber of ToF-CIMS by flowing ∼1 lpm of N2 through a bubbler containing deionized water. In the positive mode, (H2O)nH+ clusters were produced by flowing ∼2.5 of lpm N2 through the bubbler followed by the 210Po ionizer. The proton of the (H2O)nH+ clusters may transfer to the analytes during ion-molecule collisions, which generates the H+-adduct ions. Since soft ionization has selectivity for product detection, negative mode was tuned by 1,2-dinitrobenzene and 2-nitrophenol, while positive mode was tuned by furan and furfural. Both modes were tuned with the target resolution power of ∼4000. The single ion measurement value was ∼2.1 mV•ns for ∼3000 scans, and the operating pressures of each part in the TOF-CIMS are listed in Table S2.
3. Results and discussion
3.1. Comparisons of online and offline light-absorption properties
Direct comparisons between online and offline MAC375 are presented here to evaluate the solvent effects on BrC’s light-absorption properties ( and Table S3). Online MAC375 is used as an in situ benchmark for offline MAC375. shows that solvent extraction can cause different levels of deviation in MAC375 when compared to online measurements. Among the SOA systems studied, pyrrole SOA is most sensitive to the solvent effects at the absorption wavelength of 375 nm.
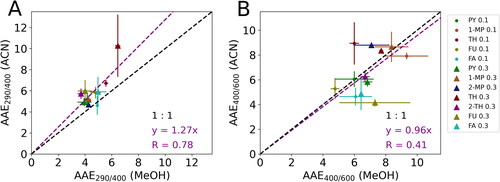
Figure 1. Comparisons of (a) MAC375,online vs. MAC375,MeOH and (b) MAC375,online vs. MAC375,ACN. The data points are the average value of measurements labeled by the abbreviation of precursor’s names and the value of experimental [NO2]/[O3], where PY represents pyrrole, 1-MP represents 1-methylpyrrole, 2-MP represents 2-methylpyrrole, TH represents thiophene, 2-TH represents 2-methylthiophene, FU represents furan and FA represents furfural (furaldehyde). The error bars represent the standard deviations of all the online and offline MAC375, and the black dashed lines are the “1:1” lines for comparisons.
![Figure 1. Comparisons of (a) MAC375,online vs. MAC375,MeOH and (b) MAC375,online vs. MAC375,ACN. The data points are the average value of measurements labeled by the abbreviation of precursor’s names and the value of experimental [NO2]/[O3], where PY represents pyrrole, 1-MP represents 1-methylpyrrole, 2-MP represents 2-methylpyrrole, TH represents thiophene, 2-TH represents 2-methylthiophene, FU represents furan and FA represents furfural (furaldehyde). The error bars represent the standard deviations of all the online and offline MAC375, and the black dashed lines are the “1:1” lines for comparisons.](/cms/asset/44528dd1-0ab6-401c-8dcf-5e7ae0312435/uast_a_2100734_f0001_c.jpg)
The discrepancies in light-absorption properties between MeOH-extracted and ACN-extracted SOA were also evaluated by offline AAE290/400 and AAE400/600 ( and Table S4), which represent the change in MAC along with wavelengths in the UV and visible ranges, respectively. Although online AAE is not available as an in situ benchmark, comparisons of offline AAE in different solvents by linear regression (with intercept set to 0) can still reveal the disparity in wavelength dependence of MAC due to solvent effects. shows that MeOH extraction tends to cause lower AAE290/400 than ACN extraction (y = 1.27x), while a strong correlation coefficient (R = 0.78) suggests a roughly consistent trend of AAE290/400 for MeOH-extracted and ACN-extracted samples. In contrast, shows high variability of AAE400/600 for MeOH-extracted and ACN-extracted samples, with a slope close to 1 but a moderate correlation coefficient (R = 0.41), revealing the inconsistency of wavelength dependence of MAC in the visible range due to solvent effects. As a result, the effect of solvents may cause considerable uncertainties based on AAE assessments, complicating the offline evaluation of BrC’s MAC profiles.
Figure 2. Comparisons of (a) AAE290/400 (MeOH) vs. AAE290/400 (ACN) and (b) AAE400/600 (MeOH) vs. AAE400/600 (ACN). The data points are the average values of measurements, and the standard deviations are shown as error bars. The purple dashed lines are the regression lines while the black dashed lines are the “1:1” lines for comparisons. The legend is the same as in .
The solvent effects on BrC’s light-absorption properties have been hitherto revealed based on MAC375 and AAE, where MeOH and ACN extractions led to divergent results. From a chemical perspective, although MeOH and ACN are both polar solvents, their polar functional groups are distinct, with MeOH having a hydroxyl group and ACN having a nitrile group. Because the differences in polar functional groups can result in selective solubility of analytes, the extracted BrC chromophores in MeOH and ACN may vary. Notably, because the extraction efficiency of each solvent varies for different compounds (Lanzafame et al. Citation2021), it is challenging to accurately determine the extraction efficiency for the SOA system as a whole. The offline MAC375 reported here may be underestimated due to a lack of consideration for extraction efficiency. Furthermore, as a polar protic solvent, the hydroxyl group of MeOH may enable proton transfer reactions leading to esterification, whereas the nitrile group of ACN is a very stable and considered as an inert functional group during extractions (Bateman et al. Citation2008). As a result, possible MeOH–analyte interactions may cause artifacts in MeOH-extracted samples and interfere with MAC profiles.
Notably, in addition to solvent selectivity and the formation of artifacts in offline analysis, discrepancies between online and offline MAC375 may be partially attributed to other uncertainties. Sun et al. (Citation2007) reported that in the small particle regime (i.e., particulate diameter much smaller than the wavelength of light), particulate effects should be considered in the estimation of MAC via a coefficient, which is a function of both the real part (n) and the imaginary part (k) of the complex RI. Several reviews of BrC optical properties also discussed the potential interference in MAC owing to particulate effects (Laskin, Laskin, and Nizkorodov Citation2015; Moise, Flores, and Rudich Citation2015; Saleh Citation2020). Since Mie theory calculations were performed to estimate MAC375,MeOH and MAC375,ACN, we expect minimal particulate effects in our case. In addition, solvent environments can induce extra interference in the UV–Vis spectra of BrC chromophores by perturbing the excitation wavelengths and full width at half maximum (FWHM) of spectral peaks (Benassi et al. Citation2014; Chen et al. Citation2020). This may also contribute to the uncertainty of offline MAC375, which should be explored in future studies.
3.2. Functional group analysis of solvent-extracted BrC samples
To analyze the compositional difference between MeOH-extracted, ACN-extracted and in situ SOA samples, ATR-FTIR spectra were first measured to reveal the compositional fingerprints as well as confirm the presence of key functional groups in SOA constituents. Peak assignments were based on a review of IR studies conducted on organic aerosols (Cao et al. Citation2018). Figure S2 provides an example for the technical details of spectral deconvolution.
Our results show that different treatments of SOA samples can result in divergent fingerprints within the spectral range of 1000–1500 cm−1 (green shaded area in ). For example, the on-filter spectrum of pyrrole SOA formed at [NO2]/[O3] = 0.1 condition shows two sharp peaks with a rather flat spectral profile at other wavenumbers in the shaded area. However, both MeOH-extracted and ACN-extracted spectra reveal a similar pattern of three spectral profiles spread in the shaded region. The differences between on-filter and solvent-extracted spectra indicate that the ratios of functional groups are altered during solvent extraction. In addition, the ACN-extracted spectrum has more split peaks than the MeOH-extracted spectrum in the shaded area (), revealing that extraction by different solvents can lead to inconsistent compositions.
Figure 3. ATR-FTIR spectra corresponding to the BrC SOA samples. MeOH-extracted spectra are in red, ACN-extracted spectra in blue, and on-filter spectra in brown. Green shaded areas highlight the divergent fingerprints in the 1000–1500 cm−1 range.
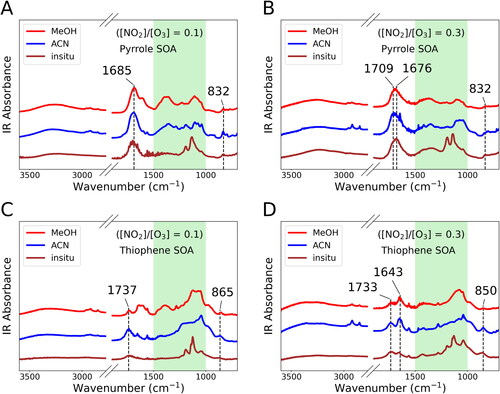
Nevertheless, the ATR-FTIR measurements of functional groups also provide valuable insight into the composition of SOA systems (Chen et al. Citation2016; Russell, Bahadur, and Ziemann Citation2011; Yu et al. Citation2018). For example, all observations of the pyrrole SOA (in both [NO2]/[O3] = 0.1 and [NO2]/[O3] = 0.3 conditions) probed the peak at 832 cm−1 (), while peaks at adjacent wavenumbers (865 and 850 cm−1) were also observed in all thiophene SOA spectra (). These peaks correspond to C–H bending on aromatic rings and alkene chains, suggesting the prevalence of conjugated systems in the SOA samples investigated. Similarly, carbonyl groups (characterized by C = O stretching in the 1600–1800 cm−1 range) are ubiquitous in all SOA samples investigated ( and Figure S3). These results can serve as references for further analysis of chemical compositions in nighttime BrC from heterocyclic VOC precursors.
3.3. Identification of solvent–analyte reactions
To unravel more mechanistic insights of solvent artifacts in MeOH extraction, further characterization of chromophores and their artifact products was performed by combining multiple instruments. Since our ATR-FTIR measurements confirmed the presence of carbonyls and conjugated systems, the identification of solvent-analyte reactions was focused on conjugated carbonyls. Our analysis identified the artifact products from three conjugated carbonyl compounds: phthalic anhydride, maleic anhydride, and maleimide. All of these compounds were identified in ACN-extracted SOA samples by GC/EI–MS (). The identities of these compounds in SOA samples were initially proposed by the NIST library based on the spectral match of their electron ionization (EI) mass spectra, and subsequently confirmed by their authentic chemical standards (). In situ analysis of SOA constituents using FIGAERO-ToF-CIMS also confirmed the presence of identified compounds (Figure S4). The UV–Vis spectra of these compounds in ACN proved that they are BrC chromophores (Figure S5). To characterize the artifact products, chemical standards of the identified chromophores were dissolved in MeOH and measured by GC/EI–MS. The NIST mass spectral library was used to determine the structures of artifact products. Our results showed that dimethyl phthalate () was detected in the MeOH solution of phthalic anhydride standard, whereas dimethyl fumarate and dimethyl maleate () were detected in the MeOH solution of maleic anhydride standard. The presence of these artifact products in extracted SOA samples was also confirmed by the labeled peaks in . Since SOA samples are mixtures of different constituents, other analytes may also generate ion fragments at tm/z 163 and 113, leading to the extra peaks () or altering the shape of the peaks () in the EICs. In the MeOH solution of maleimide, an artifact peak was detected (Figure S6a), but it is challenging to determine its formula and structures because the NIST mass spectral library could not offer a tentative result with a high probability. As a result, we only reported its mass spectrum in Figure S6b. In addition, we found that all of the artifact products discussed above could be detected immediately by GC/EI–MS once the chemical standards of BrC chromophores were dissolved in MeOH, showing the SOA composition could change rapidly during MeOH extraction.
Figure 4. EICs of carbonyl chromophores and their artifact products from reactions with MeOH. (a–c) Three chromophores identified in the ACN-extracted SOA samples, while (d–f) represent their chemical standards in ACN solutions. (g–i) The artifact products identified in the MeOH-extracted SOA samples, while (j–l) exhibit the artifact products in MeOH solutions of chemical standards of the three chromophores.
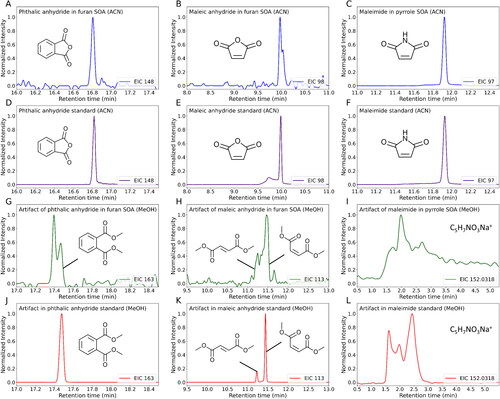
Pacher et al. (Citation2010) have previously reported that imide may undergo methanolysis in the MeOH solution under room temperature. The methanolysis product of maleimide is expected to be produced during the MeOH extraction process, which should have a MeOH-added formula (i.e., C5H7NO3). Because GC/EI–MS did not show results for C5H7NO3, LC–DAD–ESI–Q-TOFMS was used to probe the C5H7NO3 in the MeOH solution of maleimide. The EIC of C5H7NO3Na+ shows three peaks (), suggesting the presence of three isomers of the formula C5H7NO3, while also confirms their presence in methanol extracted SOA samples. Notably, show different relative intensities among these peaks, suggesting that the artifact products may further react with other analytes in the SOA samples, or other SOA constituents with the same formula (i.e., C5H7NO3) may exist.
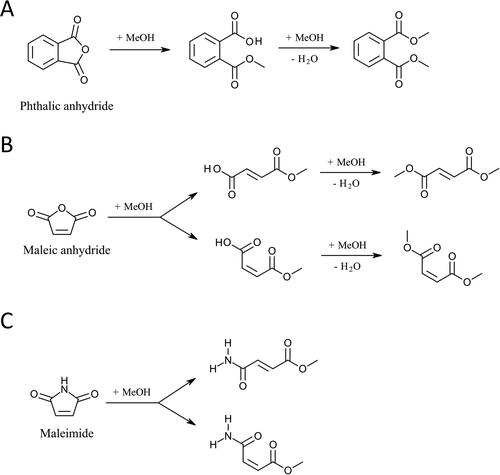
Based on our experimental characterizations, the mechanisms leading to formation of artifacts are proposed in . The proposed products in are based on the candidate compounds with the highest matching score identified in GC/EI–MS by the NIST library, which also agree with previously described methanolysis mechanisms for phthalic anhydride and maleic anhydride (Eliel and Burgstahler Citation1949; Sutton, Reed, and Hiles Citation2003). Our GC/EI–MS analysis detected all four artifact products once maleic anhydride was dissolved in MeOH (Figures S7a and b), showing that the amount of intermediate products from methanolysis decreased (Figures S7a and c) while further esterification products increased (Figures S7b and d) over time. Similarly, the proposed products in are derived from the molecular formula identified by LC–DAD–ESI–Q-TOFMS and the reported methanolysis mechanism of cyclic imides (Kavitha et al. Citation2016). While methanolysis is expected to form two products, the maleimide artifacts have three peaks, suggesting that other pathways may also be involved. One possibility is that the hemiacetal could be generated from direct addition of MeOH to the carbonyl group, as proposed by Bateman et al. (Citation2008). Notably, GC/EI–MS and LC–DAD–ESI–Q-TOFMS may only identify a subset of artifact products; other artifact reaction pathways in MeOH may occur. In addition, the detected chromophores can contribute to solvent artifacts in most of our SOA samples (); however, chromophores capable of initiating artifact products in thiophene SOA and 2-methylthiophene SOA were not identified in the current study due to the limitation of the NIST library or a lack of commercially available chemical standards. Nevertheless, our results highlight that methanolysis may play a significant role in the solvent–analyte interactions that occur during MeOH extraction of SOA samples.
Figure 5. Proposed artifact formation mechanisms in MeOH for the identified BrC chromophores.
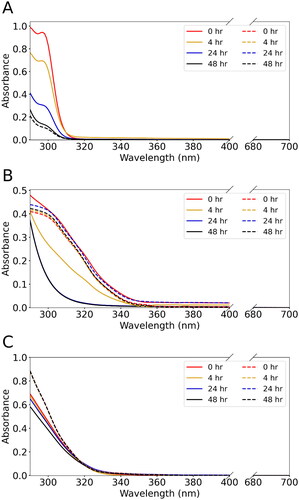
Furthermore, the identified chromophores account for a considerable fraction (∼0.1–5.0%) of the total SOA mass in various samples (), revealing that solvent artifacts may be influential in altering the light-absorption properties of the studied BrC systems. shows that the light absorbance of all three chromophores decreases in MeOH solutions over time within the 290–350 nm wavelength range compared to the same amount of chromophores dissolved in ACN solutions, indicating that chromophores could continue to react with MeOH and change the light absorbance. At a starting concentration of 100 ng μl−1, the chromophore molecules could be undetectable (Figures S8a and b) or largely consumed (Figure S8c) as soon as the SOA samples were dissolved in MeOH, indicating that the artifact products could significantly modify the light absorbance at the concentration and time scale relevant to offline SOA analysis. Nevertheless, given the low absorbance of identified chromophores at 375 nm ( and Figure S5), other artifact products may also exist and contribute to the deviation of MAC375 in . Indeed, the solvent effect is a multifactorial interference in the light-absorption properties of BrC, where solvent artifact is an important component while other factors in the preceded discussions, such as solvent selectivity and perturbation on molecular spectral absorptivity due to solvation of chromophores, can also contribute to the change of light absorption of the BrC samples.
Figure 6. Changes in UV–Vis spectra of MeOH-dissolved (solid line) and ACN-dissolved (dash line) chromophore solutions over time for (a) phthalic anhydride, (b) maleic anhydride, and (c) maleimide standards. The UV–Vis spectra were measured at 0, 4, 24, and 48 h after the dissolution of chromophore standards in MeOH. For each chromophore, the starting mass concentrations in both solvents were the same.
4. Conclusions
This study compared the differences between online and offline MAC375, revealed the discrepancy of AAE between MeOH- and ACN-extracted SOA samples, and identified the chromophores that may generate artifacts in MeOH-extracted BrC samples. Our results indicated that sample extraction with different solvents could not only cause deviations in MAC375 at different levels but also lead to divergent AAE290/400 and AAE400/600, which requires further comparisons with online measurements of AAE to better evaluate the influence of solvent effects. ATR-FTIR analysis enabled the characterization of ubiquitous conjugated carbonyls in the SOA samples, whereas multi-instrumental analysis revealed that the conjugated carbonyl chromophores, including phthalic anhydride, maleic anhydride and maleimide could generate artifacts in MeOH. These results highlight the importance of methanolysis in the artifact mechanisms; consequently, an inert solvent such as ACN may be more ideal for offline analysis of BrC compositions.
Furthermore, the three chromophores discussed in this study are also prevalent in other SOA systems. Maleic anhydride is a product of photooxidation of anthropogenic aromatic VOCs such as benzene and toluene (Bandow, Washida, and Akimoto Citation1985; Forstner, Flagan, and Seinfeld Citation1997; Hamilton et al. Citation2003; Jang and Kamens Citation2001), and derivatives of maleic anhydride have also been identified in the field aerosol samples (Al-Naiema, Roppo, and Stone Citation2017). Additionally, Montoya-Aguilera et al. detected maleic anhydride and maleimide in the SOA generated from photooxidation of indole (Montoya-Aguilera et al. Citation2017), and several studies have reported phthalic anhydride as a product of daytime oxidation of PAHs (Al-Naiema and Stone Citation2017; Chan et al. Citation2009; Jang and McDow Citation1997; Kautzman et al. Citation2010). Notably, maleic anhydride and phthalic anhydride have been widely observed in ambient aerosols from biomass burning plumes or fuel combustion (Al-Naiema, Roppo and Stone Citation2017; Al-Naiema and Stone Citation2017; Bruns et al. Citation2017; Gao et al. Citation2022; Jeon et al. Citation2019; Oyama et al. Citation2016). All these studies support that the MeOH-extraction artifacts observed in our study are expected to affect the characterization of BrC composition and optical properties from various primary and secondary sources. In addition, dimethyl phthalate is a globally distributed pollutant confirmed by solvent-free characterization of ambient aerosol compositions (Li et al. Citation2022); extraction of SOA samples with MeOH is expected to affect the quantification of dimethyl phthalate if phthalic anhydride is also present. Hence, offline analysis using MeOH as the solvent may introduce significant interferences into the SOA compositional analysis.
However, some limitations of using ACN in offline analysis should not be overlooked. Apart from its lower solubility for certain SOA constituents (e.g., carboxylic acids [Bradley et al. Citation2010]) when compared to MeOH, a previous study has also indicated that a trace amount of water in ACN in the extracted SOA samples is capable of hydrolyzing some reactive functional groups such as organic hydroperoxides (Hu et al. Citation2020). Moreover, since ACN and MeOH are both polar solvents, nonpolar chromophores that cannot be extracted could be underestimated. Overall, our study demonstrated that offline results of BrC light absorption should be interpreted with caution and carefully used in modeling studies.
Supplemental Material
Download PDF (1.1 MB)Acknowledgments
We gratefully thank Dr. Lingchao Zhu and Dr. Jie Zhou at UCR Analytical Chemistry Instrumentation Facility (ACIF) for their assistance in ATR-FTIR and UPLC–DAD–ESI–Q-TOFMS measurements, and Bradley Ries at the Department of Environmental Sciences at UCR for his assistance in the Mie calculations.
Additional information
Funding
References
- Al-Naiema, I. M., H. M. Roppo, and E. A. Stone. 2017. Quantification of furandiones in ambient aerosol. Atmos. Environ. 153:41–46. doi:10.1016/j.atmosenv.2017.01.002.
- Al-Naiema, I. M., and E. A. Stone. 2017. Evaluation of anthropogenic secondary organic aerosol tracers from aromatic hydrocarbons. Atmos. Chem. Phys. 17 (3):2053–2065. doi:10.5194/acp-17-2053-2017.
- Allan, J. D., A. E. Delia, H. Coe, K. N. Bower, M. R. Alfarra, J. L. Jimenez, A. M. Middlebrook, F. Drewnick, T. B. Onasch, M. R. Canagaratna, et al. 2004. A generalised method for the extraction of chemically resolved mass spectra from aerodyne aerosol mass spectrometer data. J. Aerosol. Sci. 35 (7):909–922. doi:10.1016/j.jaerosci.2004.02.007.
- Bahreini, R., M. D. Keywood, N. L. Ng, V. Varutbangkul, S. Gao, R. C. Flagan, J. H. Seinfeld, D. R. Worsnop, and J. L. Jimenez. 2005. Measurements of secondary organic aerosol from oxidation of cycloalkenes, terpenes, and m-xylene using an aerodyne aerosol mass spectrometer. Environ. Sci. Technol. 39 (15):5674–5688. doi:10.1021/es048061a.
- Bahreini, R., A. M. Middlebrook, C. A. Brock, J. A. de Gouw, S. A. McKeen, L. R. Williams, K. E. Daumit, A. T. Lambe, P. Massoli, M. R. Canagaratna, et al. 2012. Mass spectral analysis of organic aerosol formed downwind of the deepwater horizon oil spill: Field studies and laboratory confirmations. Environ. Sci. Technol. 46 (15):8025–8034. doi:10.1021/es301691k.
- Bai, Z., L. Zhang, Y. Cheng, W. Zhang, J. Mao, H. Chen, L. Li, L. Wang, and J. Chen. 2020. Water/methanol-insoluble brown carbon can dominate aerosol-enhanced light absorption in port cities. Environ. Sci. Technol. 54 (23):14889–14898. doi:10.1021/acs.est.0c03844.
- Bandow, H., N. Washida, and H. Akimoto. 1985. Ring-cleavage reactions of aromatic hydrocarbons studied by FT–IR spectroscopy. I. Photooxidation of toluene and benzene in the nox–air system. BCSJ. 58 (9):2531–2540. doi:10.1246/bcsj.58.2531.
- Bateman, A. P., M. L. Walser, Y. Desyaterik, J. Laskin, A. Laskin, and S. A. Nizkorodov. 2008. The effect of solvent on the analysis of secondary organic aerosol using electrospray ionization mass spectrometry. Environ. Sci. Technol. 42 (19):7341–7346. doi:10.1021/es801226w.
- Benassi, E., C. Cappelli, B. Carlotti, and V. Barone. 2014. An integrated computational tool to model the broadening of the absorption bands of flexible dyes in solution: Cationic chromophores as test cases. Phys. Chem. Chem. Phys. 16 (48):26963–26973. doi:10.1039/C4CP03419H.
- Bluvshtein, N., J. M. Flores, L. Segev, and Y. Rudich. 2016. A new approach for retrieving the uv–vis optical properties of ambient aerosols. Atmos. Meas. Tech. 9 (8):3477–3490. doi:10.5194/amt-9-3477-2016.
- Bluvshtein, N., P. Lin, J. M. Flores, L. Segev, Y. Mazar, E. Tas, G. Snider, C. Weagle, S. S. Brown, A. Laskin, et al. 2017. Broadband optical properties of biomass-burning aerosol and identification of brown carbon chromophores. J. Geophys. Res. Atmos. 122 (10):5441–5456. doi:10.1002/2016JD026230.
- Bradley, J.-C., C. Neylon, R. Guha, A. Williams, B. Hooker, A. Lang, B. Friesen, T. Bohinski, D. Bulger, M. Federici, et al. 2010. Open notebook science challenge: Solubilities of organic compounds in organic solvents. Nat. Prec. doi:10.1038/npre.2010.4243.3.
- Branca, C., G. D'Angelo, C. Crupi, K. Khouzami, S. Rifici, G. Ruello, and U. Wanderlingh. 2016. Role of the oh and NH vibrational groups in polysaccharide-nanocomposite interactions: A FTIR-ATR study on chitosan and chitosan/clay films. Polymer 99:614–622. doi:10.1016/j.polymer.2016.07.086.
- Brown, H., X. Liu, Y. Feng, Y. Jiang, M. Wu, Z. Lu, C. Wu, S. Murphy, and R. Pokhrel. 2018. Radiative effect and climate impacts of brown carbon with the community atmosphere model (cam5). Atmos. Chem. Phys. 18 (24):17745–17768. doi:10.5194/acp-18-17745-2018.
- Bruns, E. A., J. G. Slowik, I. E. Haddad, D. Kilic, F. Klein, J. Dommen, B. Temime-Roussel, N. Marchand, U. Baltensperger, and A. S. H. Prévôt. 2017. Characterization of gas-phase organics using proton transfer reaction time-of-flight mass spectrometry: Fresh and aged residential wood combustion emissions. Atmos. Chem. Phys. 17 (1):705–720. doi:10.5194/acp-17-705-2017.
- Cao, G., Y. Yan, X. Zou, R. Zhu, and F. Ouyang. 2018. Applications of infrared spectroscopy in analysis of organic aerosols. Spectr. Anal. Rev. 06 (01):12–32. doi:10.4236/sar.2018.61002.
- Chan, A. W. H., K. E. Kautzman, P. S. Chhabra, J. D. Surratt, M. N. Chan, J. D. Crounse, A. Kürten, P. O. Wennberg, R. C. Flagan, and J. H. Seinfeld. 2009. Secondary organic aerosol formation from photooxidation of naphthalene and alkylnaphthalenes: Implications for oxidation of intermediate volatility organic compounds (IVOCS). Atmos. Chem. Phys. 9 (9):3049–3060. doi:10.5194/acp-9-3049-2009.
- Chen, J. Y., E. Rodriguez, H. Jiang, K. Chen, A. Frie, H. Zhang, R. Bahreini, and Y.-H. Lin. 2020. Time-dependent density functional theory investigation of the UV–vis spectra of organonitrogen chromophores in brown carbon. ACS Earth Space Chem. 4 (2):311–320. doi:10.1021/acsearthspacechem.9b00328.
- Chen, Q., F. Ikemori, H. Higo, D. Asakawa, and M. Mochida. 2016. Chemical structural characteristics of HULIS and other fractionated organic matter in urban aerosols: Results from mass spectral and FT-IR analysis. Environ. Sci. Technol. 50 (4):1721–1730. doi:10.1021/acs.est.5b05277.
- Chen, Y., and T. C. Bond. 2010. Light absorption by organic carbon from wood combustion. Atmos. Chem. Phys. 10 (4):1773–1787. doi:10.5194/acp-10-1773-2010.
- Cheng, Y., K.-b. He, Z.-y. Du, G. Engling, J.-m. Liu, Y.-l. Ma, M. Zheng, and R. J. Weber. 2016. The characteristics of brown carbon aerosol during winter in Beijing. Atmos. Environ. 127:355–364. doi:10.1016/j.atmosenv.2015.12.035.
- Dingle, J. H., S. Zimmerman, A. L. Frie, J. Min, H. Jung, and R. Bahreini. 2019. Complex refractive index, single scattering albedo, and mass absorption coefficient of secondary organic aerosols generated from oxidation of biogenic and anthropogenic precursors. Aerosol. Sci. Tech 53 (4):449–463. doi:10.1080/02786826.2019.1571680.
- Eliel, E. L., and A. W. Burgstahler. 1949. Synthesis of methyl phthalaldehydate and phthalaldehydic acid by the rosenmund reduction. J. Am. Chem. Soc. 71 (6):2251–2252. doi:10.1021/ja01174a509.
- Feng, Y., V. Ramanathan, and V. R. Kotamarthi. 2013. Brown carbon: A significant atmospheric absorber of solar radiation? Atmos. Chem. Phys. 13 (17):8607–8621. doi:10.5194/acp-13-8607-2013.
- Forstner, H. J. L., R. C. Flagan, and J. H. Seinfeld. 1997. Secondary organic aerosol from the photooxidation of aromatic hydrocarbons: Molecular composition. Environ. Sci. Technol. 31 (5):1345–1358. doi:10.1021/es9605376.
- Gao, Y., H. Wang, Y. Liu, X. Zhang, S. Jing, Y. Peng, D. Huang, X. Li, S. Chen, S. Lou, et al. 2022. Unexpected high contribution of residential biomass burning to non-methane organic gases (NMOGs) in the Yangtze River Delta region of China. J. Geophys. Res. Atmos 127:e2021. doi:10.1029/2021JD035050.
- Hamilton, J. F., A. C. Lewis, C. Bloss, V. Wagner, A. P. Henderson, B. T. Golding, K. Wirtz, M. Martin-Reviejo, and M. J. Pilling. 2003. Measurements of photo-oxidation products from the reaction of a series of alkyl-benzenes with hydroxyl radicals during exact using comprehensive gas chromatography. Atmos. Chem. Phys. 3 (6):1999–2014. doi:10.5194/acp-3-1999-2003.
- He, Q., S. Tomaz, C. Li, M. Zhu, D. Meidan, M. Riva, A. Laskin, S. S. Brown, C. George, X. Wang, et al. 2021. Optical properties of secondary organic aerosol produced by nitrate radical oxidation of biogenic volatile organic compounds. Environ. Sci. Technol. 55 (5):2878–2889. doi:10.1021/acs.est.0c06838.
- Hettiyadura, A. P. S., V. Garcia, C. Li, C. P. West, J. Tomlin, Q. He, Y. Rudich, and A. Laskin. 2021. Chemical composition and molecular-specific optical properties of atmospheric brown carbon associated with biomass burning. Environ. Sci. Technol. 55 (4):2511–2521. doi:10.1021/acs.est.0c05883.
- Hu, M., K. Chen, J. Qiu, Y.-H. Lin, K. Tonokura, and S. Enami. 2020. Temperature dependence of aqueous-phase decomposition of α-hydroxyalkyl-hydroperoxides. J. Phys. Chem. A 124 (49):10288–10295. doi:10.1021/acs.jpca.0c09862.
- Jang, M, and R. M. Kamens. 2001. Characterization of secondary aerosol from the photooxidation of toluene in the presence of nox and 1-propene. Environ. Sci. Technol. 35 (18):3626–3639. doi:10.1021/es010676+.
- Jang, M, and S. R. McDow. 1997. Products of benz[a]anthracene photodegradation in the presence of known organic constituents of atmospheric aerosols. Environ. Sci. Technol. 31 (4):1046–1053. doi:10.1021/es960559s.
- Jeon, S., H. Lim, N. Choi, J. Lee, Y. Ahn, and Y. Kim. 2019. Classification and characterization of organic aerosols in the atmosphere over Seoul using two dimensional gas chromatography-time of flight mass spectrometry (gc × gc/tof-ms) data. Asian J. Atmos. Environ.. 13 (2):88–98. doi:10.5572/ajae.2019.13.2.088.
- Jiang, H., A. L. Frie, A. Lavi, J. Y. Chen, H. Zhang, R. Bahreini, and Y.-H. Lin. 2019. Brown carbon formation from nighttime chemistry of unsaturated heterocyclic volatile organic compounds. Environ. Sci. Technol. Lett. 6 (3):184–190. doi:10.1021/acs.estlett.9b00017.
- Kautzman, K. E., J. D. Surratt, M. N. Chan, A. W. H. Chan, S. P. Hersey, P. S. Chhabra, N. F. Dalleska, P. O. Wennberg, R. C. Flagan, and J. H. Seinfeld. 2010. Chemical composition of gas- and aerosol-phase products from the photooxidation of naphthalene. J. Phys. Chem. A 114 (2):913–934. doi:10.1021/jp908530s.
- Kavitha, K., K. S. Shanthi Praveena, E. V. Venkat Shivaji Ramarao, N. Y. Sreenivasa Murthy, and S. Pal. 2016. Chemistry of cyclic imides: An overview on the past, present and future. COC. 20 (19):1955–2001. doi:10.2174/1385272820666160530145014.
- Kristensen, K., and M. Glasius. 2011. Organosulfates and oxidation products from biogenic hydrocarbons in fine aerosols from a forest in North West Europe during spring. Atmos. Environ. 45 (27):4546–4556. doi:10.1016/j.atmosenv.2011.05.063.
- Lanzafame, G. M., D. Srivastava, O. Favez, B. A. M. Bandowe, P. Shahpoury, G. Lammel, N. Bonnaire, L. Y. Alleman, F. Couvidat, B. Bessagnet, et al. 2021. One-year measurements of secondary organic aerosol (SOA) markers in the Paris region (France): Concentrations, gas/particle partitioning and SOA source apportionment. Sci. Total Environ. 757:143921. doi:10.1016/j.scitotenv.2020.143921.
- Laskin, A., J. Laskin, and S. A. Nizkorodov. 2015. Chemistry of atmospheric brown carbon. Chem. Rev. 115 (10):4335–4382. doi:10.1021/cr5006167.
- Li, C., Q. He, A. P. S. Hettiyadura, U. Käfer, G. Shmul, D. Meidan, R. Zimmermann, S. S. Brown, C. George, A. Laskin, et al. 2020. Formation of secondary brown carbon in biomass burning aerosol proxies through NO3 radical reactions. Environ. Sci. Technol. 54 (3):1395–1405. doi:10.1021/acs.est.9b05641.
- Li, X., Z. An, Y. Shen, Y. Yuan, F. Duan, and J. Jiang. 2022. Dynamic variations of phthalate esters in PM2.5 during a pollution episode. Sci. Total Environ. 810:152269. doi:10.1016/j.scitotenv.2021.152269.
- Lin, G., J. E. Penner, M. G. Flanner, S. Sillman, L. Xu, and C. Zhou. 2014. Radiative forcing of organic aerosol in the atmosphere and on snow: Effects of SOA and brown carbon. J. Geophys. Res. Atmos. 119 (12):7453–7476. doi:10.1002/2013JD021186.
- Lin, P., P. K. Aiona, Y. Li, M. Shiraiwa, J. Laskin, S. A. Nizkorodov, and A. Laskin. 2016. Molecular characterization of brown carbon in biomass burning aerosol particles. Environ. Sci. Technol. 50 (21):11815–11824. doi:10.1021/acs.est.6b03024.
- Lin, P., N. Bluvshtein, Y. Rudich, S. A. Nizkorodov, J. Laskin, and A. Laskin. 2017. Molecular chemistry of atmospheric brown carbon inferred from a nationwide biomass burning event. Environ. Sci. Technol. 51 (20):11561–11570. doi:10.1021/acs.est.7b02276.
- Lin, P., L. T. Fleming, S. A. Nizkorodov, J. Laskin, and A. Laskin. 2018. Comprehensive molecular characterization of atmospheric brown carbon by high resolution mass spectrometry with electrospray and atmospheric pressure photoionization. Anal. Chem. 90 (21):12493–12502. doi:10.1021/acs.analchem.8b02177.
- Lin, P., J. Liu, J. E. Shilling, S. M. Kathmann, J. Laskin, and A. Laskin. 2015. Molecular characterization of brown carbon (brc) chromophores in secondary organic aerosol generated from photo-oxidation of toluene. Phys. Chem. Chem. Phys. 17 (36):23312–23325. doi:10.1039/C5CP02563J.
- Lin, Y.-H., S. H. Budisulistiorini, K. Chu, R. A. Siejack, H. Zhang, M. Riva, Z. Zhang, A. Gold, K. E. Kautzman, and J. D. Surratt. 2014. Light-absorbing oligomer formation in secondary organic aerosol from reactive uptake of isoprene epoxydiols. Environ. Sci. Technol. 48 (20):12012–12021. doi:10.1021/es503142b.
- Liu, J., M. Bergin, H. Guo, L. King, N. Kotra, E. Edgerton, and R. J. Weber. 2013. Size-resolved measurements of brown carbon in water and methanol extracts and estimates of their contribution to ambient fine-particle light absorption. Atmos. Chem. Phys. 13 (24):12389–12404. doi:10.5194/acp-13-12389-2013.
- Moise, T., J. M. Flores, and Y. Rudich. 2015. Optical properties of secondary organic aerosols and their changes by chemical processes. Chem. Rev. 115 (10):4400–4439. doi:10.1021/cr5005259.
- Montoya-Aguilera, J., J. R. Horne, M. L. Hinks, L. T. Fleming, V. Perraud, P. Lin, A. Laskin, J. Laskin, D. Dabdub, and S. A. Nizkorodov. 2017. Secondary organic aerosol from atmospheric photooxidation of indole. Atmos. Chem. Phys. 17 (18):11605–11621. doi:10.5194/acp-17-11605-2017.
- Nguyen, T. B., A. Laskin, J. Laskin, and S. A. Nizkorodov. 2013. Brown carbon formation from ketoaldehydes of biogenic monoterpenes. Faraday Discuss. 165:473–94. doi:10.1039/C3FD00036B.
- Ortuso, R. D., N. Ricardi, T. Bürgi, T. A. Wesolowski, and K. Sugihara. 2019. The deconvolution analysis of ATR-FTIR spectra of diacetylene during UV exposure. Spectrochim. Acta A Mol. Biomol. Spectrosc. 219:23–32. doi:10.1016/j.saa.2019.04.030.
- Oyama, B. S., M. D. F. Andrade, P. Herckes, U. Dusek, T. Röckmann, and R. Holzinger. 2016. Chemical characterization of organic particulate matter from on-road traffic in São Paulo, Brazil. Atmos. Chem. Phys. 16 (22):14397–14408. doi:10.5194/acp-16-14397-2016.
- Pacher, T., A. Raninger, E. Lorbeer, L. Brecker, P. P.-H. But, and H. Greger. 2010. Alcoholysis of naturally occurring imides: Misleading interpretation of antifungal activities. J. Nat. Prod. 73 (8):1389–93. doi:10.1021/np1003092.
- Russell, L., R. Bahadur, and P. Ziemann. 2011. Identifying organic aerosol sources by comparing functional group composition in chamber and atmospheric particles. Proc. Natl. Acad. Sci. U S A. 108 (9):3516–3521. doi:10.1073/pnas.1006461108.
- Saleh, R. 2020. From measurements to models: Toward accurate representation of brown carbon in climate calculations. Curr. Pollut. Rep. 6 (2):90–104. doi:10.1007/s40726-020-00139-3.
- Savitzky, A., and M. J. E. Golay. 1964. Smoothing and differentiation of data by simplified least squares procedures. Anal. Chem. 36 (8):1627–1639. doi:10.1021/ac60214a047.
- Shen, Z., Y. Lei, L. Zhang, Q. Zhang, Y. Zeng, J. Tao, C. Zhu, J. Cao, H. Xu, and S. Liu. 2017. Methanol extracted brown carbon in PM2.5 over Xi’an, China: Seasonal variation of optical properties and sources identification. Aerosol. Sci. Eng. 1 (2):57–65. doi:10.1007/s41810-017-0007-z.
- Singh, H. B., B. E. Anderson, W. H. Brune, C. Cai, R. C. Cohen, J. H. Crawford, M. J. Cubison, E. P. Czech, L. Emmons, H. E. Fuelberg, et al. 2010. Pollution influences on atmospheric composition and chemistry at high northern latitudes: Boreal and California forest fire emissions. Atmos. Environ. 44 (36):4553–4564. doi:10.1016/j.atmosenv.2010.08.026.
- Song, J., M. Li, X. Fan, C. Zou, M. Zhu, B. Jiang, Z. Yu, W. Jia, Y. Liao, and P. a Peng. 2019. Molecular characterization of water- and methanol-soluble organic compounds emitted from residential coal combustion using ultrahigh-resolution electrospray ionization Fourier transform ion cyclotron resonance mass spectrometry. Environ. Sci. Technol. 53 (23):13607–13617. doi:10.1021/acs.est.9b04331.
- Srour, B., S. Bruechert, S. L. A. Andrade, and P. Hellwig. 2017. Secondary structure determination by means of ATR-FTIR spectroscopy. In Membrane protein structure and function characterization: Methods and protocols, ed. J.-J. Lacapere, 195–203. New York, NY: Springer New York.
- Sun, H., L. Biedermann, and T. C. Bond. 2007. Color of brown carbon: A model for ultraviolet and visible light absorption by organic carbon aerosol. Geophys. Res. Lett. 34 (17):L17813. doi:10.1029/2007GL029797.
- Sutton, D. M., G. Reed, and A. G. Hiles. 2003. Process for the production of esters of mono-,di-or polycarboxylic acids. Patent US7816554B2, WO2005/051885.
- Svečnjak, L., D. Bubalo, G. Baranović, and H. Novosel. 2015. Optimization of FTIR-ATR spectroscopy for botanical authentication of unifloral honey types and melissopalynological data prediction. Eur. Food Res. Technol. 240 (6):1101–1115. doi:10.1007/s00217-015-2414-1.
- Trofimova, A., R. F. Hems, T. Liu, J. P. D. Abbatt, and E. G. Schnitzler. 2019. Contribution of charge-transfer complexes to absorptivity of primary brown carbon aerosol. ACS Earth Space Chem. 3 (8):1393–1401. doi:10.1021/acsearthspacechem.9b00116.
- Updyke, K. M., T. B. Nguyen, and S. A. Nizkorodov. 2012. Formation of brown carbon via reactions of ammonia with secondary organic aerosols from biogenic and anthropogenic precursors. Atmos. Environ. 63:22–31. doi:10.1016/j.atmosenv.2012.09.012.
- Walser, M. L., Y. Desyaterik, J. Laskin, A. Laskin, and S. A. Nizkorodov. 2008. High-resolution mass spectrometric analysis of secondary organic aerosol produced by ozonation of limonene. Phys. Chem. Chem. Phys. 10 (7):1009–1022. doi:10.1039/B712620D.
- Xie, M., X. Chen, M. D. Hays, and A. L. Holder. 2019. Composition and light absorption of n-containing aromatic compounds in organic aerosols from laboratory biomass burning. Atmos. Chem. Phys. 19 (5):2899–2915. doi:10.5194/acp-19-2899-2019.
- Yan, F., S. Kang, M. Sillanpää, Z. Hu, S. Gao, P. Chen, S. Gautam, S.-P. Reinikainen, and C. Li. 2020. A new method for extraction of methanol-soluble brown carbon: Implications for investigation of its light absorption ability. Environ. Pollut. 262:114300. doi:10.1016/j.envpol.2020.114300.
- Yu, X., W. Song, Q. Yu, S. Li, M. Zhu, Y. Zhang, W. Deng, W. Yang, Z. Huang, X. Bi, et al. 2018. Fast screening compositions of PM2.5 by ATR-FTIR: Comparison with results from IC and OC/EC analyzers. J Environ Sci (China) 71:76–88. doi:10.1016/j.jes.2017.11.021.
- Zhang, A., Y. Wang, Y. Zhang, R. J. Weber, Y. Song, Z. Ke, and Y. Zou. 2020. Modeling the global radiative effect of brown carbon: A potentially larger heating source in the tropical free troposphere than black carbon. Atmos. Chem. Phys. 20 (4):1901–20. doi:10.5194/acp-20-1901-2020.