
 ?Mathematical formulae have been encoded as MathML and are displayed in this HTML version using MathJax in order to improve their display. Uncheck the box to turn MathJax off. This feature requires Javascript. Click on a formula to zoom.
Abstract
The SARS-CoV-2 pandemic forced many restrictions upon the public, such as the closing of schools, affecting social development and education of children. Here we tested air purifiers with HEPA filters as a measure to reduce the infection risk via airborne transmission during classes. We evaluated the efficiency and long-term performance of three devices over six month of operation at two schools by monitoring the particle decay from 0.003 to 10 µm. We found that the particle concentration was reduced reliably and spatially homogenously by 85 − 95% throughout the whole observed particle spectrum within ∼20 min for air exchange rates between 4.8 and 6.7 h−1. During the study we did not observe a clear decline in efficiency or performance of the air purifiers. We complemented our particle measurements with model calculations to estimate the virus concentration and inhaled dose of a susceptible person, assuming one infectious person was present. We calculated that the additional use of air purifiers reduced the number of potentially inhaled viruses at the end of the day by a factor of 2.65 relative to the case without air purifiers. Further, school-wide surveys indicated that the disturbance by the noise level of the air purifiers is to be considered and that the acceptance of air purifiers can be improved when the noise level is reduced. Overall, our study suggests that a combination of air purifiers and venting is a well-suited measure to reduce the potential indoor viral-load while still introducing fresh air into the room.
EDITOR:
1. Introduction
The SARS-CoV-2 pandemic has forced our society to adjust many of our individual habits, refrain from certain activities and changed the ways in which we interact socially. Private and public life has been severely restricted for longer periods of time in many countries of the world. Major progress has been made since the beginning of the pandemic to develop measures to contain the spread and to reduce the severity of the disease, e.g., through the development and application of vaccines. Nevertheless, during this pandemic several severe infection waves were observed, accompanied by high numbers of daily infections. As SARS-CoV-2 is constantly evolving, new viral mutants may be more infectious (Harvey et al. Citation2021; Tian et al. Citation2022), increase the possibility of reinfection (Pulliam et al. Citation2022) or lead to more severe cases causing higher hospitalization rates (Twohig et al. Citation2022). Depending on the current state of the pandemic in a certain country, specific measures and guidelines may need to be imposed upon the public to protect the vulnerable population and the critical infrastructure. These measures have to be systematically examined under real conditions in terms of practicality and efficiency to reduce the risk of infection.
Within the past two years some of these measures even needed to be imposed upon children, as schools around the world had to be closed several times to prevent further COVID-19 outbreaks and to limit the spread of the virus. Many students had to stay at home and could only attend classes online or needed to be homeschooled by their parents. Children have suffered in particular from lockdowns and contact restrictions (Mansfield et al. Citation2021; Viner et al. Citation2022). Hence, it is highly important to avoid any further closings of schools. Therefore, providing policymakers with the most accurate scientific knowledge about the potential transmission pathways of SARS-CoV-2 and their relative importance, as well as how specific measures influence the infection risk in the school setting is of great significance.
In general, there are four relevant modes of transmission, which can be divided into two major parts: contact and airborne transmission. The former can be described as an indirect infection by touching a contaminated surface or otherwise as a direct infection through contact with an infected person. For the latter, a person inhales airborne particles that were directly emitted from the respiratory tract of an infected person (Leung Citation2021). The emission of virus-laden aerosol particles by an infectious person occurs through sneezing, coughing, talking, especially in a loud voice (Asadi et al. Citation2019), or breathing (Edwards et al. Citation2004; Vuorinen et al. Citation2020; Gutmann et al. Citation2022). Also the size of the emitted aerosol droplets is dependent on the way of exhalation (Morawska et al. Citation2009). Moreover, the size of the aerosol particles is crucial for the deposition probability in the respiratory system (Sosnowski Citation2021) and the residence time in the air (Kohanski, Lo, and Waring Citation2020; Vuorinen et al. Citation2020). If a person is coughing or sneezing, the emitted aerosol particles or droplets can reach a diameter of up to 500 µm (Han, Weng, and Huang Citation2013). Due to their size, most of the particles only stay airborne for a few seconds. Thus, the majority of emitted droplets and aerosol particles via coughing or sneezing are only able to travel about 1.5 − 2 m before sedimenting to the ground or onto surrounding surfaces (Bischoff et al. Citation2013; Renzi and Clarke Citation2020). Therefore, especially people in this immediate radius are at a high risk of getting infected by these larger droplets or aerosol particles. Once the droplets or particles have sedimented to a surface they may still stay viable and cause an infection by contact transmission. While talking, aerosol particles with a typical diameter around 1 µm are emitted (Asadi et al. Citation2019), corresponding to a residence time in the range of minutes to hours. Aerosol particles emitted by breathing are normally in the size range between 0.1 and 0.5 µm, with the majority being smaller than 0.3 µm (Gutmann et al. Citation2022). After the initial emission their diameter decreases further due to evaporation, therefore being small enough to allow the particles to stay airborne for several hours or even days (Kohanski, Lo, and Waring Citation2020). Thus, these smaller aerosol particles can travel further allowing them to disperse evenly in a room. The half-time of SARS-CoV-2 containing aerosol particles can differ in terms of temperature and relative humidity. van Doremalen et al. (Citation2020) assume that these aerosol particles have an average half-time of 1.1 h, whereas other studies find similar numbers, such as Smither et al. (Citation2020) with 30 − 177 min (1.25 h), Dabisch et al. (Citation2021) with 10 − 100 min and Ding et al. (Citation2021) calculated a half-time of speech-aerosol particles of 87 min in stagnant air.
A study from Azimi et al. (Citation2021) examined the different transmission pathways on a cruise ship via modeling and found that more than 50% of the transmission of COVID-19 was caused by airborne transmission. These results agree with many other recent studies suggesting that aerosol infection of SARS-CoV-2 is one important transmission pathway, although these findings are preliminary and need further research (Prather et al. Citation2020; Tang et al. Citation2020; Morawska et al. Citation2021; Tang et al. Citation2021a; Citation2021b). On the other hand, aerosol infections do not pose a major risk for outdoor activities, as only 0.07% of infection events are reported to happen outside (Qian et al. Citation2021). Consequently, most of the infections are happening indoors. Especially if an infectious person is in a closed, poorly ventilated room, virus-laden aerosol particles may accumulate rapidly, posing a high risk of infection.
Lelieveld et al. (Citation2020) estimated that an infected person emits 600 RNA copies within one minute of breathing. Another experimental study by Malik et al. (Citation2021) tested the virus-load in the breath of 15 COVID-19 patients and found that on average each subject exhaled 2200 viruses min−1. Furthermore, one of five infectious persons is likely to be a superspreader (Edwards et al. Citation2021). Here, the infection risk is significantly increased, as these individuals are emitting much higher concentrations of virus-laden aerosol particles and therefore up to 100,000 virus copies per minute (Ma et al. Citation2021). A dose of 100 − 1000 RNA copies inhaled by a healthy person can be sufficient to cause an infection with a probability of 50% (Lelieveld et al. Citation2020), but a range of values is given in the current literature (Bagheri et al. Citation2021; Nordsiek, Bodenschatz, and Bagheri Citation2021) and is not well established yet. Furthermore, most of the current knowledge about these infection-related variables still refers to the original α-variant of the virus and may vary greatly for the currently dominating or future variants.
The typical setting in a school classroom often combines several unfavorable factors regarding the potential to spread an airborne disease: many students, sometimes more than 30 persons, are gathered in a limited space for several hours a day, space limitations often imply that the advised distancing cannot be maintained, and loud speaking is required during classes. Furthermore, many schools are not equipped with a suitable air ventilation system, and in some cases even the windows cannot be opened properly. Knowing that the indirect airborne transmission is highly relevant indoors, it is important to find appropriate measures to reduce the infection risk in order to ensure low infection risks during school operation. Already proven and effective measures to prevent airborne infections are wearing masks, keeping distance, venting the room regularly and using air purifiers (Bazant and Bush Citation2021; Curtius, Granzin, and Schrod Citation2021; Morawska et al. Citation2021).
Face masks have proven to be a very important measure during the pandemic as they both prevent the emission of viruses from an infected person, while also protecting other people from inhaling the virus if they are worn properly (Drewnick et al. Citation2021; Pogačnik Krajnc et al. Citation2021; Schmitt and Wang Citation2021). Furthermore, regular ventilation by opening windows introduces fresh air into a room, thereby diluting and exchanging the potentially virus-laden indoor air. Additionally, rigorous venting prevents the air quality in classrooms from deteriorating due to CO2 enrichment caused by breathing. Poor indoor air quality (IAQ) causes deficiencies in concentration, performance, and productivity. A high standard of IAQ is therefore essential in a school setting, which can be indicated by the indoor CO2 concentration. If the CO2 concentration is below 1000 ppm, no measures are needed. However, at higher concentration levels an air exchange is required (von Pettenkofer Citation1858; Bundesgesundheitsblatt Citation2008). As many schools worldwide are not equipped with Heating, Ventilation and Air Conditioning (HVAC) systems or other means of automated venting, CO2 monitors may be installed to signal if the concentration rises above a certain threshold. In crowded rooms with poor ventilation (e.g., classrooms), the CO2 concentration quickly rises to elevated levels. Therefore, it is highly recommended to ventilate frequently, i.e., every 20 min. However, if outside temperatures are low, frequent venting may significantly decrease the indoor temperature locally and further cause discomfort due to draughts.
Air purifiers can be a suitable additional measure to lower the infection risk during classes. Especially throughout the winter months, the use of air purifiers may compensate for the lack of dilution via ventilation as the time periods between venting events may increase. Air purifiers have been used for many years and it is well known that they are able to reduce the number concentration of aerosol particles reliably and substantially in a room (Offermann et al. Citation1985; Shaughnessy and Sextro Citation2006; Curtius, Granzin, and Schrod Citation2021), which simultaneously lowers the potential virus-load. Air purifiers remove particulate matter from the room air by drawing it through a High-Efficiency Particulate Air (HEPA) filter. The higher the flow rate through the filter, the faster the particle load can be reduced. Some schools in Germany were able to obtain air purifiers for each classroom at the beginning of the second SARS-CoV-2 infection wave (November 2020). Since these air purifiers were usually used for 5–10 h per day, the question arises if the filtration efficiency is affected by the long-term use over the course of a semester.
Here, we present measurements investigating the use of air purifiers to decrease the aerosol particle concentration, thus lowering the infection risk in a school environment during actual lessons. We conducted monthly measurements over the course of more than half a year at two schools in Bad Homburg vor der Höhe, Germany. We used instrumentation to characterize the aerosol number concentration and size distribution over a broad size range during a typical school day. Subsequently, the Clean Air Delivery Rate (CADR) was calculated to assess how well the use of air purifiers is suited as a measure to reduce the infection risks. For this purpose, we used the observed data in combination with a simple model to simulate the concentration and inhaled dose of SARS-CoV-2 in a school room, assuming one infected person is present during an exemplary school day. Further, we examined if and how the long-term efficiency of the air purifiers changed over time. In addition, we measured the room temperature, relative humidity and CO2 concentration to evaluate the benefits and drawbacks of window ventilation at the recommended frequency of once per 20 min. Moreover, we conducted two school-wide surveys on the experiences of practical operation and the acceptance of air purifiers in class.
2. Methods
The following section provides a detailed description of the air purifiers and instrumentation that were used in this study, as well as the exact measurement procedure and locations. Further, we outline the theoretical approach to derive the filter efficiency and introduce the CADR as the corresponding metric. Complementing the measurements, we present the basic equations to estimate the local virus concentrations using a source and sink model. Lastly, we introduce a survey that was conducted among students and teachers in this study.
2.1. Air purifiers
For this long-term study, four different models of air purifiers were tested over the course of six months (Philips AC 2887/10; Philips 4236; Trotec AirgoClean 250 E; Trotec TAC V+). Three of the four air purifiers were regular household appliances, the Trotec TAC V + was a commercial device originally designed for larger premises, such as construction sites. An overview of the different air purifiers and their technical key features is given in . Air purification is achieved by drawing the polluted room air through a HEPA filter. These filters are characterized by a thin fiber-like structure, which removes particles from room air via three mechanisms: Impaction, interception, and diffusion. Coarse particles (>1 µm) collide with the fibers due to their inertia and are consequently removed from the air stream (impaction). Smaller particles in the size range of 0.1 − 1 µm follow the airstream around the fibers, yet most particles still contact the fibers and will thereby be removed from the room air by interception. Particles below a diameter of 0.1 µm move randomly around the streamlines due to the Brownian motion. Therefore, during their “random walk,” they will eventually collide with the fiber and are removed from the room air via diffusion (Schumacher, Asbach, and Schmid Citation2021). Generally, a denser fiber structure of the filter improves the filtration efficiency of fiber-based filters but also increases the flow resistance, consequently requiring a more powerful ventilation system to achieve the same volumetric flow through the filter. The three household appliances are equipped with so-called electret filters. Electret filters are electrostatically charged and thereby alternate the trajectory of charged particles increasing deposition on the fibers. This effect allows for a reduced fiber density compared to a mechanical HEPA filter without reducing the filtration efficiency. However, the effect is reduced over time since the filter is continuously discharged by passing particulate matter and therefore loses efficiency (Schumacher et al. Citation2018). Additionally, all household devices used in this study are equipped with a coarse mesh as a pre-filter to prevent blocking of the HEPA filter by coarse dust and other light dirt (e.g., hairs, fibers of fabric, etc.) along with an active charcoal filter to remove VOCs from the room air. The commercial device features a flow control system to guarantee a constant volumetric air flow through the filter as well as an automated filter regeneration which heats up the filter cassette to approximately 100 °C in order to remove captured volatile particulate matter as well as deactivate bacteria and virus laden aerosol particles, thereby also cleaning the filter fibers. This should ideally prevent losing filter efficiency over time. Further a F9 pre-filter according to EN 779 is installed to pre-clean the air of coarse dust.
Table 1. Technical information about the air purifiers used in this study.
2.2. Filter efficiency
To compare the filter efficiency in various environments for different air purifiers the CADR was derived for each measurement and device. The CADR is a parameter characterizing the particle free air provided by the air purifier and can be described, according to EquationEquation (1)(1)
(1) , as the product of filtration efficiency η and the volumetric flow Q through the filter. Conforming to the Chinese Standard GB/T 18801 (2015) it can also be calculated by determining the difference between the natural particle decay in the room without the air purifier (caused by effects such as coagulation, sedimentation and wall losses) and the decay that is measured when the air purifier is running. Afterwards, for each measurement—natural or filter—a decay constant k is derived by fitting the exponential decay of the particle concentration time series. Resulting uncertainties from fitting the data were taken into account by adding an uncertainty of ±100 m³/h to the calculated CADR (see supplementary information). When subtracting the natural decay constant knat from the total decay constant kAP with the air purifier running, the effects of coagulation, wall losses and sedimentation on the measured particle decay can be separated from the air purifier’s performance. The resulting corrected decay constant is then used to determine the efficiency of the air purifier by multiplying the particle decay constant with the air volume of the room, which is cleaned by the air purifier. Thereby, the clean air delivery rate in m³ per hour is obtained (EquationEquation 2
(2)
(2) ).
(1)
(1)
(2)
(2)
2.3. Measurement procedure and locations
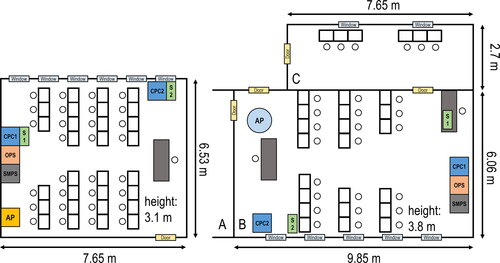
More than 200 decay curves with the air cleaner operating were measured over the course of 25 measurement days spanning over a period of more than six months at two German schools, both in Bad Homburg vor der Höhe, and during test measurements at a seminar room at Goethe University Frankfurt. For both schools the measurements were conducted during classes. Attending student numbers varied during the time of this study due to government-mandated alternations between regular lessons and remote-schooling from a minimum of 8 students up to 28 students plus one teacher. Additionally, at least one scientist was present at any time to monitor the measurements. Two different approaches were selected for the school measurements: At the high school Kaiserin-Friedrich-Gymnasium (KFG) a different classroom was chosen for each day of measurements. All classrooms were equipped with Trotec TAC V + air purifiers running at level 4, which provided a CADR of 1050 m³/h according to the manufacturer. The classroom sizes ranged between 155 and 218 m³ with the air purifiers usually positioned in proximity to one of the walls. At the elementary school Kettler-Franke-Schule (KFS) all measurements were performed in the same classroom. It was sized approx. 227 m³ and equipped with either the Philips AC 4236 or the Trotec AirgoClean 250 E. The Philips AC 4236 was set to ‘turbo’ and the Trotec AirgoClean 250 E to fan speed 3, which according to the manufacturer specification provides a CADR of 610 and 624 m³/h, respectively. The floor plan for the classroom at KFS as well as an exemplary floor plan for the KFG are shown in . The other floor plans can be found in Figure S1 in the supplementary information. During the first two measurement days at KFS (19 January 2021 and 18 February 2021) the door connecting two adjacent classrooms A and B was left open to allow the teacher to simultaneously supervise two different classes. Therefore, an additional air purifier of the same type was placed in classroom B to compensate for the higher total room volume. Both rooms A and B were equal in size. Additionally, on 19 January 2021, 18 February 2021, as well as on 24 June 2021, the door between room B and another small adjacent room C was open for some measurements, since there were several students working individually in room C. Thus, supplementary particle measurements were conducted in the small room. These measurements found decay constants in room C to be significantly lower than the decay constants of room A during the use of the air purifiers due to the layout of the rooms. Therefore, the assumption of the air in the two rooms being homogeneously mixed does not apply, since the exchange of air between the separate rooms was limited. Consequently, we only used the volume of room A when calculating the CADR for the air purifiers at KFS, even at times when the door to room C was opened. However, it is likely that the air purifier did affect room C to a minor extent. The real CADR of the air purifiers in these cases may have been somewhat higher to what was calculated from particle decays observed only in room A. These uncertainties are considered in our estimated error and reflect the circumstances encountered during the measurements in busy classrooms with regular classes taking place.
Figure 1. Layout of one exemplary classroom at KFG (left) and the KFS classroom (right). The positions of the air purifier (AP), the particle instrumentation (CPC1, CPC2, OPS, and SMPS) and the temperature, relative humidity and CO2 sensors (S1 and S2) are indicated.
Each measurement lasted for the whole school day, usually starting at 08:00 am. With only a few exceptions, the windows were opened during lessons approximately every 20 min for the duration of five minutes, as specified by the German federal environmental agency (Umweltbundesamt, UBA). In between two ventilation events the particle decay induced by the air purifiers was measured.
All of the measurements of the air purifier performance were conducted by monitoring the decay of the (total and size-resolved) aerosol number concentration over time. Particulate matter from the outside enters the room when windows are open. After closing the windows and door the aerosol number concentration decreases exponentially due to the action of the air purifiers. To monitor the whole particle spectrum of interest for aerosol transmission of COVID-19 (0.01 − 10 µm), ultrafine condensation particle counters (uCPCs), a Scanning Mobility Particle Sizer (SMPS) and an optical particle sizer (OPS) were operated (see Sections 2.4 and 2.5). We assume that potentially emitted SARS-CoV-2 containing aerosol particles spread rapidly throughout the room, leading to well-mixed conditions. Subsequently, the airborne viral concentration could be assumed to decrease proportionally with the measured total particle concentration during air purification if a homogeneous decay is observed throughout the complete aerosol size spectrum.
At Goethe University we used a seminar room (130 m³) to derive the CADR of all air purifiers in a near-laboratory setting, utilizing the same instrumentation as in the schools. To achieve reproducible results a systematic measurement concept was developed. Therefore, the air purifier was placed in the middle of the room without any direct obstacles, located approximately 2 m away from the particle instrumentation. The particles in the room were generated using a nebulizer with 1%-NaCl solution. During the particle enrichment phase two fans were running in order to provide near instantaneous homogeneous mixing in the entire room. When the particle concentration reached 100,000 cm−3 the nebulizer and the fans were switched off and the respective air purifier was turned on. The experiments were stopped after the number concentration was lowered by two orders of magnitude. Windows and doors were tightly closed during the decay measurements. The same procedure was also carried out for measurements of the natural decays, which were typically performed directly after the measurements with air purifiers. Additionally, a fourth air purifier of the model Philips AC 2887/10 was used to determine the long-term filter efficiency of an electret HEPA filter. Therefore, the air purifier was placed in an airtight box, filtering outdoor air via a 10 cm diameter, 1.5 m long sampling probe, connected to a port in the laboratory wall for a period of 80 days. During the measurement, the PM10 concentration was recorded to determine the total mass accumulated in the filter. To check the possible change in filtration efficiency the continuous sampling was interrupted several times to determine the CADR of the air purifier applying the previously described method. The air purifier was set to fan speed 3, corresponding to a volumetric flow of 240 m³/h through the filter, according to the manufacturer.
2.4. Particle number concentration
To observe the total particle number concentration, up to three ultrafine condensation particle counters (uCPCs) of the type TSI 3776 with a cutoff of D50 = 0.0025 µm (2.5 nm) were deployed in a classroom. Care was taken to distribute the devices throughout the room to cover measurement points close to the air purifier and also at large distances across the room. The instruments are capable of measuring particle concentration from 0.1 up to 100,000 particles cm−³. During the measurements no additional sampling or drying system was used for any of the instruments. Inside the uCPC the particles are enlarged by condensation with butanol as the working fluid. After enlargement the particles are optically detected. To avoid any health risks for students, teachers or scientists in the room, the butanol-enriched exhaust flow was filtered by activated charcoal. The volumetric sample flow of the instruments was kept at 1.5 liters per minute.
2.5. Particle size distribution
The particle size distribution was monitored over a wide range from 0.01 to 10 µm. For the particle sizes between 0.01 and 0.3 µm a Scanning Mobility Particle Sizer (SMPS, Model 3938, TSI) with an electrostatic classifier (Model 3082, TSI, 101 channels) in combination with a uCPC (Model 3776, TSI) was used. For larger particles between 0.3 and 10 µm an Optical Particle Sizer (OPS, Model 3330, TSI) with 16 channels was deployed.
2.6. CO2 concentration and temperature measurements
To determine the CO2 concentrations and temperatures inside the classrooms a combined CO2, humidity, and temperature logger (Model SD800, Extech) was used. It provided a 5-s average for each of the variables. The temperature was measured by an internal sensor which had a maximal resolution of 0.1 °C and an uncertainty of ±0.8 °C. The CO2 concentration was measured with a dual wavelength non-dispersive infrared (NDIR) sensor with a resolution of 1 ppm and an uncertainty of max. 40 ppm for values ≤1000 ppm and an uncertainty of 5% for values ≤3000 ppm. The reaction time of the sensor to CO2-concentration changes in the room air was ≤2 minutes. For measuring the relative humidity, the device was utilizing a capacitive sensor with a resolution of 0.1% and an uncertainty of ±4% in the range of 10 − 70% RH and ±5% at 70–90% RH. Uncertainties were adopted as stated by the manufacturer.
2.7. Modeling the virus concentration and inhaled dose
In order to assess the real-life benefit of deploying air purifiers in a school environment, we estimated the virus concentration and inhaled virus dose for a case study using simplified model assumptions and the variables derived from the observed aerosol particle data (i.e., the measured CADR and the natural decay rate NDR). The case study for our data from 20 May 2021 follows the actual ventilation and person attendance protocol closely and can therefore be considered as fairly realistic. However, several assumptions still needed to be made, some of which are still rather uncertain at present for the various variants of SARS-CoV-2. For one, we assumed in our scenario that one hypothetically infected person (student) was present during all classes of the day. The infected person was assumed to emit virus particles at a constant virus emission rate VER of 5000 min−1 (300,000 h−1) by speaking and breathing. We assumed in this scenario that nobody is wearing masks, expressed by the variable mask efficiency ME, which is set to 0%. Further, we assumed instant and homogeneous mixing of the emitted particles in the room. The half-life of the virus was assumed to be 1.1 h (van Doremalen et al. Citation2020), which translates to a life-time loss rate LLR of 98 m³/h at the room volume V of 155 m3. The ventilation loss rate VLR was set to 0 m³/h when windows and the door were closed, to 105 m³/h when only the door was opened, to 1045 m³/h when only the windows were opened and to 3130 m³/h when windows and the door were fully opened, following the observed situation in the classroom (Table S1). These ventilation loss rates were estimated from a laboratory experiment (Figure S2) and have a rather high level of uncertainty as they are strongly dependent on the temperature difference between outside and inside, the wind direction and strength, and other parameters. However, we found that the model calculations are not very sensitive to the assumed VLR (Figure S3, Table S2). Adding the information about observed variables of the mean CADR (1045 m³/h) and NDR (60 m³/h), the time derivative of the virus concentration in the room C(t) can be estimated by a differential equation of the first order, modified from the approach presented in Schumacher, Asbach, and Schmid (Citation2021):
(3)
(3)
The time derivative of the inhaled dose D(t) is dependent on the current virus concentration C(t), the inhalation rate IR (assumed as 9 L per minute, i.e., 0.5 m³/h), the mask efficiency ME (0%) and the respiratory deposition efficiency RDE (30%). The RDE covers a wide range, depending on the particle size (Sosnowski Citation2021). When taking into account that the size of virus laden aerosol particles emitted from the lungs varies from approximately 0.2 to 10 µm (Morawska et al. Citation2009), with the largest fraction being <0.2 µm due to immediate evaporation, an average RDE has to be determined. According to the study from Sosnowski (Citation2021), an average RDE of 30% was assumed.
(4)
(4)
In order to specifically evaluate the effect of the air purifiers, we considered a case with air purifiers running as observed (reference scenario) and a hypothetical case that had no air purifiers present (scenario AP_off).
2.8. Survey
In order to not only evaluate the technical function of the air purifiers but also the acceptance by the students and teachers, we conducted two school-wide surveys regarding the use of air purifiers during classes at the KFG. The first one was conducted on the last day of school before summer break on 16 July 2021 representing summer time with high temperatures around 25 °C outside and the second one during the last days before Christmas break between the 16 and 22 December 2021 with much colder outside temperatures ranging from 1 to 9 °C. The second survey was conducted to investigate the effect of lower outside temperatures on the perception of the use of air purifiers during classes. The surveys were addressed to both students and teachers and conducted anonymously. A total of 1070 students from grades 5 to 12 (high school), usually corresponding to an age from 10 to 19, participated in the summer survey and 1060 in the winter survey. The number of participating teachers differed greatly between the two surveys, with 22 teachers in summer and 74 in winter. A total of five questions were asked, which are listed in Table S3. If a question wasn’t answered clearly (answer marked between two answer options or more than one answer option was selected) it was excluded from the evaluation.
3. Results and discussion
In the following section, we present an overview over the development of the air purifier’s filtration efficiency for more than six months of operation starting from November 2020 as well as results for one exemplary day of measurements. Additionally, a model was implemented to calculate the potential viral load inside of the classroom and thereby estimate the possible infection risk. Furthermore, the results of the two school-wide surveys are discussed.
3.1. Long-term monitoring of the filter efficiency
summarizes all CADR measurements performed at the two schools and the seminar room, providing an overview over the temporal evolution of the respective CADRs. The upper two panels refer to measurements conducted at the elementary school KFS with two household devices (). displays the results obtained from measurements at the KFG and the bottom panel shows the CADRs derived from experiments in the seminar room (). Note that the operating hours in are estimated from the typical run time per day stated by the school principal. The operating hours in were obtained directly from the read-out menu of the Trotec TAC V+. However, since the operating hours of the Trotec TAC V + air purifiers of individual classrooms were influenced by differences in average usage and government-mandated (partial) school closings, the data in was not strictly presented in chronological order of the measurement date. Interestingly, we do not find clear trends toward decreasing CADRs for any tested air purifier, despite the long-time operation of the devices in an actual school environment. Considering the variability of each individual device on one school day, we estimate that the efficiency of the air purifiers decreases at most by 15% over the course of this long-term study. While a recent laboratory long-term simulation using high concentrations of cigarette smoke particles reported a significant reduction (Schumacher et al. Citation2018) the very small reduction here can probably be explained by the much smaller exposure of the filters to aerosol particles in the school room environment. Additionally, the gaseous and particular composition of tobacco smoke differs significantly from ambient air. This might also induce different aging effects on the filters surfaces and may accelerate the continuous discharging of electret filters.
Figure 2. Long-term measurements of the CADRs for all four examined air purifiers in different settings. (a) Philips AC 4236 and (b) Trotec AirgoClean 250 E measured at the KFS from January to June 2021, (c) Trotec TAC V + measured at the KFG School from November 2020 and February to June 2021. The different shapes indicate the different classrooms. (d) Philips 2887/10 and measurements indicated by gray symbols were conducted in a seminar room at Goethe University Frankfurt under near-laboratory conditions. Thick symbol borders indicate the use of multiple CPCs. In those cases, the CADRs of one measurement experiment were averaged. The uncertainty for the individual measurements was determined to be 100 m³/h for the CADRs measured during class and 25 m³/h for the laboratory measurements (see SI) and is marked with transparent ranges. The corresponding standard deviations are marked with red error bars. The dashed black line in each panel represents the CADR given by the manufacturer.
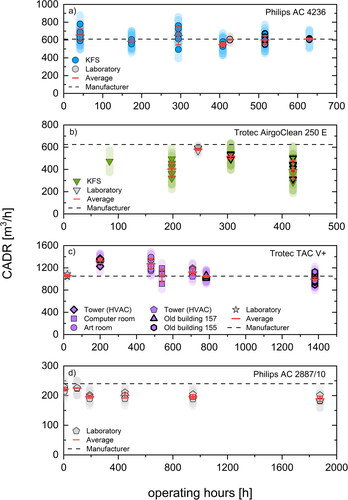
The measurements performed with the Philips AC 4236 () during classes as well as in the laboratory yield an average CADR of 608 ± 37 m³/h for the field measurements and 605 ± 5 m³/h for the laboratory experiment, which both are remarkably close to the manufacturer’s specification of 610 m³/h. Further, there is no noticeable trend toward either higher or lower CADRs. Additionally, the small variance of the data depicted in suggests that the Philips AC 4236 induces relatively uniform conditions in the classroom.
While also showing no significant decrease in filter efficiency, the household device Trotec AirgoClean 250 E provided only an average CADR of 448 ± 51 m³/h for the school-measurements, whereas the CADR determined from the laboratory measurements was significantly higher (582 ± 11 m³/h). Both values, however, are notably lower than the manufacturer’s specification of 624 m³/h ().
The measurements presented in differ from the previously discussed results as the individual characteristics of the many different classrooms influence the determined CADRs clearly. The CADRs for the measurements in November (operating hours: 100) and March (operating hours: 708) were additionally elevated due to an HVAC system which was running in the rooms where the measurements took place. The HVAC was controlled by the CO2 concentration in the classroom varying from standby mode with 100 m³/h to maximum at 400 m³/h. Unfortunately, detailed data of the flows induced by the HVAC could not be obtained, since it is an autonomous and automated system. Nevertheless, the effect of the HVAC was taken into account by performing separate natural decay measurements in the affected rooms. However, during these measurements no students were present, resulting in a much lower CO2 concentration. Therefore, the effect of the HVAC might be underestimated, yielding higher CADRs than the value stated by the manufacturer. The highest CADRs however were not observed in rooms connected to the HVAC system but in the art room. These extraordinarily high CADRs might be facilitated by the layout of the room. In contrast to the other classrooms, the art room was significantly longer and higher (Figure S1). Therefore, placement of the measurement instruments was difficult and led to a position in close proximity to the air purifier. It is conceivable that the higher CADRs in April (operating hours: 480) resulted from measuring a short circuit flow due to incomplete mixing in the room. Otherwise the values for rooms without an HVAC align very well to the manufacturer’s specification of 1050 m³/h, averaging a CADR of 1034 ± 28 m³/h in the classrooms (excluding the rooms with installed HVAC system and the art room) and 1059 ± 22 m³/h in the laboratory. Note that for the Trotec TAC V + a higher flow resistance due to accumulating particulate matter in the filter is counteracted by an automatic increase of the airflow by the device. Overall, no trend of a decreasing CADR could be observed for this device.
Generally, the data acquired in schools under real conditions with classes taking place are showing greater variability than the measurements conducted in the seminar room under controlled conditions, standardized procedures and without people being present in the room. This is confirmed by comparing either of the three laboratory measurements (gray data points) in to the respective school measurements or the CADRs in . features the least fluctuation among the long-term observations and is referring to the household Philips AC 2887/10 air purifier running almost continuously for ∼1900 h, filtering outdoor air. After 80 days of filtering a total of about 5 g of particulate matter accumulated in the filter. The long-term test application was only interrupted to perform the CADR measurements after 5, 10, 20, 40, and 80 days. Although the CADR seems to drop after the first 5 days of filtering, no significant declining trend can be found for the remaining time interval. All of the measured CADRs for the Philips AC 2887/10 yield an average of 205 m³/h and are below the manufacturer’s specification of 240 m³/h for fan speed 3. An additional measurement without the airtight packaging and sampling probe yielded that these lower values are caused by the slightly limited airflow through the 10 cm sampling probe.
Furthermore, we reevaluated the CADRs of the laboratory experiments for the size channels 0.008 − 0.3 µm and > 0.3 µm to investigate a possible size dependency of the CADR, as stated in Schumacher et al. (Citation2018). For the Philips AC 4236, Trotec Airgo Clean 250E and Trotec TAC V + the results indicate that there is only a very small difference of at most 2.5% between the CADRs for particles sized > 0.003 µm (3 nm) and 0.008 − 0.3 µm, which is well within the estimated uncertainty. However, for particles > 0.3 µm measured with the OPS the determined CADRs are up to 15% lower. Because of low counts and counting statistics, a separate CADR for larger particle sizes > 0.3 µm could not be determined correctly for most of the registered particle decays during the field measurements as described in Section 3.2. To allow for a better comparison between the field and laboratory experiments and to better represent the main mode of exhaled aerosol particles the CADR values calculated for particle sizes > 0.003 µm (3 nm) were used. Some manufacturers, however, may use larger size channels to determine the CADRs for their specification. This might also cause a difference between our determined CADRs and the manufacturer’s specification.
3.2. Case study: Illustrating the effect of air purification in a classroom
3.2.1. Number concentration
In order to demonstrate the air purifier’s performance during classes after approximately five months of operation, we provide an overview of an exemplary day of measurements in this section. For each measurement the particle concentration and size distribution along with temperature, CO2 concentration, and relative humidity were monitored continuously. displays the relevant variables to determine the filtration efficiency, the modeled concentration of the potential viral load in the classroom and the calculated dose of viruses taken up by a susceptible person when assuming the hypothetical presence of an infective spreader in the room. The data in was recorded at the Kaiserin-Friedrich-Gymnasium while the commercial air purifier Trotec TAC V + was in use and set to a volumetric flow of 1050 m³/h through the HEPA H14 filter The average CADR for the 7 decays during classes yielded a mean of 1043 ± 20 m³/h.
Figure 3. Effect of the air purifier (AP) during the case study from 20 May 2021. (a) The total particle number concentration observed by two CPCs placed in separate locations in the room. (b) The cumulative particle number concentration of size channels between 0.008 and 0.1 (light blue), and 0.1 and 0.3 µm (brown) measured by a SMPS, and the particle number concentration of size channels between 0.3 and 10 µm (mustard yellow) measured by an OPS. (c) The modeled virus concentration (solid line) and inhaled dose (dashed line). In panel c) blue colors indicate the modeling results for the observed case with air purifiers running (reference scenario) and red colors indicate the model results when assuming that air purifiers were not used (scenario AP_off).
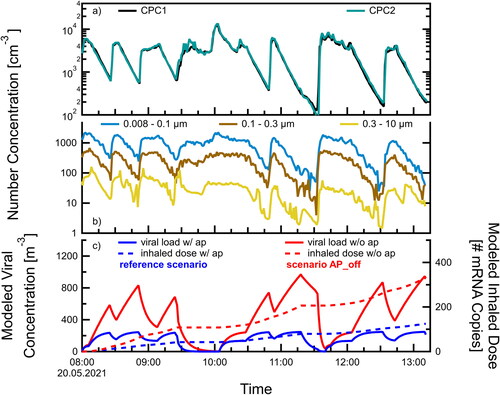
shows the number concentration of particles > 0.003 µm (3 nm) as a function of time. Two uCPCs were placed on opposite sides of the classroom (c.f. ). While students were present seven particle decays induced by the air purifier could be recorded throughout the day. First, it is noteworthy that the measurements by the two uCPCs show very good agreement, implying that the room was indeed well-mixed for the time of the experiments. During the decays the two CPC measurements agree within <1%, which is well within the instrumental measurement uncertainty. Throughout the whole day the particle decays induced by the air purifier show only very little variation and could be repeated reliably. All of the experiments in the classrooms were performed using basically the inherent outdoor aerosol particles which were introduced into the room by the frequent venting, reflecting in an increase in particle concentration as soon as the windows are opened in . The number concentration in the room was lowered by the action of the air purifiers by 85 − 98%, averaging 92 ± 4% within the time periods between venting (21 ± 3 min). Only when the particle sink during these periods is strong enough, a real benefit is provided by the air purifier, limiting the amount of potentially accumulated virus-laden aerosol particles in the room air. As our case study shows, this requirement was met reliably.
3.2.2. Size distribution
shows the cumulative number concentration for three selected ranges of aerosol diameters measured by a SMPS (0.008 − 0.1 µm: 68 channels, 0.1 − 0.3 µm: 33 channels) and an OPS (0.3 − 10 µm: 16 channels) during classes. In order to evaluate the efficiency of air purifiers to lower the infection risk reliably, it is of great importance to prove that all particle sizes are filtered homogeneously. Especially the reduction of particles with sizes >0.1 µm is crucial, since SARS-CoV-2 viruses are typically found in respiratory aerosol particles with diameters above 0.1 µm. For each filter decay, the concentrations of the three size ranges are reduced evenly, representing the whole measured particle spectrum from 0.008 to 10 µm. This also includes sizes <1 µm, which are considered the main mode of respiratory aerosol particles emitted while speaking or breathing (Asadi et al. Citation2019; Gutmann et al. Citation2022). Generally, all concentration curves display similar characteristics and trends throughout the day. The number concentrations of the three size ranges show distinct particle decays induced by the air purifier for the whole measurement period, which behave in a very similar pattern to the total number concentration of the CPCs. For the larger particles, measured by the OPS, some concentration peaks in individual size bins >0.5 µm (not explicitly shown) can be detected throughout the day that deviate to some degree from the general behavior shown in . For example, at 08:00 in the morning and 13:00 in the afternoon sharp increases in the concentration were seen in several size bins above 0.5 µm while the windows were opened, corresponding to the start and end of the school day and likely linked to increased traffic. However, the total number concentration of the OPS was not significantly affected by the individual peaks in size channels above 0.5 µm due to very low absolute concentrations (1–10 cm−3).
3.2.3. Modeled virus concentration and inhaled dose
depicts the average virus concentration (solid lines) in the classroom that is expected if an infected person would be emitting a constant flow of viruses (5000 min−1) during the lessons without wearing a mask and assuming that the air in the room is instantly homogeneously mixed. The air exchange by window ventilation was taken into account following the observed times and type of ventilation in the classroom (see Table S1 and ). Ventilation air exchange rates were estimated from a laboratory experiment (Figure S2), ranging from 0.7 to 6.7 h−1 up to 20.1 h−1 for the different venting categories (Table S1). The resulting inhaled dose of a susceptible person in this room is shown by the dashed lines. The blue lines represent the case with the air purifier constantly running (reference), while the red lines correspond to a scenario without air filtration by the air purifier (AP_off). Starting at 08:00 am the viral concentration steadily increases for the latter scenario until the windows are opened to ventilate the room. As soon as the windows are closed the concentration rises once again. This pattern repeats throughout the day. The highest modeled virus concentration almost reaches 1000 m−3 at 11:18 am. Only during long periods of venting while all persons leave the room for the breaks (09:27–10:04 am and 11:19–11:40 am, see also the virus concentration drops markedly, as the virus source is zero in those periods. In contrast, for the reference scenario in which the air purifier is running the viral load is consistently lower at all times. In fact, the virus concentration is up to a factor of 4 lower compared to the AP_off scenario for the times when students were present and windows were closed (minimum factor 1.4, average factor 2.7). For this case we observe that the virus concentration approaches the equilibrium concentration of about 250 m−3. Also, when no infectious person is present in the room (i.e., during the breaks) the concentration approaches zero a lot earlier than for the scenario AP_off. The inhaled dose, on the other hand, qualitatively shows a similar behavior for the two scenarios. It increases steadily over time and only remains constant, when no viruses are emitted during the breaks. However, the slopes of the curves are significantly different. Therefore, according to our model assumptions a susceptible person will have inhaled a total of 330 virus mRNA copies at the end of one school day despite regular window ventilation if no air purifier was running. The dose decreases by a factor of 2.65 when the additional measure of an air purifier is applied to a value of about 125 inhaled virus mRNA copies. This significant reduction could potentially make the difference between becoming infected and staying healthy, as these projected doses are in the range of 100 − 1000, which is assumed to be the critical threshold of inhaled RNA copies that may lead to an infection (Lelieveld et al. Citation2020). Different model scenarios can be found in Figure S3, testing the sensitivity of the modeled virus concentration and inhaled dose on, e.g., the presence of a superspreader, the use of masks or the effect of different venting efficiencies.
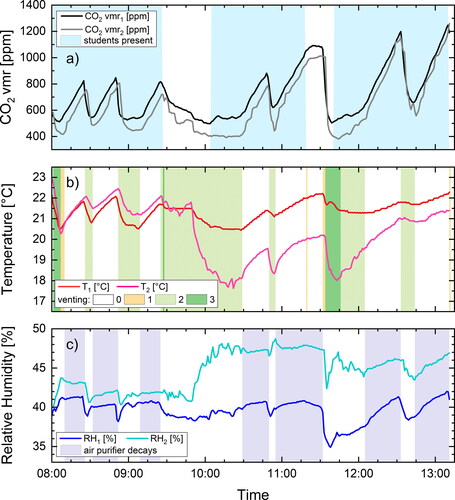
Figure 4. Carbon dioxide volume mixing ratio (a), temperature (b) and relative humidity (c) during the case study on 20 May 2021. The two data loggers (S1 and S2 in ) were positioned at the back of the room at location 1 (dark colors) and at the front window on the side of the room opposite to the door at location 2 (light colors). The shaded area indicates in panel (a) if persons were present in the room (9 students, 1 teacher and 1 scientist), in panel (b) the venting situation according to the categories of Table S1, and in panel (c) the time periods of air purifier decay experiments.
3.2.4. Indoor temperature, relative humidity, and air quality
As seen in the previous sections, venting has a significant impact on the potential viral load in a room as it dilutes and exchanges the air mass. However, the air quality and room microclimate is also affected by window ventilation (). There are several factors to consider regarding the effects and efficiency of window ventilation. Obviously, the length of a ventilation period, the frequency between individual ventilation events and the type of ventilation are the key determinants. In principle, there are mainly three ways to differentiate the venting process: (1) permanent but reduced ventilation by tilting of windows, (2) regular ventilation by fully opening windows for some time period, and (3) cross ventilation by fully opening windows and another opening like a door on the opposite side of the room to generate a cross-draft of air through the room. During the time of this study schools were recommended by the authorities to perform regular or cross ventilation for at least 5 min every 20 min. In fact, these recommendations were upheld pretty accurately during our presented day on 20 May 2021 at KFG (). In total, there were seven periods of window ventilation ranging from 6 to 64 min (over a break). While the lessons proceeded, the average time of venting was 13 ± 7 min and the average interval between venting events was 21 ± 3 min. Besides the effective ventilation area of the opened windows, the efficiency of venting predominantly depends on the temperature difference between the outside and inside air. A higher temperature gradient causes a stronger air draft and mixing effect inside the room. However, as a result the indoor temperature may decrease significantly during long ventilation periods. In our observed case we found the temperature at location 2 near the front window to decrease by more than 4 °C to below 18 °C during one prolonged period of venting (), which is 2 °C below the suggested minimum temperature of 20 °C for classrooms by the Federal Institute for Occupational Safety and Health (BAUA) (GMBl Citation2010). It took 90 min to warm up to a more comfortable 20 °C, but never reached the starting temperature again for the whole school day. Note that the measurements were performed in May with outside air temperatures between 10 and 15 °C and not during winter time. The sensor farther away from the windows at location 1 (see ) also recorded changes in temperature due to venting, but not as prominent (maximum decrease of 1.5 °C).
On the other hand, we observed that the CO2 volume mixing ratio in the room decreased whenever the windows were opened (). However, as long as the windows were closed and students were present, the CO2 mixing ratio increased. Although the windows were opened regularly and for fairly long times, the CO2 concentration rose above the recommended threshold of 1000 ppm several times toward the end of the day. It seems rather likely that such high concentrations may occur frequently in schools, when no specific ventilation recommendations are given due to a pandemic. As the peak values in CO2 coincided with the periods of potentially elevated virus concentration (), a CO2 monitor should be used as a rough indicator to signal the need to ventilate the room (UBA Citation2008).
Furthermore, we found no indication that the relative humidity is affected by the air purifier (), as was expressed as a concern several times in individual answers of our surveys. During the times when windows were closed and the air purifier was running, the relative humidity stayed fairly constant or even rose.
3.3. Survey: Use and acceptance of air purifiers
Each survey in summer and winter 2021 consisted of five questions concerning (1) noise levels of air purifiers, (2) sources of noise in the classroom, (3) communication between teachers and students, (4) ability of people to concentrate during classes, and (5) desired measures to reduce the risk of infection (see Table S3). shows the results for the questions (1), (3), and (5) as answered by the student body of KFG (for the complete results of the surveys, see Figures S4 and S5).
Figure 5. Survey results of three exemplary questions conducted in summer (orange) and winter (blue) in relation to the noise level of the air purifiers, the communication between teachers and students and the requested measures during classes at KFG. In total nsummer = 1070 and nwinter = 1060 students participated. Note that in the months before the summer survey the devices were run at CADR = 1050 m3/h yielding a noise level of ∼55 dB (A), while in the months before the winter survey the CADR was reduced to 600 m3/h, yielding a noise level of ∼45 dB (A).
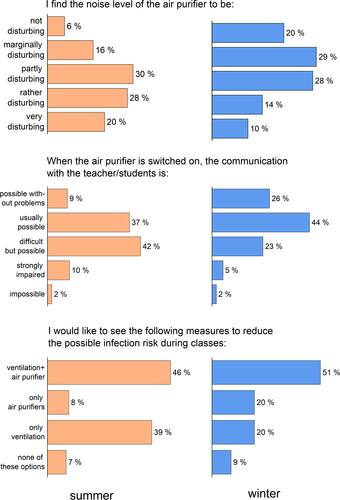
The acceptance of the use of air purifiers in a classroom depends largely on the individual perception of the generated noise, the perceived safety benefits, and the respective effects on concentration, communication, and comfort. Therefore, it is important to obtain the opinion of the persons affected by the possible noise level. For the first survey about 50% of the students as well as the teachers considered the noise levels of the air purifiers too high and felt “rather disturbed” or “very disturbed.” Note that the number of participating teachers in the summer survey was rather low (N = 22). Only 22% of the students () and 27% of the teachers (Figure S5) felt just slightly or not disturbed at all by the air purifiers. During this survey, the volumetric flow rate of the air purifiers was set to 1050 m³/h yielding a sound pressure level of around 55 dB(A) (). A permanent exposure to these elevated noise levels may be considered as unpleasant or disturbing in everyday school-life. The German Technical Rules for Work Environments (GMBl Citation2018) recommend that the additional noise level in school classrooms should be kept below 35 dB(A) and is not allowed to exceed 55 dB(A). As a result of these high noise levels, more than 50% of the participating students assessed the communication in class to be difficult or strongly impaired, whereas the percentage of teachers who found it difficult to communicate with the students was even higher. These opinions are also reflected in the fact that 46% of the students were against the use of air purifiers in school under these circumstances.
In contrast, the survey conducted in winter 2021 deviates notably from these findings. Note that, based on the first survey results, the volumetric flow rate of the air purifiers was lowered from 1050 to 600 m3/h, decreasing the noise levels from the air purifiers to a more tolerable ∼47 dB(A). The perception of the air purifiers’ noise level therefore differed sharply from summer to winter. Only half as many students found the air purifiers either “very disturbing” or “rather disturbing.” For the teachers, this reduction was even more pronounced. In the winter survey about half of the answers attest to either no or only marginal disturbance by the noise from the air purifier, which means a doubling of the fraction compared to the summer survey. Moreover, the communication between students and teachers in winter was perceived as much easier than in summer. Good communication (“possible without any problems” and “usually possible”) could be achieved in 70% of all cases, increasing by 24% (students) and by 43% (teachers) in comparison to the summer survey. Furthermore, the fraction of students supporting the use of air purifiers increased by 17%, leading to the impression that the acceptance of air purifiers was higher in winter than in summer. For the teachers, the differences in the acceptance of air purifiers were only marginal.
This shift away from a rather uncomfortable environment for students and teaching staff can most likely be attributed to two factors. The decrease of the flow rate from 1050 to 600 m³/h had probably the largest influence on the increased acceptance. Furthermore, the permanent use of air purifiers in winter prevented uncomfortably low indoor temperatures, which would otherwise have been induced by extensive venting and the lower outdoor temperatures related to the change of seasons. Although a reduction in noise level during classes is desirable, a decrease in flow rate through the HEPA filter is accompanied by an increase in infection risk, compared to higher flow rates. To counteract this negative consequence, it might be beneficiary to deploy two or more air purifiers with lower flow rates and correspondingly lower noise levels instead of using just one air purifier. This way, the flow rate through the filters is still large enough to provide a sufficient particle sink and lower the infection risk accordingly.
4. Summary and conclusions
After six months of continuous use, all deployed air purifiers were still capable of reducing the aerosol particle load inside the different classrooms reliably by 85 − 95% within less than 20 min. No obvious decline in filter efficiency could be observed for the household devices or the industrial air purifier. Although there might be other air purifiers, especially household devices, available on the market which may display a more pronounced charge decay on the electret filter and thereby might be subject to a significant decrease in filtration efficiency within the same time frame in contrast to the examined devices. The control test with a household air purifier filtering outdoor air yielded a maximum decrease in filter efficiency of 15% after approximately 1900 h (80 days) of operation. This is equivalent to running the air purifier for one year in an office or school with an estimated operation time of eight hours per day.
Additionally, our calculations suggest that, even with extensive venting during classes, over the course of one day, enough viral matter can be emitted by an infected person to possibly cause an infection via respiratory uptake of virus-laden aerosol particles. The risk of infection can be lowered significantly by deploying air purifiers as an additional measure to lower the viral concentration in the room.
Analysis of the particle spectra from 0.01 to 10 µm confirmed that during six months of operation the particle load was reduced efficiently, independent of the particle size, including the potentially virus-laden aerosol particles ranging from ∼0.1 to 10 µm. In order to guarantee reliable and continuous operation, the air purifiers have to be inspected and pre-filters have to be cleaned regularly. This can be done by either vacuuming or washing the integrated pre-filter mesh for the household devices or by performing a cleaning cycle for the industrial device, which heats the filter up to approximately 100 °C, removing volatile aerosol particles as well as deactivating bacterial and viral matter.
The use of mobile air purifiers provided good performance regardless of whether household appliances or industrial devices were used. The cost of the household devices was approximately a factor four lower than for the industrial devices at a comparable CADR. Also the household devices were able to lower the aerosol particle concentration in a classroom reliably and can be run for at least half a year without losing efficiency and without large investments in maintenance or replacement filters. Thus, mobile air purifiers can be considered a moderately priced and easy-to-use alternative to fixed ventilation systems to reduce the aerosol particle load and therefore airborne infection risks. Nevertheless, it should be kept in mind that fixed ventilation systems or window venting also reduce the CO2 and water vapor levels in the classrooms through the exchange with outside air. Another benefit of an air filtering system is a significant decrease of the particulate matter- and allergen-load, improving the indoor air quality and lowering adverse health effects.
Observation of the room microclimate revealed that, especially during winter times when outdoor temperatures were low (<10 °C), students sitting near the window were exposed to uncomfortably low temperatures in class. After temperatures dropped significantly next to opened windows, they never reached the same level as temperatures measured in the center of the classroom, resulting in a permanent “cold area.” Despite the extraordinarily frequent venting during our experiments, the CO2 concentrations reached values above 1000 ppm several times throughout the day, which can cause loss in concentration, headaches and generally reduces the learning ability (Allen et al. Citation2016; Wargocki et al. Citation2020). The CO2 concentration on the other hand may also be used as a basic indicator of the air quality and can be monitored by installing a simple CO2 monitor. Both the modeled virus concentration as well as the CO2 concentration follow similar patterns as they rise quickly when windows are shut and drop fast when outdoor air is let in. Although caution is advised when only few students are present, since the CO2 concentration will climb less rapidly compared to a fully occupied class. The viral concentration, on the other hand, will increase similarly fast in a fully seated and half empty classroom, if one infected person is present. So in a case with only few students present, venting strictly according to the CO2 concentration may induce a false sense of security. An often described impression of the air being “dried” by the devices could not be observed. The relative humidity in classrooms changed only due to venting, the breathing of attending persons or other external influences. No critically low values of <30% RH were reached during our experiments.
Two school-wide surveys at KFG in summer and winter implied that students and teachers generally approve the use of air purifiers, but felt disturbed by the noise levels when the devices were operated at high flow rates. When noise emission of the air purifiers was lowered by selecting a smaller flow rate and adjusting the devices level to different classroom situations (e.g., regular classes vs. exams), the acceptance of air purifiers increased, while the complaints about noise levels were much less frequent. In order to decrease noise levels even more, it may be advisable for schools to use multiple air purifiers with lower flow rates in one classroom instead of one large device. Especially for school settings as observed at the KFS, where one device had to be used at its maximum flow setting. The relatively high noise pollution of around 55 dB(A) can be lowered significantly by combining, e.g., three low-noise air purifiers with a CADR of <300 m³/h each to allow for a better teaching environment, decreasing the noise levels to <45 dB(A) and thereby also increasing willingness of teachers to use air purifiers during class. Meanwhile, there are various devices commercially available with which a total CADR of >800 m3/h can be reached while maintaining noise levels <35 dB(A), typically by combining two or three devices per classroom. This fulfills even the strict recommendations of the German Technical Rules for Work Environments (GMBl Citation2018).
Apart from this approach, we also propose a situational use, adapted to external conditions like the outside temperature or the severity of the infection risk as well as the type of classes. For example, the use of air purifiers could be reduced in summer when very frequent or permanent venting is possible. In winter, the air purifiers should be in operation permanently to counteract a potential shortening of the ventilation periods due to the lower outside temperatures. For this purpose, it is important that the flow setting of the air purifiers can be accessed directly on the device. Especially, for devices where individual flow-modes can only be regulated via an app, as the Philips AC 4236, a proper handling in schools can be difficult or even impossible due to, e.g., teachers having to log in and off when switching classes or the complete absence of a WLAN network. In our study, this resulted in the device having to be operated in “turbo” mode continuously since no fan modes other than “turbo,” “standby,” and “auto” () were accessible, resulting in a higher noise level.
We conclude that mobile air purifiers are overall a well-suited measure to efficiently reduce the amount of aerosol particles in school classrooms and thereby the amount of potentially virus-laden particles and the infection risk. Additionally, air purifiers may be deployed in other places where groups of people gather within confined spaces (e.g., offices, restaurants, bars, etc.). Generally, a broader distribution of air purification systems can be considered largely beneficial, even in non-pandemic times. Coincidently, raising awareness of air quality and health related issues may introduce a paradigm shift toward more consideration regarding the quality of the air we breathe indoors.
Supplemental Material
Download MS Word (5.7 MB)Acknowledgements
We thank Goethe University Frankfurt for financial support of the project via the Goethe Corona Fond. We thank the Kettler-Franke-Schule and the Kaiserin-Friedrich Gymnasium, their principals Christina Klotz and Jochen Henkel, teachers and staff as well all the students who participated in the survey for their support and cooperation. We thank Carl Wetter and Sascha Bastian from the Hochtaunuskreis district administration for their support and for providing the CO2 loggers. Furthermore, we want to thank Christof Asbach and Stefan Schumacher for valuable discussions and input.
Additional information
Funding
References
- Allen, J. G., P. MacNaughton, U. Satish, S. Santanam, J. Vallarino, and J. D. Spengler. 2016. Associations of cognitive function scores with carbon dioxide, ventilation, and volatile organic compound exposures in office workers: a controlled exposure study of green and conventional office environments. Environ. Health Perspect. 124 (6):805–12. doi:10.1289/ehp.1510037.
- Asadi, S., A. S. Wexler, C. D. Cappa, S. Barreda, N. M. Bouvier, and W. D. Ristenpart. 2019. Aerosol emission and superemission during human speech increase with voice loudness. Sci. Rep. 9 (1):2348. doi:10.1038/s41598-019-38808-z.
- Azimi, P., Z. Keshavarz, J. G. C. Laurent, B. Stephens, and J. G. Allen. 2021. Mechanistic transmission modeling of COVID-19 on the diamond princess cruise ship demonstrates the importance of aerosol transmission. Proc. Natl. Acad. Sci. USA 118 (8):e2015482118. doi:10.1073/pnas.2015482118.
- Bagheri, G., B. Thiede, B. Hejazi, O. Schlenczek, and E. Bodenschatz. 2021. An upper bound on one-to-one exposure to infectious human respiratory particles. Proc Natl Acad Sci USA 118 (49):e2110117118. doi:10.1073/pnas.2110117118.
- Bazant, M. Z., and J. W. M. Bush. 2021. A guideline to limit indoor airborne transmission of COVID-19. Proc. Natl. Acad. Sci. USA 118 (17):e2018995118. doi:10.1073/pnas.2018995118.
- Bischoff, W. E., K. Swett, I. Leng, and T. R. Peters. 2013. Exposure to influenza virus aerosols during routine patient care. J. Infect. Dis. 207 (7):1037–46. doi:10.1093/infdis/jis773.
- Bundesgesundheitsblatt. 2008. Gesundheitliche Bewertung von Kohlendioxid in der Innenraumluft. Mitteilungen der Ad-hoc-Arbeitsgruppe Innenraumrichtwerte der Innenraumlufthygiene-Kommission des Umweltbundesamtes und der Obersten Landesgesundheitsbehörden. [Health evaluation of carbon dioxide in indoor air]. Bundesgesundheitsblatt Gesundheitsforschung Gesundheitsschutz 51 (11):1358–69. doi:10.1007/s00103-008-0707-2.
- Curtius, J., M. Granzin, and J. Schrod. 2021. Testing mobile air purifiers in a school classroom: reducing the airborne transmission risk for SARS-CoV-2. Aerosol Sci. Technol. 55 (5):586–99. doi:10.1080/02786826.2021.1877257.
- Dabisch, P., M. Schuit, A. Herzog, K. Beck, S. Wood, M. Krause, D. Miller, W. Weaver, D. Freeburger, I. Hooper, et al. 2021. The influence of temperature, humidity, and simulated sunlight on the infectivity of SARS-CoV-2 in aerosols. Aerosol Sci. Technol. 55 (2):142–53. doi:10.1080/02786826.2020.1829536.
- Ding, S., Z. W. Teo, M. P. Wan, and B. F. Ng. 2021. Aerosols from speaking can linger in the air for up to nine hours. Build. Environ. 205:108239. doi:10.1016/j.buildenv.2021.108239.
- Drewnick, F., J. Pikmann, F. Fachinger, L. Moormann, F. Sprang, and S. Borrmann. 2021. Aerosol filtration efficiency of household materials for homemade face masks: Influence of material properties, particle size, particle electrical charge, face velocity, and leaks. Aerosol Sci. Technol. 55 (1):63–79. doi:10.1080/02786826.2020.1817846.
- Edwards, D. A., D. Ausiello, J. Salzman, T. Devlin, R. Langer, B. J. Beddingfield, A. C. Fears, L. A. Doyle-Meyers, R. K. Redmann, S. Z. Killeen et al. 2021. Exhaled aerosol increases with COVID-19 infection, age, and obesity. Proc. Natl. Acad. Sci. USA 118 (8):e2021830118. doi:10.1073/pnas.2021830118.
- Edwards, D. A., J. C. Man, P. Brand, J. P. Katstra, K. Sommerer, H. A. Stone, E. Nardell, and G. Scheuch. 2004. Inhaling to Mitigate Exhaled Bioaerosols. ” Proc. Natl. Acad. Sci. USA 101 (50):17383–8. doi:10.1073/pnas.0408159101.
- GMBl 2010. Bek. v. 10.6.10, Bekanntmachung von Technischen Regeln. ASR A3.5. Raumtemperatur (35).
- GMBl. 2018. Bek. v. 2.5.18, Bekanntmachung von Technischen Regeln. ASR A3.7. Lärm 24.
- Gutmann, D., G. Scheuch, T. Lehmkühler, L.-S. Herrlich, A. Landeis, M. Hutter, C. Stephan, M. Vehreschild, Y. Khodamoradi, A.-K. Gossmann, et al. 2022. Aerosol measurement identifies SARS-CoV 2 PCR positive adults compared with healthy controls. Environ. Res. 216 (Pt 1):114417. doi:10.1016/j.envres.2022.114417.
- Han, Z. Y., W. G. Weng, and Q. Y. Huang. 2013. Characterizations of particle size distribution of the droplets exhaled by sneeze. J. R Soc. Interface 10 (88):20130560. doi:10.1098/rsif.2013.0560.
- Harvey, W. T., A. M. Carabelli, B. Jackson, R. K. Gupta, E. C. Thomson, E. M. Harrison, C. Ludden, R. Reeve, A. Rambaut, S. J. Peacock, et al. 2021. SARS-CoV-2 variants, spike mutations and immune escape. Nat. Rev. Microbiol. 19 (7):409–24. ” doi:10.1038/s41579-021-00573-0.
- Kohanski, M. A., L. J. Lo, and M. S. Waring. 2020. Review of Indoor Aerosol Generation, Transport, and Control in the Context of COVID-19. Int. Forum Allergy Rhinol. 10 (10):1173–9. doi:10.1002/alr.22661.
- Lelieveld, J., H. Frank, B. Stephan, C. Yafang, D. Frank, H. Gerald, K. Thomas, S. Jean, S. Hang, and P. Ulrich. 2020. Model calculations of aerosol transmission and infection risk of COVID-19 in indoor environments. IJERPH. 17 (21):8114. doi:10.3390/ijerph17218114.
- Leung, N. H. L. 2021. Transmissibility and transmission of respiratory viruses. Nat. Rev. Microbiol. 19 (8):528–45. doi:10.1038/s41579-021-00535-6.
- Ma, J., X. Qi, H. Chen, X. Li, Z. Zhang, H. Wang, L. Sun, L. Zhang, J. Guo, L. Morawska, et al. 2021. Coronavirus disease 2019 patients in earlier stages exhaled millions of severe acute respiratory syndrome coronavirus 2 per hour. Clin. Infect. Dis. 72 (10):e652–e654. doi:10.1093/cid/ciaa1283.
- Malik, M., A.-C. Kunze, T. Bahmer, S. Herget-Rosenthal, and T. Kunze. 2021. SARS-CoV-2: Viral loads of exhaled breath and oronasopharyngeal specimens in hospitalized patients with COVID-19. Int. J. Infect. Dis. 110:105–10. doi:10.1016/j.ijid.2021.07.012.
- Mansfield, K. E., R. Mathur, J. Tazare, A. D. Henderson, A. R. Mulick, H. Carreira, A. A. Matthews, P. Bidulka, A. Gayle, H. Forbes, et al. 2021. Indirect acute effects of the COVID-19 pandemic on physical and mental health in the UK: a population-based study. The Lancet Digital Health 3 (4):e217–e230. doi:10.1016/S2589-7500(21)00017-0.
- Morawska, L., J. Allen, W. Bahnfleth, P. M. Bluyssen, A. Boerstra, G. Buonanno, J. Cao, S. J. Dancer, A. Floto, F. Franchimon, et al. 2021. A paradigm shift to combat indoor respiratory infection. Science 372 (6543):689–91. doi:10.1126/science.abg2025.
- Morawska, L., G. R. Johnson, Z. D. Ristovski, M. Hargreaves, K. Mengersen, S. Corbett, C. Y. H. Chao, Y. Li, and D. Katoshevski. 2009. Size distribution and sites of origin of droplets expelled from the human respiratory tract during expiratory activities. J. Aerosol. Sci. 40 (3):256–69. doi:10.1016/j.jaerosci.2008.11.002.
- Nordsiek, F., E. Bodenschatz, and G. Bagheri. 2021. Risk assessment for airborne disease transmission by poly-pathogen aerosols. PLoS One 16 (4):e0248004. doi:10.1371/journal.pone.0248004.
- Offermann, F. J., R. G. Sextro, W. J. Fisk, D. T. Grimsrud, W. W. Nazaroff, A. V. Nero, K. L. Revzan, and J. Yater. 1985. Control of respirable particles in indoor air with portable air cleaners. Atmos. Environ. (1967) 19 (11):1761–71. doi:10.1016/0004-6981(85)90003-4.
- Pogačnik Krajnc, A., L. Pirker, U. Gradišar Centa, A. Gradišek, I. B. Mekjavic, M. Godnič, M. Čebašek, T. Bregant, and M. Remškar. 2021. Size- and time-dependent particle removal efficiency of face masks and improvised respiratory protection equipment used during the COVID-19 pandemic. Sensors 21 (5):1567. doi:10.3390/s21051567.
- Prather, K. A., L. C. Marr, R. T. Schooley, M. A. McDiarmid, M. E. Wilson, and D. K. Milton. 2020. Airborne transmission of SARS-CoV-2. ” Science 370 (6514):303–4. doi:10.1126/science.abf0521.
- Pulliam, J. R. C., C. van Schalkwyk, N. Govender, A. von Gottberg, C. Cohen, M. J. Groome, J. Dushoff, K. Mlisana, and H. Moultrie. 2022. Increased risk of SARS-CoV-2 reinfection associated with emergence of omicron in South Africa. Science 376 (6593):eabn4947. doi:10.1126/science.abn4947.
- Qian, H., T. Miao, L. Liu, X. Zheng, D. Luo, and Y. Li. 2021. Indoor transmission of SARS-CoV-2. Indoor Air 31 (3):639–45. doi:10.1111/ina.12766.
- Renzi, E, and A. Clarke. 2020. Life of a droplet: Buoyant vortex dynamics drives the fate of micro-particle expiratory ejecta. Phys. Fluids (1994) 32 (12):123301. doi:10.1063/5.0032591.
- Schmitt, J, and J. Wang. 2021. Quantitative modeling of the impact of facemasks and associated leakage on the airborne transmission of SARS-CoV-2. Sci. Rep. 11 (1):19403. doi:10.1038/s41598-021-98895-9.
- Schumacher, S., C. Asbach, and H.-J. Schmid. 2021. Effektivität von Luftreinigern zur Reduzierung des COVID-19-Infektionsrisikos/Efficacy of air purifiers in reducing the risk of COVID-19 infections. GrdL 81 (01–02):16–28. doi:10.37544/0949-8036-2021-01-02-18.
- Schumacher, S., D. Spiegelhoff, U. Schneiderwind, H. Finger, and C. Asbach. 2018. Performance of new and artificially aged electret filters in indoor air cleaners. ” Chem. Eng. Technol. 41 (1):27–34. doi:10.1002/ceat.201700105.
- Shaughnessy, R. J, and R. G. Sextro. 2006. What is an effective portable air cleaning device? A review. J. Occup. Environ. Hyg. 3 (4):169–81; quiz D45. doi:10.1080/15459620600580129.
- Smither, S. J., L. S. Eastaugh, J. S. Findlay, and M. S. Lever. 2020. Experimental aerosol survival of SARS-CoV-2 in artificial saliva and tissue culture media at medium and high humidity. Emerg. Microbes Infect. 9 (1):1415–7. doi:10.1080/22221751.2020.1777906.
- Sosnowski, T. R. 2021. Inhaled aerosols: Their role in COVID-19 transmission, including biophysical interactions in the lungs. Curr. Opin. Colloid Interface Sci. 54:101451. doi:10.1016/j.cocis.2021.101451.
- Tang, J. W., W. P. Bahnfleth, P. M. Bluyssen, G. Buonanno, J. L. Jimenez, J. Kurnitski, Y. Li, S. Miller, C. Sekhar, L. Morawska, et al. 2021a. Dismantling myths on the airborne transmission of severe acute respiratory syndrome coronavirus-2 (SARS-CoV-2). J. Hosp. Infect. 110:89–96. doi:10.1016/j.jhin.2020.12.022.
- Tang, S., Y. Mao, R. M. Jones, Q. Tan, J. S. Ji, N. Li, J. Shen, Y. Lv, L. Pan, P. Ding, et al. 2020. Aerosol transmission of SARS-CoV-2? Evidence, prevention and control. Environ. Int. 144:106039. doi:10.1016/j.envint.2020.106039.
- Tang, J. W., L. C. Marr, Y. Li, and S. J. Dancer. 2021b. Covid-19 has redefined airborne transmission. BMJ 373:n913. doi:10.1136/bmj.n913.
- Tian, D., Y. Sun, H. Xu, and Q. Ye. 2022. the emergence and epidemic characteristics of the highly mutated SARS-CoV-2 omicron variant. J. Med. Virol. 94 (6):2376–83. doi:10.1002/jmv.27643.
- Twohig, K. A., T. Nyberg, A. Zaidi, S. Thelwall, M. A. Sinnathamby, S. Aliabadi, S. R. Seaman, R. J. Harris, R. Hope, J. Lopez-Bernal, et al. 2022. Hospital admission and emergency care attendance risk for SARS-CoV-2 delta (B.1.617.2) compared with alpha (B.1.1.7) variants of concern: a cohort study. Lancet Infect. Dis. 22 (1):35–42. doi:10.1016/S1473-3099(21)00475-8.
- UBA. 2008. “Leitfaden für die Innenraumhygiene in Schulgebäuden”.
- van Doremalen, N., T. Bushmaker, D. H. Morris, M. G. Holbrook, A. Gamble, B. N. Williamson, A. Tamin, J. L. Harcourt, N. J. Thornburg, S. I. Gerber, et al. 2020. Aerosol and surface stability of SARS-CoV-2 as compared with SARS-CoV-1. N Engl. J. Med. 382 (16):1564–7. doi:10.1056/NEJMc2004973.
- Viner, R., S. Russell, R. Saulle, H. Croker, C. Stansfield, J. Packer, D. Nicholls, A.-L. Goddings, C. Bonell, L. Hudson, et al. 2022. School closures during social lockdown and mental health, health behaviors, and well-being among children and adolescents during the first COVID-19 wave: A systematic review. JAMA Pediatr. 176 (4):400–9. doi:10.1001/jamapediatrics.2021.5840.
- von Pettenkofer, M. 1858. Besprechung Allgemeiner auf die Ventilation bezüglicher Fragen. Über den Luftwechsel in Wohngebäuden. München: J.G. Cotta’schen Buschhandlung.
- Vuorinen, V., M. Aarnio, M. Alava, V. Alopaeus, N. Atanasova, M. Auvinen, N. Balasubramanian, H. Bordbar, P. Erästö, R. Grande, et al. 2020. Modelling aerosol transport and virus exposure with numerical simulations in relation to SARS-CoV-2 transmission by inhalation indoors. Saf. Sci. 130:104866. doi:10.1016/j.ssci.2020.104866.
- Wargocki, P., J. A. Porras-Salazar, S. Contreras-Espinoza, and W. Bahnfleth. 2020. The relationships between classroom air quality and children’s performance in school. Build. Environ. 173:106749. doi:10.1016/j.buildenv.2020.106749.