
Abstract
We recently developed an in vitro system for quantification of deposited mass of labeled aerosol constituents in the human airway under realistic inhalation conditions including temperature and humidity control. The in vitro system consists of the upper respiratory airway cast with separate flow controls within distinct branches of the cast. The complete workflow including generation of the labeled aerosol particles, flow setup, and scanning deposited labeled constituent using positron emission tomography is presented. The system was used for evaluating deposition of 11C-radiolabeled nicotine from pH-modified liquid formulations generated by a typical tank electronic nicotine delivery system. The airway deposition patterns were modulated by adjusted liquid pH-value, suggesting modified gas-liquid aerosol partitioning. This can be visually assessed in a qualitative manner, but more importantly measured in a quantitative manner by evaluating the total administered dose. The effects of temperature and humidity were separately assessed, showing significant influence of realistic inhalation conditions (temperature of 37 °C and nearly 100% relative humidity) on total nicotine deposition in the airway cast. Developed capabilities allow their future applications in generating validation data for modeling purposes as well as for conducting further studies concerning understanding of challenges in aerosol delivery and dosimetry assessments.
EDITOR:
1. Introduction
Efficient aerosol inhalation requires its pulmonary delivery and subsequent deposition/absorption in the lungs. Lung morphometry with its functional capacity (respiratory physiology) and inhaled aerosol characteristics (particle size distribution) comprise the main pillars allowing the inhalation process to deliver substances to the lungs and further into systemic circulation (Kolli et al. Citation2019). Due to the overall complexity of the in vivo aerosol delivery and its intrinsic character, existing studies concerning aerosol deposition in the lungs are sparse, and their outcomes are rather challenging for generalization as they are subject to particular aerosol characteristics (Sanchez-Crespo Citation2019). For better understanding of the processes governing aerosol lung delivery, simplified in vitro models have been created (Cei et al. Citation2021; Ahookhosh et al. Citation2020; Gallagher et al. Citation2020), and simultaneously there are growing computational modeling capabilities that advance development of detailed or reduced-order models predicting aerosol flows and deposition (Schroeter et al. Citation2013). In the next paragraphs, we briefly summarize main challenges and needs (Phalen et al. Citation2021) in the aerosol dosimetry field, giving the introduction and background for the conducted work.
Aerosol lung delivery is very complex as it consists of multiple interconnected processes (Tsuda, Henry, and Butler Citation2013). Initially, the generated aerosol enters the upper respiratory tract where it is often subject to immediate alterations of humidity and temperature. Along the conducting airways (Bordas et al. Citation2015) the airflow becomes modified as it passes through growing geometrical complexities that generate a variety of local flow structures with regions of possible transitions from laminar to turbulent flow. Such flow alterations in the conducting airways contribute to overall aerosol delivery to the deep lungs and—depending on the aerosol characteristics—sequentially contribute to its deposition (filtration), which can limit availability of the delivered substance in the lower respiratory tract. Due to accompanied changes of flow conditions (e.g., flowrate, pressure) when an aerosol is inhaled, the aerosol particles evolve during airway transit (Haddrell et al. Citation2017).
Aerosol particle evolution is often related to potential condensational growth present for solid (powder) and liquid particles, while the gas-liquid partitioning for liquid aerosols adds to the complexity of their delivery. Gas-liquid partitioning of present aerosol substances directly modulates the aerosol delivery and manipulates their absorption potential; this is mainly driven by the physical processes of impaction, sedimentation, or diffusion, depending on the particle size or gas phase deposition/absorption (diffusion) when considering the substances in this phase (Ahn, Rao, and Vejerano Citation2021; Pankow Citation2001). Gas-liquid aerosol partitioning is directly linked with (saturation) pressure surrounding the particles and may depend on the physical dynamics and chemical composition of the delivered aerosol (Sosnowski and Odziomek Citation2018; Li et al. Citation2020; Pichelstorfer et al. Citation2021). Non-ideality of liquid mixture behavior with respect to ideal vapor pressure curves predicted by Raoult’s (or Henry’s) law strictly depends on the chemical composition, while the chemical effects (e.g., pH modulation, El-Hellani et al. Citation2015) or physical particle size (e.g., Kelvin effect for very small droplets (Lewis Citation2006)) ultimately define the dynamics of aerosol droplets and their potential for effective delivery (David et al. Citation2020; Tackman, Grady, and Freedman Citation2022). Additional effects related to coupling of gas and liquid phases in the case of significant liquid mass fraction may further complicate already intricate physico-chemical processes (Pichelstorfer et al. Citation2016; Soni and Nayak Citation2019). In addition to the described characteristics of liquid aerosol delivery, the physico-chemical properties of a liquid mixture versus its components (active substance and carrier liquid) also deserve attention. Often, the mixture properties drive the dynamics of aerosol generation and transport as predominantly created from the carrier components, while the low mass fraction of the active substance does not significantly influence the bulk mixture properties (e.g., density, boiling temperature). In contrast, selected properties (e.g., surface tension (Laaksonen and Kulmala Citation1991)) are driven even by low mass fraction amounts of substances (Romakkaniemi et al. Citation2011).
All these elements contribute to various extents and predicting their overall contributions in the process of aerosol lung delivery is difficult, even for well-defined mixture compositions. Performing invasive clinical studies is usually impossible and/or requires substantial financial investments. Potential contributions from in vivo animal exposure studies cannot be directly translated to human aerosol lung delivery due to distinct flow rates, aerosol respirability, and overall airway structuring. They can serve as supplementary validation data for in silico computational fluid dynamics (CFD) simulations that can now deliver detailed understanding and predictions of aerosol delivery (Feng, Kleinstreuer, and Rostami Citation2015; Asgari, Lucci, and Kuczaj Citation2021). To be computationally feasible, they require sub-models built from non first-principles driven mechanisms (e.g., single particles evaporation by D2-law). Even the most sophisticated computational models require substantial verification/validation data to be used with confidence and within their range of verified applications. This situation opens an avenue for the development and application of in vitro models in which aerosol delivery can be performed in controlled conditions (Asgari et al. Citation2019).
In vitro airway cast models have mostly been used for measuring the deposition potential of solid particles (Ahookhosh et al. Citation2020; Patel et al. Citation2012). Offline measurements of liquid aerosol deposition are possible but become problematic in the case of volatile substances (Nordlund et al. Citation2017). Combining labeled-substance aerosol deposition in the in vitro models with almost instant scanning partially overcomes some of these complexities and allows for studies that may increase the understanding of complex aerosol dynamics, as well as provide data for simulation validation purposes. In recent years, various casts models with a variety of geometries and complexities were developed (Ahookhosh et al. Citation2020) using 3D printing techniques (Lim et al. Citation2018) and the ability to control thermodynamic conditions like temperature and humidity. Some of these casts were extensively benchmarked and tested under various flow conditions including experimental and computational work (Lizal et al. Citation2018).
In this work, we developed an in vitro cast of the human airway with controlled airflow conditions in separate branches that can be thermally controlled and under prescribed humidity conditions. These developments enable the study of aerosol deposition labeled by the marker of interest, including effects linked to condensational particle growth. Measurement of the upper airways’ aerosol deposition provides indirect information on possible aerosol delivery to the deep lungs. The acquired data for various aerosol liquid mixtures (with increased mixture complexity) confirm the influence of pH on aerosol delivery and may be used to validate computational models. We conducted nicotine labeling following previous work (Solingapuram Sai et al. Citation2020) and used a typical tank electronic nicotine delivery system (ENDS) (Asgharian et al. Citation2018; Baassiri et al. Citation2017; Feng, Kleinstreuer, and Rostami Citation2015) as the aerosol generator. Section 2 presents and technically describes the cast model, as well as the workflow for measuring and analyzing labeled nicotine. In Section 3, the results related to nicotine deposition at varying pH and thermodynamical conditions are shown, allowing for further exploration with various mixtures and conditions of interest. This is followed by concluding remarks in Section 4.
2. Method development
2.1. The in vitro model of nicotine deposition in the human respiratory tract
We developed an in vitro method to assess nicotine deposition at 37 °C and 100% relative humidity (RH), which combines positron emission tomography (PET) imaging with 11C-nicotine and an in vitro model of the human respiratory tract (Sul et al. Citation2018; Zuo et al. Citation2017).
In the available literature various airway cast geometries are used. Apart from the geometrical aspects, various approaches for construction of the casts are proposed enhanced by recent developments in the 3D printing technologies (see Ahookhosh et al. Citation2020). Often segmentation of the cast branches is used for the ability of analytical extraction of deposited compounds from selected regions of the airways (Lizal et al. Citation2018; Nordlund, et al. Citation2017). Additional features like humidification and temperature control are added (Asgari et al. Citation2019) as important parameters modifying transported aerosols. In our work we have used the patient-derived cast introduced to the scientific community in (Sul et al. Citation2018). The 3D geometry was planarly projected for simplicity of manufacturing and possibility of future simultaneous assessments of the particle image velocimetry and deposition (Sul et al. Citation2018) following also the rationale that the rotation out of the plane is not generally appreciable for the first three airway generations (see Sauret et al. Citation2002) considering significant impact on aerosol deposition. Geometric airways structures ultimately link the aerosol inhalation and deposition in a quantitative (aerosol dosimetry) manner. Bridging predictive aerosol dosimetry by subject-specific airways geometry and inhalation potential is crucial. Our intention in the performed research was to concentrate on comparative differences of aerosol transported and deposited in a fixed model of the airways. From this perspective, we selected the airway model that resembles the volume and generally flow and time-scales present in reality (Sul et al. Citation2018). The airway cast was produced using a 3D printer and consisted of the polymer Somos©WaterShed XC 11122 (manufactured by Royal DSM). Planar approach allowed us to generate it as single element from the mouth to the last considered generation avoiding any issues with fitting multi-segmented parts and validation concerning potential leakage.
The in vitro model of the human respiratory tract consists of a thermostat chamber with a respiratory tract cast, a puff/inhalation controller, a vacuum pump, and an air pressure pump for operation of a puff pinch valve (see ). Developed system allows to prefill the cast (see ) with the humidified air, then by switching the controller/valve, take the aerosol puff of the considered product into the mouth cavity of the cast and by further flow manipulations bring eventually the transient inhalation flow into the cast at controlled temperature conditions. In the system the humidification is achieved by bringing the humidified air to the cast upfront and by humidification of the inhalation flow. A single 2-s, 35-mL puff of electronic cigarette (e-cigarette) aerosol or smoke containing 11C-nicotine was delivered to the respiratory tract cast by applying a negative pressure. Puff duration was controlled by an air pressure-operated pinch valve, and unretained smoke or vapor was collected on GFB glass fiber filters (see and ). Each of five filter holders (one for each lobar bronchus) contained two GFB filters. One to 3 min before a puff delivery, the respiratory tract cast was filled with 300 mL of humidified air (37 °C and 100% RH) generated in the humidification chamber. Immediately after the puff, a 2-s, 700-mL air wash-in volume was administered to the respiratory tract cast using negative pressure. The segmental bronchi of the respiratory tract cast outlets corresponding to each of the five lobar bronchi were connected with five variable area flowmeters (see and ), allowing regulated air flow through the five lobar bronchi.
Figure 1. The in vitro model of the human respiratory tract. (A) Thermostat chamber with a respiratory tract cast, (B) puff pinch valve, (C) variable area flowmeters, (D) GFB glass fiber filter holders, (E) programmable valve controller.
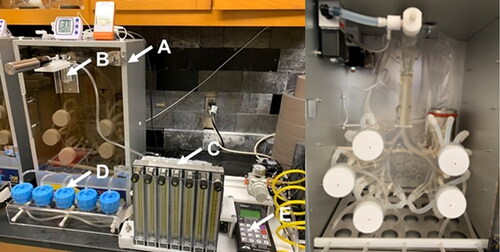
Figure 2. Schematic diagram of the in vitro model of the human respiratory tract.
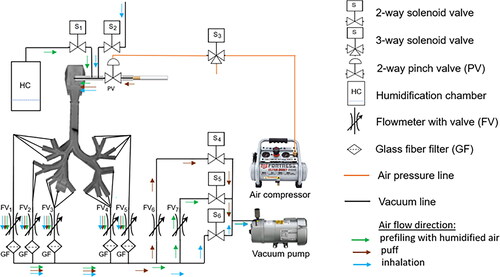
In the existing literature various inspiratory flow rates are reported spanning a broad spectrum of values. As they depend on the gender, age, body size (oxygen needs), in addition to the physico-mental state of the breathing subject (e.g., fitness or stress levels), it is common to express them as respiratory minute volume flow rates that combine both the tidal volumes and/or their frequency measured over one minute. It must be noted that from the physiological perspective, the average 500 mL tidal volume flow with 12 breathing cycles per minute will lead to a 6 L/min flowrate (respiratory minute ventilation). Simultaneously, the same situation in which the actual transient flow rate is calculated as representative minute average will lead to a study of 500 mL breath volumes taken in 2s, which eventually leads to a flowrate of 250 mL/s (15 L/min). This value is considered as typical at rest conditions and it was applied in (Nordlund et al. Citation2017). It must be noted that respiratory flow rates are also distinct from the inhalation flow rates (Zacny et al. Citation1987; Pearson et al. Citation1985; Herning, Hunt, and Jones Citation1983). Despite significant amount of data on volumes, frequencies and duration of puffing of the consumer products, sparse information is available about the subsequent inhalation of them (see Gregg et al. Citation2013). We technically followed the approach presented in (Nordlund et al. Citation2017) for calibrating the flowmeters in order to control the flow in each of the cast branch individually using negative pressure, but collectively achieve required total flowrate. It is naturally to assume that the inhalation volume is larger than a typical breath volume at rest conditions (500 mL). For this reason, we selected slightly larger transient flowrate of 700 mL in 2s for our experiments leading to a representative average of 21 L/min. The flowrates were distributed accordingly through the upper respiratory airways assuming minimal contraction/expansion in reality during the breathing/inhalation cycles and taking into account respective effective diameters of the branches. The air flow rates through the left superior, left inferior, right superior, right middle, and right inferior lobar bronchi were 2.3, 3.9, 4.8, 4.7, and 5.3 L/min, respectively. Transient flow conditions were applied and average values are just reported for the sake of eventual future comparisons. The puff and inhalation durations were controlled by a programmable valve controller (see ). Schematic diagrams of the human respiratory tract in vitro model are presented in .
2.2. The investigated nicotine aerosol delivery systems
The in vitro human respiratory tract model was used to assess nicotine deposition from three aerosol nicotine delivery systems: (1) e-cigarettes with 5% nicotine, 20% vegetable glycerin (VG), 6% water, and 69% propylene glycol (PG) (BLN-5%NIC); (2) e-cigarettes with 5% nicotine, 3.75% lactic acid, 20% VG, 6% water, and 65.25% PG (BLN-5%NIC-LA); and (3) combustible reference research cigarettes 1R6F (C-cig). Nicotine-containing e-liquids 1 and 2 were prepared in house, while 1R6F research cigarettes were purchased from the Kentucky Tobacco Research and Development Center (Lexington, KY, USA). The aerosol for the e-cigarette products was generated using a Mig 21 Clear Fusion Tank with a 2.5-Ohm coil and a Joyetech eVic (Joyetech, Shenzhen, China) at power 6 W. The combustible reference cigarette was lit by a Coleman type butane lighter to generate a puff.
2.3. Procedures
All experiments were performed at 37 °C temperature and RH 100%. One to three minutes before a puff delivery, a respiratory tract cast was filled with 300 mL of humidified air (37 °C and 100% RH). A single 2-s, 35-mL puff of e-cigarette aerosol or smoke containing 11C-nicotine was delivered to the respiratory tract cast by applying negative pressure. Immediately after the puff, a 2-s, 700-mL air wash-in volume was administered using negative pressure. Nicotine not deposited in the respiratory tract cast was collected using five 47-mm filter holders ( and ), each of which contained two GFB glass fiber filters. Deposition (retention) of 11C-nicotine in the respiratory tract cast was assessed using a GE Discovery MI DR PET/CT scanner. After each PET scan, GFB glass fiber filters were replaced with new filters and the respiratory tract cast was rinsed with 99.5% isopropyl alcohol (BDH®) and dried using air flow through the cast.
11C-nicotine was synthesized following an established protocol (Halldin et al. Citation1992). After evaporation of the high-performance liquid chromatography mobile phase, 11C-nicotine was dissolved in 20 µL of the appropriate e-liquid (for e-cigarettes) or ethyl alcohol (EtOH) for the reference cigarette. Next, 5 µL of e-liquid containing 11C-nicotine was applied to the coil of the Mig 21 Clear Fusion Tank, which was prefilled with the same non-radioactive e-liquid. For the reference cigarettes, half of the tobacco rod was removed, and 4 µL of EtOH containing 11C-nicotine was applied to the end of the tobacco rod. EtOH was evaporated by air flow through the cigarette. For all studied products, the first single 35-mL puff was investigated.
2.4. PET scanning
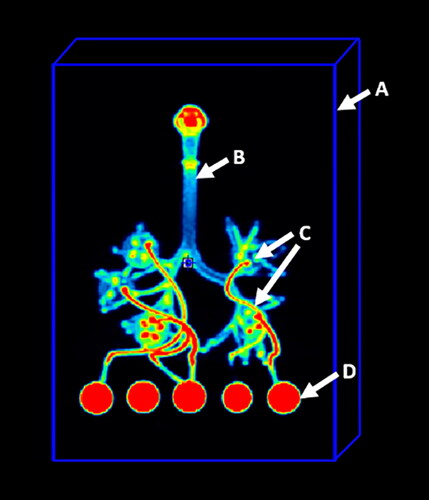
Four bed positions of PET imaging were performed over 8 min (2 min per bed position) using a GE Discovery MI DRPET/CT scanner (GE Healthcare, Chicago, IL, USA). Decay, attenuation, and scatter-corrected images were reconstructed at the 256 × 256 matrix size. Imaging data analysis was performed using PMOD software v. 4.2 (PMOD Technologies LLC, Zurich, Switzerland). For calculation of the total administered dose (TAD) of 11C-nicotine, a rectangular parallelepiped shape volume of interest (VOI) was placed on the image to cover the respiratory tract cast, GFB filter holders, and all connectors between the cast and filter holders (see ). The PET images were then normalized to TAD values, and the radioactivity signal outside of the respiratory tract cast was masked.
Figure 3. VOI placement for calculation of the total administered dose (TAD). (A) VOI placement, (B) respiratory tract cast, (C) connectors between the cast and filter holders, (D) GFB filter holders.
2.5. Data analyses
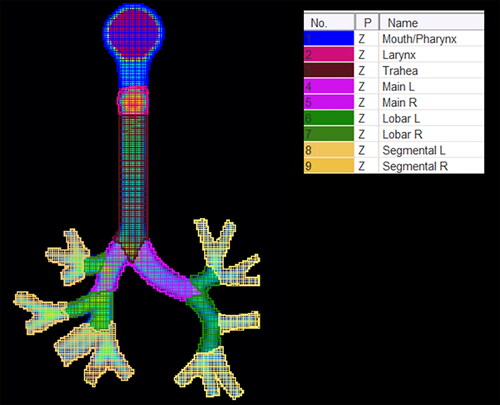
Obtained images were co-registered, and average product-specific 3D images were calculated using the Image Registration and Fusion module of PMOD 4.2 software. To calculate the fraction of TAD retained in the total cast and cast parts, nine standard regions of interest (ROIs) were placed on the coronal projections of normalized co-registered images (see ).
Figure 4. Standard regional ROI placement. Main, main bronchi; Lobar, lobar bronchi; Segmental, segmental bronchi.
Between-group comparisons were analyzed by one-way (single factor) or two-way (two factors) analysis of variance (ANOVA). Tukey’s Honest Significant Difference (HSD) tests or Bonferroni tests were used as post hoc tests for between-group comparisons. The threshold for statistical significance was set at p < 0.05. Group mean values ± standard error (SE) are reported unless otherwise specified.
3. Results
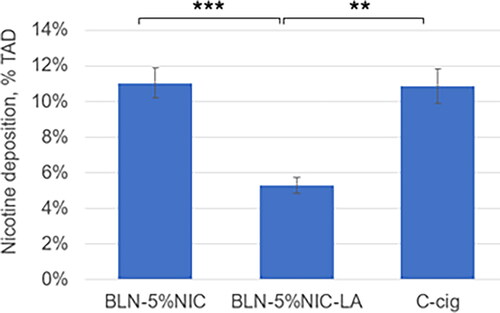
The average values ± SE for 11C-nicotine retention in the respiratory tract cast from three nicotine-containing products are presented in . The highest retention was observed for BLN-5%NIC e-liquid (pH = 9.7) and C-cig, and the lowest retention was observed in the BLN-5%NIC-LA e-liquid with (pH = 5.3). The analysis of variance (One Way (Single Factor) ANOVA) showed a significant effect of the type of nicotine-containing product on nicotine retention in the respiratory tract cast, F (2,28) = 12.3, p < 0.0001. The results of Tukey’s HSD post hoc tests revealed significant differences between BLN-5%NIC and BLN-5%NIC-LA (p < 0.0002) and between BLN-5%NIC-LA and C-cig (p < 0.002).
Figure 5. Nicotine retention in the respiratory tract cast at 37 °C and 100% relative humidity (RH), expressed as % of total administered dose (%TAD). **p < 0.002, *** p < 0.0002. Mean ± SE. The numbers of independent experiments are the following: BLN-5%NIC n = 15, BLN-5%NIC-LA n = 8, and C-cig n = 8.
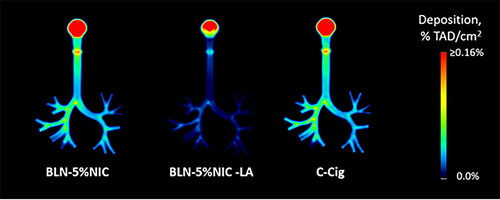
shows the quantitative group-average images of 11C-nicotine retention in the respiratory tract cast from all three nicotine-containing products. Individual images were normalized to the TAD. Each pair of images shows the distribution of radioactivity in a single (sagittal or coronal) slice of the respiratory tract cast. In , the same quantitative group-average imaging data are shown as coronal projections (sum of all coronal slices). This presentation enhances the perception of the degree of nicotine retention due to adsorption in the respiratory tract cast.
Figure 6. The average images, illustraitng the nicotine retention in the respiratory tract cast at 37 °C and 100% relative humidity (RH), expressed as a fraction of the total administered dose (%TAD). In each pair, the left and right images show sagittal and coronal slices, respectively. The numbers of independent experiments are the following: BLN-5%NIC n = 15, BLN-5%NIC-LA n = 8, and C-cig n = 8.
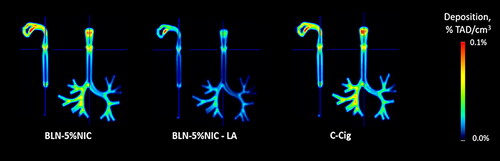
Figure 7. The average coronal projection images of nicotine retention in the respiratory tract cast at 37 °C and 100% relative humidity (RH), expressed as a fraction of the total administered dose (%TAD). The numbers of independent experiments are the following: BLN-5%NIC n = 15, BLN-5%NIC-LA n = 8, and C-cig n = 8.
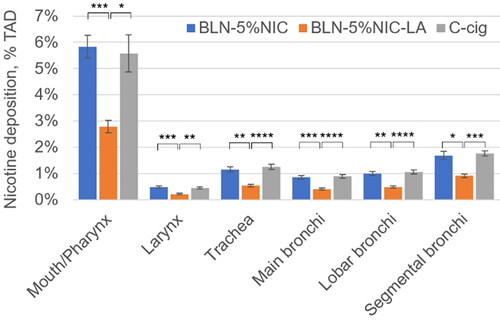
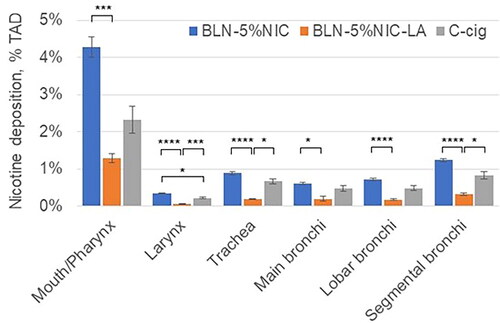
The results for nicotine deposition in the Mouth/Pharynx, Larynx, Trachea, and Bronchi are shown in . The results for a two-way ANOVA (with product as a between factor and respiratory tract segment as a repeated (within) factor) indicated a significant main effect for cast regions [F = 221.5 (5,140), p < 0.0001] and a significant main effect for product [F = 12.2 (2,140), p < 0.002]. Additionally, the results showed a significant interaction between segment and product [F = 9.09 (10,140), p < 0.001]. Since the interaction between segment and the product was significant, we chose to ignore the product main effect and instead examined the product simple main effects, that is, the differences between seven products for each of the six cast regions using six one-way ANOVA analyses. To control for Type I error rate across these analyses, we set the alpha level for each at 0.00833 (α/6 = 0.05/6). We found a statistically significant difference in average nicotine deposition according to nicotine-containing product type in each of six cast regions. For the Mouth/Pharynx, Larynx, Trachea, Main Bronchi, Lobar Bronchi, and Segmental Bronchi, the F (2,28) values were 10.3, 11.3, 12.1, 13.4, 12.1, and 10.1, respectively (all p < 0.001). In each of the six cast regions, nicotine deposition from BLN-5%NIC-LA e-liquid was significantly lower than those from BLN-5%NIC-LA e-liquid or C-cig (). This pattern corresponds to that observed for total cast deposition ().
Figure 8. Nicotine retention from nicotine-containing products in the Mouth/Pharynx, Larynx, Trachea, and Bronchi at 37 °C and 100% relative humidity (RH). Data expressed as % of total administered dose (%TAD, Mean ± SD). All P values were Bonferroni corrected for 18 multiple comparisons. * p < 0.05, ** p < 0.01, *** p < 0.005, and **** p < 0.001. The numbers of independent experiments are the following: BLN-5%NIC n = 15, BLN-5%NIC-LA n = 8, and C-cig n = 8.
To address possible between-product differences in the pattern of nicotine distribution in the Larynx, Trachea, and Bronchi, the individual cast images were normalized to the total dose of 11C-nicotine radioactivity deposited in the respiratory tract cast (TDRT). The results of this analysis showed that ∼50% of nicotine deposition in the respiratory tract cast occurred in the mouth cavity and pharynx. No product-specific pattern of nicotine retention distribution was observed.
Following the visual (in two projections: and ) and quantitative () presentations of the nicotine deposition results coming from physiologically relevant conditions of being generated by mixing the puffed aerosol with the inhalation flow at 37 °C and 100% RH, we present in the results obtained for the inhalation conditions at 22 °C and 51% RH (as similar to common room laboratory conditions at which aerosol is generated). The aerosol for these and former experiments was generated in the same way (conditions) excluding any product performance influence on the obtained results. Following these measurements, we were able to observe the influence of the inhalation conditions on the evolution and deposition of the aerosol containing labeled nicotine.
Figure 9. The average images of nicotine retention in the respiratory tract cast at room temperature (22 °C) and 51% relative humidity (RH), expressed as a fraction of the total administered dose (%TAD). In each pair, the left and right images show sagittal and coronal slices, respectively. The averages are from four independent experiments per condition.
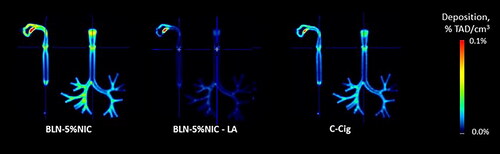
Figure 10. The average coronal projection images of nicotine retention in the respiratory tract cast at room temperature (22 °C) and 51% relative humidity (RH), expressed as a fraction of the total administered dose (%TAD). The averages are from four independent experiments per condition.
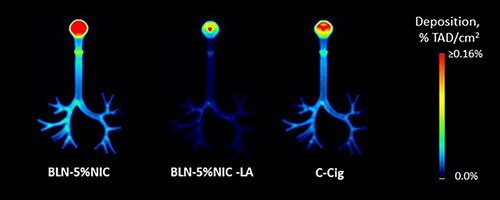
Figure 11. Nicotine retention from nicotine-containing products in the Mouth/Pharynx, Larynx, Trachea, and Bronchi at room temperature (22 °C) and 51% relative humidity (RH). Data are expressed as % of total administered dose (%TAD, Mean ± SE). All P values were Bonferroni corrected for 18 multiple comparisons. * p < 0.05, ** p < 0.01, *** p < 0.005, and **** p < 0.001. The number of independent experiments per product is n = 4.
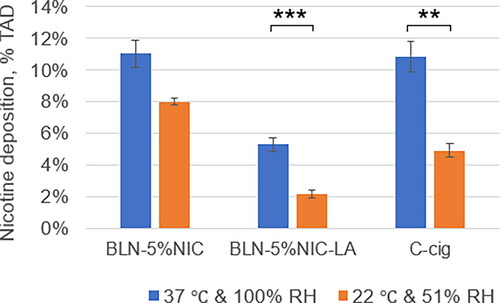
In and two cast projections illustrating the nicotine retention at the laboratory conditions (22 °C and 51% RH) are shown. Overall decreased levels of nicotine in the presented heatmaps pictures are visible in particular for a conventional cigarette smoke. Significant alterations of the nicotine retention in the mouth region are most likely caused by mixing of two flows (in comparison to the previous dataset obtained for 37 °C and 100% RH). These appear to be largely present in the cigarette smoke and also aerosol coming from the pH-modifed e-liquid. Quantification of the nicotine deposits plotted in confirms these visual observations, i.e., approximately doubled nicotine retention (at 37 °C and 100% RH) in the mouth/pharynx regions for cigarette smoke and aerosol coming from the pH-modifed e-liquid and slight increase for a typical e-liquid aerosol. These results suggest significant aerosol dynamics influence and related heat and mass transfers occuring on a very short time scales during the initial mixing of the flows. Finally, we assessed the total nicotine retention from these nicotine-containing products at room temperature and humidity and compared these results with those obtained under the 37 °C and 100% RH condition (). Two-way ANOVA indicated a significant main effect for condition [F = 30 (1,37), p < 0.001] and a significant main effect for product [F = 24 (2,47), p < 0.0001]. No significant interaction between condition and product was observed. The results of Tukey’s HSD post hoc tests () showed significant differences between conditions for BLN-5%NIC-LA (p < 0.003) and C-cig (p < 0.01). Taken together, these results suggest the importance of performing nicotine deposition experiments at 37 °C and 100% RH.
Figure 12. Nicotine deposition in the respiratory tract at room temperature (22 °C) and 51% relative humidity (RH) vs. 37 °C and 100% RH, expressed as % of total administered dose (%TAD, Mean ± SE). ** p < 0.01, *** p < 0.003. The numbers of independent experiments at 37 °C are the following: BLN-5%NIC n = 15, BLN-5%NIC-LA n = 8, and C-cig n = 8.
4. Conclusions
Development of an in vitro cast of the airways with controlled airflow, thermal, and humidity conditions allowed us to study the deposition of 11C-nicotine-labeled aerosols generated from the conventional standard reference cigarette and an e-cigarette tank system containing two similar formulations of e-liquid with varying pH. This system can be further extended with equipment measuring aerosol characteristics. By comparison of deposited 11C-nicotine, we measured the influence of pH on overall nicotine delivery in the human airway represented by the in vitro cast model. We obtained relatively similar nicotine deposition results for two chemically distinct aerosols (cigarette smoke and e-cigarette-generated aerosol from standard e-liquid mixtures). Decreasing the e-liquid pH significantly reduced nicotine deposition in the respiratory tract model, which is functionally aligned with publicly available data on increased nicotine transfer from low-pH nicotine-containing products (Goldenson et al. Citation2022). Our results also corroborate modeling predictions developed with the whole-lung modeling approach in (Pichelstorfer et al. Citation2021) that examined low-pH and no-acid cases and found significant differences in nicotine deposition. Although the collective results point toward increased nicotine transfer to the deep lungs for low-pH liquid, the detailed mechanisms governing nicotine transfer remain to be elucidated.
Employing additional experimental techniques such as particle size measurement, gas-liquid partitioning using denuders, and measuring activity coefficients of the nicotine may close existing gaps and clarify the nature of the dominant mechanisms. Certainly, the observed nicotine retention patterns are resulting from complex aerosol processes including aerosol particle size evolution combined with condensation/evaporation of compounds occurring along their transport in the airways. In our experiments, we used the same airflow for generation of the aerosol from the considered three products (conventional cigarette and two e-liquid mixtures). Thus, visible alterations in nicotine retention are introduced intrinsically by the aerosol chemistry and physics of considered mixtures and externally by the inhalation flow conditions. Due to rather insignificant changes (mass-fraction wise: <4%) of e-liquid composition impacting the aerosol formation process, the resulting particle size distribution from the e-vapor product are not modulated at the generation time (product). This was confirmed experimentally for similar e-liquid mixture compositions in various external experiments conducted separately for these types of e-liquid mixtures, but not specific to the considered ones. In addition, most of the experimental techniques available for measuring the particle size distribution (PSD) are indirect and require additional flow dilution introducing measurements artifacts to such highly dynamic and continuously evolving liquid aerosols at very small average particle size and large particle number density. For this reason, it can be further debated whether the generally observed lack of significant PSD modifications is guided by delivered above physics-based rationale (small mass fraction of modulating additives (acids)) or experimental measurements artifacts related to the aerosol evolution. In our opinion, the computational methods have complementary and growing potential to deliver in this domain more detailed and reliable results than currently available experimental methods.
Due to complexity and nature of evolving aerosols, the understanding of the aerosol deposition in the human lungs is still very limited. It is expected due to convection-dominated flows in the first generations of the airways that most of the aerosol deposition is due to impaction and simultaneous hygroscopic growth of the particles. Current state of the scientific knowledge concerning nicotine containing aerosol mixtures cannot differentiate between pure particle deposition including potential hygroscopic growth of particles containing nicotine or effects related to the gas-liquid partitioning and evaporation of the nicotine to the gas phase resulting in enhanced nicotine vapor deposition in the respiratory tract (see various hypotheses in, Pankow Citation2001). The mentioned previously gas-liquid partitioning with enhanced evaporation can be the major process governing the pH-modulated nicotine transfer in the airways, but also other effects like for example four-way coupling of aerosol particles in a dense aerosol mixture, which causes drag reduction for a motion of particles in “a dense cloud” as suggested by (Martonen and Musante Citation2000). All mentioned affects are not contradictory and can take place in parallel at different magnitudes. As the inhalation flows are transient, intrinsic boundary-layer flow considerations may also play an important role in affecting mechanisms of nicotine deposition. Our nicotine containing cigarette smoke retention data patterns in the oral cavity are generally consistent with the modeling predictions for smoke particles (see Paul et al. Citation2021). Combining computational methods, further developing experimental techniques that would also allow to study aerosol flow and deposition in smaller branches of the tracheobronchial tree airways would be beneficial. The limitations of the applied experimental technique include relatively limited time for experimentation due to the labeled compound and decay kinetics, labeling itself that is specific to the compound while it does not trace other compounds in the mixture and last but not least, quite intensive computational effort required for the analyzes of obtained volumetric scan data.
Future experiments should combine investigations of nicotine deposition/absorption with nicotine transfer through human organotypic respiratory epithelial tissue cultures. These investigations should be computationally linked with existing physiologically based pharmacokinetic models to understand the whole picture of nicotine ADME (absorption, distribution, metabolism, and excretion) profile cycles. In recently published nicotine PBPK model (Kolli et al. Citation2023) the deconvolution of upper and lower respiratory tract nicotine absorption was required for accurate prediction of the existing clinical literature data considering nicotine disposition. Ultimate bridging of predictive regional aerosol dosimetry with in vitro, in vivo and clinical outcomes (Kolli et al. Citation2019) is required and generated in vitro data are useful for verification and validation of modeling predictions. Our in vitro human respiratory tract model may also be used to investigate the deposition of other molecules prior to performing resource-intensive pharmacokinetics studies.
Acknowledgments
The authors would like to thank Shoaib Majeed, Jean-Pierre Schaller, and Aline Vuarnoz for the technical discussions and intellectual contribution. We are also grateful to Allison Fulp and Joseph Bottoms for assistance with PET data acquisition; Virginia Hylton, David Botts, and Tanaia Botts for administrative support; and Aeva Jazic for editorial assistance.
Disclosure statement
A.K.K. and J.H. are employees of Philip Morris International. J.R. discloses research support from Foundation for a Smoke-Free World, Philip Morris International, Altria, Embera Neurotherapeutics, Inc., Otsuka Pharmaceutical, and Juul Labs, Inc.; consulting with Revive Pharmaceuticals; and consulting and patent purchase agreements with Philip Morris International. A.G.M. discloses grants from the National Institute on Drug Abuse and consulting for Rose Research Center LLC on the project funded by Philip Morris International and K.K.S.S. discloses grant from the National Institute of Health and a subcontract with Rose Research Center LLC on the project funded by Philip Morris International.
Additional information
Funding
References
- Ahn, J., G. Rao, and E. Vejerano. 2021. Dependence on humidity and aerosol composition of the gas-particle partitioning of weakly and moderately polar VOCs. Aerosol. Air. Qual. Res. 21 (11):210094. doi:10.4209/aaqr.210094.
- Ahookhosh, K., O. Pourmehran, H. Aminfar, M. Mohammadpourfard, M. M. Sarafraz, and H. Hamishehkar. 2020. Development of human respiratory airway models: A review. Eur. J. Pharm. Sci. 145:105233. doi:10.1016/j.ejps.2020.105233.
- Asgari, M., F. Lucci, and A. Kuczaj. 2021. Multispecies aerosol evolution and deposition in a human respiratory tract cast model. J. Aerosol Sci. 153:105720. doi:10.1016/j.jaerosci.2020.105720.
- Asgari, M., F. Lucci, J. Bialek, B. Dunan, G. Andreatta, R. Smajda, S. Lani, N. Blondiaux, S. Majeed, S. Steiner, et al. 2019. Development of a realistic human respiratory tract cast representing physiological thermal conditions. Aerosol. Sci. Technol. 53 (8):860–70. doi:10.1080/02786826.2019.1612839.
- Asgharian, B., A. Rostami, O. Price, and Y. Pithawalla. 2018. Regional deposition of inhaled aerosol constituents from Electronic Nicotine Delivery Systems (ENDS) in the respiratory tract. J. Aerosol Sci. 126:7–20. doi:10.1016/j.jaerosci.2018.08.006.
- Baassiri, M., S. Talih, R. Salman, N. Karaoghlanian, R. Saleh, R. El Hage, N. Saliba, and A. Shihadeh. 2017. Clouds and “throat hit”: Effects of liquid composition on nicotine emissions and physical characteristics of electronic cigarette aerosols. Aerosol. Sci. Technol. 51 (11):1231–9. doi:10.1080/02786826.2017.1341040.
- Bordas, R., C. Lefevre, B. Veeckmans, J. Pitt-Francis, C. Fetita, C. E. Brightling, D. Kay, S. Siddiqui, and K. S. Burrowes. 2015. Development and analysis of patient-based complete conducting airways models. PLoS One. 10 (12):e0144105. doi:10.1371/journal.pone.0144105.
- Cei, D., A. Doryab, A.-G. Lenz, A. Schröppel, P. Mayer, G. Burgstaller, R. Nossa, A. Ahluwalia, and O. Schmid. 2021. Development of a dynamic in vitro stretch model of the alveolar interface with aerosol delivery. Biotechnol. Bioeng. 118 (2):690–702. doi:10.1002/bit.27600.
- David, G., E. Parmentier, I. Taurino, and R. Signorell. 2020. Tracing the composition of single e-cigarette aerosol droplets in situ by laser-trapping and Raman scattering. Sci. Rep. 10 (1):7929. doi:10.1038/s41598-020-64886-5.
- El-Hellani, A., R. El-Hage, R. Baalbaki, R. Salman, S. Talih, A. Shihadeh, and N. Saliba. 2015. Free-base and protonated nicotine in electronic cigarette liquids and aerosols. Chem. Res. Toxicol. 28 (8):1532–7. doi:10.1021/acs.chemrestox.5b00107.
- Feng, Y., C. Kleinstreuer, and A. Rostami. 2015. Evaporation and condensation of multicomponent electronic cigarette droplets and conventional cigarette smoke particles in an idealized G3–G6 triple bifurcating unit. J. Aerosol Sci. 80:58–74. doi:10.1016/j.jaerosci.2014.11.002.
- Gallagher, L., M. Joyce, B. Murphy, M. Mac Giolla Eain, and R. MacLoughlin. 2020. The impact of head model choice on the in vitro evaluation of aerosol drug delivery. Pharmaceutics 14 (1):24. doi:10.3390/pharmaceutics14010024.
- Goldenson, N., E. Augustson, J. Chen, and S. Shiffman. 2022. Pharmacokinetic and subjective assessment of prototype JUUL2 electronic nicotine delivery system in two nicotine concentrations, JUUL system, IQOS, and combustible cigarette. Psychopharmacology. 239 (3):977–88. doi:10.1007/s00213-022-06100-0.
- Gregg, E., T. Bachmann, R. Bito, X. Cahours, M. McEwan, P. Nelson, and M. Stiles. 2013. Assessing smoking behaviour and tobacco smoke exposure: Definitions and methods. Contributions to Tobacco & Nicotine Research 25 (8):6.
- Haddrell, A., D. Lewis, T. Church, R. Vehring, D. Murnane, and J. Reid. 2017. Pulmonary aerosol delivery and the importance of growth dynamics. Ther. Deliv. 8 (12):1051–61. doi:10.4155/tde-2017-0093.
- Halldin, C., K. Någren, C.-G. Swahn, B. Långström, and H. Nybäck. 1992. (S)- and (R)-[11C]nicotine and the metabolite ()-[11C]cotinine. preparation, metabolite studies and in vivo distribution in the human brain using PET. Int. J. Radiat. Appl. Instrum. Part B. 19 (8):871–80. doi:10.1016/0883-2897(92)90173-V.
- Herning, R., J. Hunt, and R. Jones. 1983. The importance of inhalation volume when measuring smoking behavior. Behavior Research Methods & Instrumentation 15 (6):561–8. doi:10.3758/BF03203722.
- Kolli, A. R., F. Calvino-Martin, A. K. Kuczaj, E. T. Wong, B. Titz, Y. Xiang, S. Lebrun, W. K. Schlage, P. Vanscheeuwijck, and J. Hoeng. 2023. Deconvolution of systemic pharmacokinetics predicts inhaled aerosol dosimetry of nicotine. Eur. J. Pharm. Sci. 180:106321. doi:10.1016/j.ejps.2022.106321.
- Kolli, A., A. Kuczaj, F. Martin, A. Hayes, M. Peitsch, and J. Hoeng. 2019. Bridging inhaled aerosol dosimetry to physiologically based pharmacokinetic modeling for toxicological assessment: Nicotine delivery systems and beyond. Crit. Rev. Toxicol. 49(9):725–41.
- Laaksonen, A., and M. Kulmala. 1991. An explicit cluster model for binary nuclei in water–alcohol systems. J. Chem. Phys. 95, 6745–48.
- Lewis, E. 2006. The effect of surface tension (Kelvin effect) on the equilibrium radius of a hygroscopic aqueous aerosol particle. J. Aerosol Sci. 37 (11):1605–17. doi:10.1016/j.jaerosci.2006.04.001.
- Li, L.,. E. Lee, C. Nguyen, and Y. Zhu. 2020. Effects of propylene glycol, vegetable glycerin, and nicotine on emissions and dynamics of electronic cigarette aerosols. Aerosol. Sci. Technol. 54 (11):1270–81. doi:10.1080/02786826.2020.1771270.
- Lim, S., H. Kathuria, J. Tan, and L. Kang. 2018. 3D printed drug delivery and testing systems - a passing fad or the future? Adv. Drug. Deliv. Rev. 132:139–68.
- Lizal, F., J. Jedelsky, K. Morgan, K. Bauer, J. Llop, U. Cossio, S. Kassinos, S. Verbanck, J. Ruiz-Cabello, A. Santos, et al. 2018. Experimental methods for flow and aerosol measurements in human airways and their replicas. Eur. J. Pharm. Sci. 113:95–131. doi:10.1016/j.ejps.2017.08.021.
- Martonen, T., and C. Musante. 2000. Importance of cloud motion on cigarette smoke deposition in lung airways. Inhal. Toxicol. 12 (Suppl 4):261–80. doi:10.1080/08958370050165120.
- Nordlund, M., M. Belka, A. Kuczaj, F. Lizal, J. Jedelsky, J. Elcner, and J. Hoeng. 2017. Multicomponent aerosol particle deposition in a realistic cast of the human upper respiratory tract. Inhal. Toxicol. 29(3):113–25.
- Pankow, J. 2001. A consideration of the role of gas/particle partitioning in the deposition of nicotine and other tobacco smoke compounds in the respiratory tract. Chem. Res. Toxicol. 14 (11):1465–81. doi:10.1021/tx0100901.
- Patel, B., R. Gauvin, S. Absar, V. Gupta, N. Gupta, K. Nahar, A. Khademhosseini, and F. Ahsan. 2012. Computational and bioengineered lungs as alternatives to whole animal, isolated organ, and cell-based lung models. Am. J. Physiol. Lung Cell. Mol. Physiol. 303 (9):L733–L747. doi:10.1152/ajplung.00076.2012.
- Paul, A., F. Khan, A. Jain, and S. Saha. 2021. Deposition of smoke particles in human airways with realistic waveform. Atmosphere 12 (7):912. doi:10.3390/atmos12070912.
- Pearson, M., M. Chamberlain, W. Morgan, and S. Vinitski. 1985. Regional deposition of particles in the lung during cigarette smoking in humans. J. Appl. Physiol. 59 (6):1828–33. doi:10.1152/jappl.1985.59.6.1828.
- Phalen, R., M. Hoover, M. Oldham, and A. Jarabek. 2021. Inhaled aerosol dosimetry: Research-related needs and recommendations. J Aerosol Sci. 155 (5):105755.
- Pichelstorfer, L., W. Hofmann, R. Winkler-Heil, C. Yurteri, and J. McAughey. 2016. Simulation of aerosol dynamics and deposition of combustible and electronic cigarette aerosols in the human respiratory tract. J Aerosol Sci. 99:125–32.
- Pichelstorfer, L., R. Winkler-Heil, M. Boy, and W. Hofmann. 2021. Aerosol dynamics simulations of the anatomical variability of e-cigarette particle and vapor deposition in a stochastic lung. J. Aerosol Sci. 158:105706. doi:10.1016/j.jaerosci.2020.105706.
- Romakkaniemi, S., H. Kokkola, J. Smith, N. Prisle, A. Schwier, F. McNeill, and A. Laaksonen. 2011. Partitioning of semivolatile surface‐active compounds between bulk, surface and gas phase. Geophys. Res. Lett. 38 (3):3807. doi:10.1029/2010GL046147.
- Sanchez-Crespo, A. 2019. Lung scintigraphy in the assessment of aerosol deposition and clearance. Semin. Nucl. Med. 49 (1):47–57. doi:10.1053/j.semnuclmed.2018.10.015.
- Sauret, V., P. Halson, I. Brown, J. Fleming, and A. Bailey. 2002. Study of the three-dimensional geometry of the central conducting airways in man using computed tomographic (CT) images. J. Anat. 200 (Pt 2):123–34. doi:10.1046/j.0021-8782.2001.00018.x.
- Schroeter, J., B. Asgharian, O. Price, J. Kimbell, and M. Singal. 2013. Modeling the evaporation and deposition of semi-volatile liquid droplets in the upper respiratory tract. J. Aerosol. Med. Pulm. Drug. Deliv. 26 (2):A65.
- Solingapuram Sai, K. K., Y. Zuo, J. E. Rose, P. K. Garg, S. Garg, R. Nazih, A. Mintz, and A. G. Mukhin. 2020. Rapid brain nicotine uptake from electronic cigarettes. J. Nucl. Med. 61 (6):928–30. doi:10.2967/jnumed.119.230748.
- Soni, B., and A. Nayak. 2019. Effect of inspiration cycle and ventilation rate on heat exchange in human respiratory airways. J. Therm. Biol. 84:357–67. doi:10.1016/j.jtherbio.2019.07.026.
- Sosnowski, T., and M. Odziomek. 2018. Particle size dynamics: Toward a better understanding of electronic cigarette aerosol interactions with the respiratory system. Front. Physiol. 9:853. doi:10.3389/fphys.2018.00853.
- Sul, B., Z. Oppito, S. Jayasekera, B. Vanger, A. Zeller, M. Morris, and A. Wallqvist. 2018. Assessing airflow sensitivity to healthy and diseased lung conditions in a computational fluid dynamics model validated in vitro ASME. J. Biomech. Eng. 140 (5):96.
- Tackman, E., R. Grady, and M. Freedman. 2022. Direct measurement of the pH of aerosol particles using carbon quantum dots. Anal. Methods. 14 (30):2929–36. doi:10.1039/D2AY01005D.
- Tsuda, A., F. Henry, and J. Butler. 2013. Particle transport and deposition: Basic physics of particle kinetics. Compr. Physiol. 3 (4):1437–71. doi:10.1002/cphy.c100085.
- Zacny, J., M. Stitzer, F. Brown, J. Yingling, and R. Griffiths. 1987. Human cigarette smoking: Effects of puff and inhalation parameters on smoke exposure. J. Pharmacol. Exp. Ther. 240 (2):554–64.
- Zuo, Y., P. Garg, R. Nazih, S. Garg, J. Rose, T. Murugesan, and A. Mukhin. 2017. A programmable smoke delivery device for PET imaging with cigarettes containing 11C-nicotine. J. Neurosci. Methods. 283:55–61.