
 ?Mathematical formulae have been encoded as MathML and are displayed in this HTML version using MathJax in order to improve their display. Uncheck the box to turn MathJax off. This feature requires Javascript. Click on a formula to zoom.
Abstract
A unique adult human mouth/throat physical model has been developed to study e-cigarette aerosol dynamics during inhalation. The 3D printed physical model was created from the CT scan of a 28 yr. old healthy male. Internal walls of the physical model were lined with a thin layer of cotton gauze that can be saturated with water to replicate the high relative humidity conditions in a human Oral/Pharyngeal cavity. Aerosol hygroscopic growth and deposition inside the physical model from a cartomizer style e-cigarette using a prototype e-liquid formulation was determined by measuring cumulative aerosol mass from five puffs (gravimetric) and for individual constituents (propylene glycol, glycerol, and nicotine) from a single puff (GC/MS analysis). Measurements were taken at constant temperature of 37 °C under both wet and dry inner wall conditions for a for a 3-sec. 55 mL puff. The condition of holding aerosol inside the physical model without airflow for a duration of 3-sec. was also included. For the same puffing conditions of 3-sec puff of 55 mL and a 3-sec. puff hold time, dry wall conditions resulted in a mean aerosol mass loss of 20.9 ± 3.8%, while the total aerosol mass was increased by 150.9 ± 19% under wet wall condition when compared to total aerosol mass entering the physical model entrance. The dramatic increase is due to water vapor uptake by the aerosol particles when flowing through the wetted physical model. Aerosol evolution of individual chemical constituent analysis appeared to vary as a function of volatility.
EDITOR:
1. Introduction
Electronic nicotine delivery systems (ENDS), also known as electronic cigarettes, e-cigarettes, vaping devices, or vaping pens, have gained a lot of attention as possible alternatives to conventional cigarettes. These devices generate a high aerosol concentration (on the order of 108 to 109 particles per mL of air) which is made up largely of hygroscopic and semi-volatile compounds (Ingebrethsen et al. Citation2011; Fuoco et al. Citation2014). Several mechanisms govern the transport and deposition of inhaled aerosol particles as they pass through the respiratory tract, including convective transport of the particles, condensation, diffusion, evaporation, inertial impaction, sedimentation, coagulation, and others (Hinds Citation1999, 233–259; Hofmann Citation2011). The regional deposition of inhaled particles also depends upon the physical and chemical, of the aerosol and physiological factors of the subject inhaling the particles including airway geometry and inhalation volume, flow rates and patterns. Inhaled aerosols also evolve over time by dynamic processes including coagulation, evaporation, or hygroscopic growth that continue during inhalation and transport through the respiratory tract (Hinds Citation1999, 260–303).
Evaporation and hygroscopic growth are dependent on the local environment. Since vapor pressures varies exponentially with temperature, evaporation is a temperature dependent process. Evaporation is also controlled by the partial pressure of the evaporating compound in the environment. If there is not a sink for the evaporating compound in the system, the environment will saturate with the compound and evaporation will stop. Similarly, hygroscopic growth requires a humid environment and depends on the water activity of the aerosol particles, with more hygroscopic materials expected to absorb more water. If there is no source for additional water vapor, or the water vapor cannot be replenished quickly enough, then hygroscopic growth will cease or slow.
Due to the complexity of aerosol transport through the respiratory tract many different methods are used for assessing the deposition of inhaled aerosols. These include clinical and in vivo animal or human studies, computational (in silico) simulations and in vitro models. These methods all have advantages and limitations. While clinical and in vivo studies are most physiologically realistic and can provide useful and relevant information, the costs, regulations, and time associated with conducting such studies limits their application to only the most critical circumstances (Pattle Citation1961; Speizer and Frank Citation1966; Bergström et al. Citation1995; Oldham et al. Citation2017; Feng et al. Citation2007). In vitro and computational studies allow detailed investigation in static airways that can’t be accomplished with in-vivo or human studies.
Computational models have also been used to predict airway deposition efficiency and pattern in the human respiratory tract. Koblinger and Hofmann (Citation1990) applied a Monte Carlo method to model aerosol deposition in the human lung. Li and Ahmadi (Citation1995) conducted detailed computer simulations of particle transport and deposition in the airways. They found airway turbulence strongly affects the particle deposition rate. More recently researchers have tried to extend these computational models that typically considered dilute, non-interacting aerosols, to include dynamic processes such as coagulation, evaporation, and hygroscopic growth (Muller et al. Citation1990; Robinson and Yu Citation2001; Broday and Robinson Citation2003). Worth Longest and Xi (Citation2008) used computational fluid dynamics (CFD)simulations to study the effect of condensational growth on the transport and deposition of diluted cigarette smoke particle in the upper respiratory tract under various relative humidity and temperature conditions. Kane et al. (Citation2010) extended the Multiple-Path Particle Dosimetry (MPPD) Model to include dynamic aerosol behaviors, while Asgharian et al. (Citation2014) further enhanced the mechanistic understanding behind these dynamics. More recently researchers have applied deposition models to ENDS, which differ from cigarette smoke, in hygroscopicity and volatility (Asgharian, et al. Citation2018a, Asgharian, et al. Citation2018b; Pourhashem Citation2020).
In vitro experiments have also been used by researchers to study aerosol dynamics in the respiratory tract (Schiffelers et al. Citation2012). Using physical models as a surrogate for in vivo experiments offers the advantage of not having to rely on computational modeling simplifying assumptions and approximations about the aerosol that might miss or hide important dynamic behaviors. It also makes it possible to observe complex interactions within a system, that might not be predicted by a computational model.
Early physical models were frequently highly simplified due to the difficulty in replicating the lung anatomy (Davies Citation1961; Horsfield et al. Citation1971; Weibel 1965). Based on idealized lung geometries, various models have been developed to understand the flow pattern and deposition mechanisms within the airways (Beeckmans, Citation1965; Taulbee and Yu, Citation1975). More realistic human upper airway geometries have been obtained from cadavers using plastic or resin casts. Such models have been used to study airborne particle deposition (Cheng et al. Citation1988, Citation1999; Gradon and Yu Citation1989; Guilmette et al. Citation1994). Cheng et al. (Citation1988) built a model of the human nasal airways using a clear polyester resin based on a negative cast from a postmortem specimen obtained from human adult. Much of the previous effort to replicate human anatomical models for in vitro studies of airway deposition has been toward replicating the complex geometry of the real human respiratory system. However, these physical models are still far from the real system. In addition to the complex geometry, which can change as a function of airflow (e.g., larynx, airway diameters and length, etc.) the temperature (37 °C) and high humidity (>90%RH) of the respiratory tract also play an important role in airway deposition.
With the advent of 3D printing technology, various rapid 3D prototype machines have been used to produce different hollow models of the respiratory tract geometry. Nordlund et al. (Citation2017) developed a segmented cast of the human airways that included the mouth/throat and airways to generation 7. This cast was employed to study multi component aerosol consisting of propylene glycol, glycerol, nicotine, and water. Analyzing the regional deposition in the model they determined that most of the aerosol mass that deposits within the airways was deposited by particle deposition. This geometry was later used to develop a model that included heating the cast to physiologically relevant temperatures of the human respiratory tract of 37 C (Asgari et al. Citation2019). Using a combination of measurements and CFD modeling they found that the inhaled air flow equilibrates with the temperature of the cast within the mouth/throat region.
In this report, a system for studying the complex aerosol dynamics that occurs during inhalation using a realistic physical model of the human mouth/throat is presented. The physical model of the human mouth/throat was fabricated on 3-D printer from the CT scan of a healthy adult male. The interior surface of the hollow physical model was coated with a cotton gauze material that can be wetted to produce a humid environment. The temperature of the cast is also controlled, so that processes such as evaporation, coagulation, deposition, and hygroscopic growth can be studied under physiologically relevant conditions. This system is used to study the transport and deposition of aerosols produced by a prototype cartomizer style ENDS product through the physical model of the human mouth/throat.
2. Experimental setup and methods
2.1. Physical model
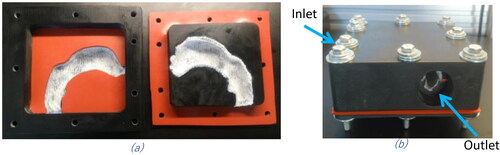
A hollow physical model was created based on the computed tomography (CT) scan of a 28-year-old, healthy human Caucasian male, 80 kg body weight and 1.81 m tall. The oral cavity, pharynx, and larynx were extracted from the scan (). The inlet and outlet of the air flow passages were designed to allow for easy connections to the aerosol generation apparatus and exit measurements. The hollow physical model was created as a block with the airway geometry open in the center (). The hollow physical model was fabricated on a rapid 3-D printer (Connex 300, Stratasys, CA) in two interlocking pieces made from VeroWhitePlus RGD 835 and VeroBlackPlus RGD 875 base materials. The interior surface of the model was designed to accommodate a thin layer of cotton gauze which could be wetted with water to create a high humidity environment within the model. Custom-made silicon rubber gaskets were used as a seal between the two physical model sections that were held together by bolts around the perimeter to prevent air leaks (). The model block has external dimensions of 14.5 cm x 13.65 cm x 6.0 cm with an internal airway volume of 69.8 cm3.
Figure 1. Geometry of model upper respiratory tract including the oral cavity, pharynx and larynx obtained from the CT scan of a 28 year old, healthy human Caucasian male, 80 kg body weight and 1.81 m tall.
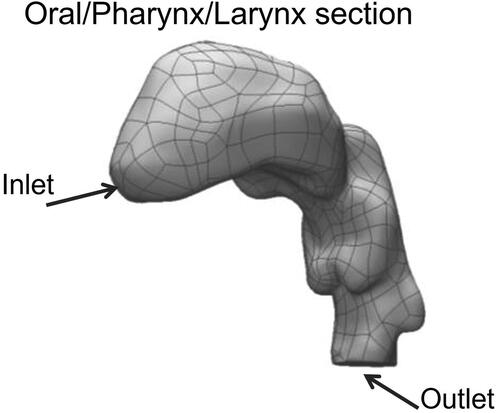
Figure 2. Model block encompassing the 3D printed physical model of a human male airways containing the oral cavity, pharynx and larynx. (a) Top and bottom sections of the block, both containing the impression of the airways lined with the cotton gauze. (b) Assembled model block showing the locations of the inlet and outlet ports.
2.2. Experimental setup
The setup consists of three parts: the entrance section for the aerosol sample generation and clearing flows, the physical model block and the exit section for sample collection and other measurements (). The physical model block was maintained at a constant 37 °C (human body temperature) in a convection oven. The temperature of the model was monitored during the measurements using a K type thermocouple and a datalogger/thermometer (OMEGA Model-HH506RA, US). The humidity of the system was monitored by a relative humidity (RH) probe (Omega, US) at the exit of the model block.
Figure 3. Schematic diagram of the experimental setup.
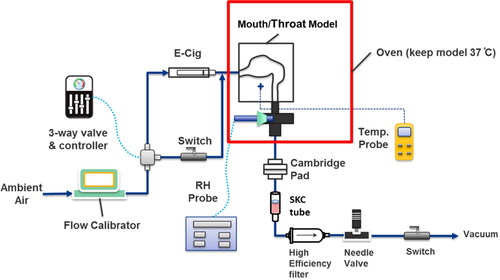
The entrance section of the setup was connected to the inlet or “mouth” inlet of the model (). To best replicate the flow path of the aerosol during use, the ENDS puffing system was connected directly to the inlet of the mouth/throat model. The ENDS puffing system was designed so the effluent aerosol from the ENDS will flow directly into the mouth without passing through any restrictions such as valves or bends. The ENDS is housed in a larger tube with an inlet for ambient air to control the flow through the ENDS with via a proximal entrance three-way valve. The ENDS is connected in parallel to a fresh air flow for flushing the model after the aerosol puffs. Both the ENDS puff flow and the flush flow are connected to a three-way solenoid valve (Model #8320G200, ASCO, NJ, US) controlled by a digital electronic timer (Model 451, GraLab, OH, US).
These experiments utilized a prototype cartomizer style ENDS product as the aerosol generation source. Approximately 1 ml of one of the four e-liquid formulations was added to the cartomizers prior to the experiments (). The addition of water to e-liquid formulations #3 and #4 results in e-liquid water activity of about 0.45, which corresponds to the ambient relative humidity of 45% over the e-liquid at equilibrium.
Table 1. Composition of the e-liquid formulations used for these experiments. Composition is presented as the percent by mass in the formulation.
One method to reduce the volatility of nicotine in ENDS products is the use of nicotine salt in formulating the e-liquid, which can be accomplished by adding acids to the e-liquid solution (Gholap et al. Citation2020; Leventhal et al. Citation2021). The lower pH of the nicotine salt e-liquid formulations protonates the nicotine leading to a less volatile species compared to nicotine in the freebase form. To test the effects of the nicotine salt e-liquid formulations an acid blend was added to the base nicotine e-liquid formulation of e-liquid #3 to create e-liquid #4. The acid blend was added such that it was 1.5% by mass of the e-liquid solution. Nicotine and water amounts were held constant, with small changes made to the propylene glycol (PG) and glycerol (GLY) amounts, accommodating for the additional 1.5% of acid in the e-liquid.
The exit section of the experimental setup contains the measurement and collection devices as well as the flow generation system. At the outlet of the physical model, a 4-way cross connects the relative humidity (RH) probe (Omega, US) and sampling train to the model. The extra port of the cross is capped for these experiments but could be used for additional sampling or monitoring capability as needed. The sampling train consists of a high efficiency filter, sorption trap for vapors, needle valve for flow control, a switch valve to stop the flow to simulate mouth hold, and a vacuum pump as indicated in . For the measurements reported here a Cambridge filter pad (Borgwaldt, part#80202851, Germany) and an OSHA Versatile Sampler (OVS) tube (SKC Inc., PA, US), referred to as “SKC tube” in , was used for the volatile sorption trap. A high efficiency filter (TSI, US) was placed after the SKC tube to trap and to protect the vacuum system. The flowrate for the experimental setup was provided by house vacuum, controlled by needle valve, and monitored by the flow calibrator in the entrance section.
2.3. Test procedure
The hollow physical mouth/throat model was used to study dry and humid conditions, with and without holding aerosol within the model (). The two humidity conditions were created by performing experiments with or without wetting the cotton gauze within the airway walls in the model. Wetting the cotton gauze increased the relative humidity in the model from ambient conditions (RH < 50%) to humid conditions like those in a human mouth and throat (RH > 95%) (Mansour et al. Citation2020). As previously described, mouth hold is created by cutting off the flow through the model at the end of the puff using the switch valve on the exit vacuum line. As noted above, the hollow physical mouth/throat model is kept in an oven to maintain temperature at 37 °C ± 5% to simulate body temperature.
Table 2. Combinations of the experimental test conditions. All experiments were carried out at 37 C with 55 ml puff volume and 3 s puff duration.
Once the system was equilibrated with the temperature, relative humidity and flows rates confirmed, the ENDS puffs were generated by toggling the 3–way valve so air was drawn through the e-cigarette, rather than the flush airline, for a period of 3 s. Following the 3 s puff on the e-cigarette the valve was either switched back to the flush air flow (for the no hold case) or the flow was cut off using the exit valve for 3 s to simulate the mouth hold and then switched to the flush air. The flush air was on for the entire 8 s intra-puff interval. Preliminary investigations showed an 8 s flush was sufficient to clear the model. For the mouth hold conditions, the interval between ENDS puffs is 11 s, since a 3 s hold is added in addition to the 8 s flush.
For each test condition, a minimum of three ENDS cartridges were evaluated. Each measurement consisted of three (3) replicate collections from each ENDS cartridge. For the gravimetric analysis each replicate consisted of five (5) 55 mL puffs of a 3 s puff duration and an 8 s interval between puffs. For the chemical analysis, a single 55 mL puff 3 s puff duration was collected followed by an 8 s flush of the model. A 55 mL, 3 s puff corresponds to a flowrate of 1.1 L/min which was controlled by the exit section of the experimental setup. The ENDS cartridge was connected to a fully charged battery for each sample collection.
To ensure that the hollow physical model was at the desired temperature range it was placed in the oven for 2–3 h prior to the start of measurements. With a wetted wall the relative humidity within the mouth/throat model was >95%. This relative humidity could be maintained for at least 15 min, which allowed enough time to conduct measurements. If the relative humidity dropped below 90% experiments were stopped and the model was removed from the oven, disassembled, rewetted, reassembled and equilibrated in the oven prior to continuing measurements.
Prior to the aerosol sampling, the ENDS was activated for three puffs to warm the ENDS heater to reach its steady-state operating conditions. Before collecting the samples at the exit of the hollow physical model, the effluent aerosol from the e-cigarette was collected using the same puff generation system and sampling train, but without the hollow physical mouth/throat model. These samples are referred to as the entrance or “upstream” aerosol that would be entering the hollow physical model inlet, . Samples of aerosol that have traveled through the hollow physical model and collected at the exit through the outlet will be referred as the “downstream.”
2.4. Gravimetric analysis
Gravimetric analysis was conducted using a digital scale (Model AX205DR, Mettler-Toledo LLC, OH, US) to determine the mass change of a 44 mm Cambridge filter pad (Borgwaldt-KC, Hamburg, Germany) pre- and post- aerosol collection. The gravimetric sample collection replicates consisted of 5 puff collections at the entrance (upstream) and exit (downstream) of the model. The % mass change was used to find the average and standard deviations of the % mass change for each test condition. This procedure was used because there is some deviation in deliveries between the e-cigarette cartridges and it is more accurate to calculate the % mass change for each used cartridge individually.
2.5. Chemical analysis (calibration samples preparation and instrumentation)
The combination of the Cambridge filter pad and SKCtube was used to ensure both the particulate and vapor phase of the aerosol were completely collected for analysis. The replicate collection for chemical analysis consisted of collecting only one puff for both the entrance (upstream) and exit (downstream) samples. Most of the aerosol mass was collected on the Cambridge filter pad and only a small amount of aerosol (likely only the vapor phase) passed through the filter and was collected in the SKC. After the sampling process the Cambridge filter pad and SKC tube were combined and extracted with 2-propanol containing Carvone as internal standard by shaking at high speed for 30 min.
The Cambridge filter pad/SKC tube extract was analyzed for PG, GLY and nicotine content using a Agilent GC (6890)/MS (5973) system (Agilent Technologies Inc., Santa Clara, CA, US), with an Agilent J&W DB-WAXetr capillary column (30 m, 0.25 mm inner diameter, 0.25 µm thickness) and ChemStation software (Agilent, Santa Clara, CA, USA, version E.02.02.1431) for data acquisition and analysis. To briefly summarize the GC-MS method: Helium was used as the carrier gas under the constant flowrate of 1 ml/min. The initial temperature of the column was set at 40 °C for a period of 3 min, followed by temperature ramp of 15 °C/min to 240 °C. The temperature of injection port was set at 230 °C. A standard 1 µL sample was injected in split-less mode. The MS detection used 70 eV electron energy. The MS transfer line, MS source and MS Quad temperatures were set at 260 °C, 230 °C, and 150 °C, respectively. Selected ion monitoring (SIM) was applied for the data acquisition and the quantification was carried out by extraction of the total ion count obtained at the retention time of the measured compounds for propylene glycol 12.8 ± 0.3 min, nicotine 17.8 ± 0.3 min, and glycerol 21.4 ± 0.3 min. The monitored ions for propylene glycol were m/z 45 and 61; m/z 84, 133, and 162 for nicotine; and m/z 43, 61 for glycerol. Quantification of the chemical analysis was carried out using a calibration curve developed for each compound.
PG, GLY and nicotine calibration standards were prepared at 6 concentrations. 2-propanol 99.9% (Fisher Chemical Fair Lawn, NJ, US), Carvone 99% (Sigma Aldrich, St. Louis, US), propylene glycol 99.5% (Lyondell Chemical Company, Houston, TX, USA), glycerin 99.7% (Acidchem USA Inc., Rochelle Park, NJ, US) and nicotine 99% (BGP Healthcare PVT. Ltd., Gujarat, India) were used to prepare the standards. Extraction solution was made with Carvone as internal standard in 2-propanol at a concentration of 34.9 µg/ml. Then extraction solution was then used to prepare the six calibration standards for each compound with concentrations ranging from 8.1 to 65.0 µg/ml for nicotine, 20.5 to 82.0 µg/ml for propylene glycol and 14.0 to 89.6 µg/ml for glycerin.
3. Results
3.1. Gravimetric analysis
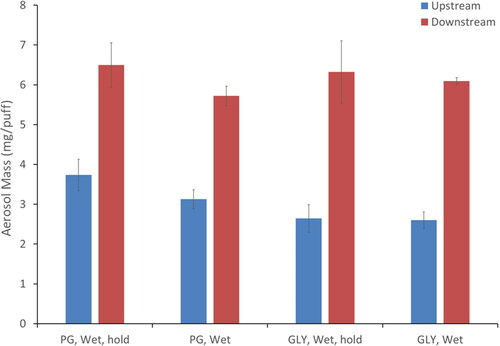
Two of the e-liquid formulations were single component aerosols of PG or GLY generated from e-liquids #1 and #2 () under wet conditions with and without mouth hold. The effluent aerosol mass delivered upstream at inlet of physical model entrance by the ENDS is lower for GLY (∼2.6 mg/puff) than for PG (∼3.2 mg/puff). Despite the difference in the aerosol mass upstream of the physical model, total aerosol mass downstream which includes hygroscopic growth due to water uptake at the mouth/throat physical model outlet exit is similar (; ∼6 mg/puff). The aerosol mass is slightly higher for the conditions with mouth hold compared to no mouth hold, however the differences were not statistically significant.
Figure 4. Comparison of the aerosol mass delivered by the e-cigarette (entrance/upstream) and after passing through the mouth/throat model (exit/downstream) for single component Gly (e-liquid #1) and PG (e-liquid #2) mixture.
A better assessment of the relative importance of hygroscopic growth and evaporation can be found in the results of e-liquid #3 (). A slight loss of aerosol mass is apparent in comparing entrance (upstream) vs. exit (downstream) measurements for the dry wall conditions, while the wet wall conditions exhibit an obvious increase in mass. Measurements from each ENDS device were repeatable across all devices with the average aerosol mass delivery for all devices of 2.73 ± .21 mg per puff.
Figure 5. Comparison of entrance (upstream) v. exit (downstream) deliveries for a PG/GLY/Nicotine mixture e-liquid #3.
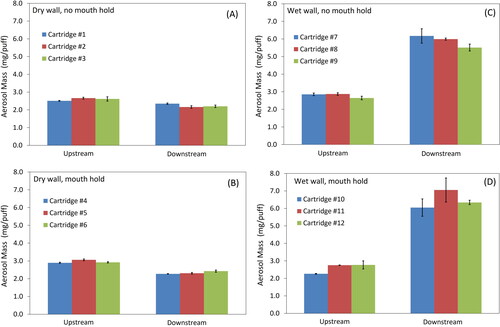
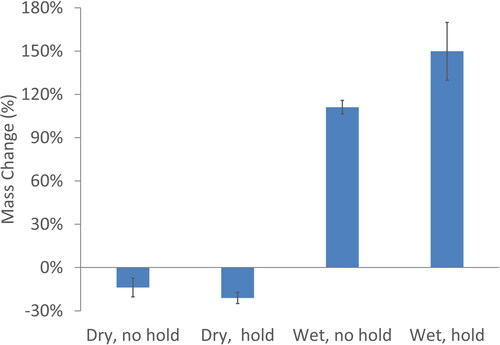
The results from the gravimetric measurements are summarized in , which presents the % mass change in aerosol between the entrance (upstream) and exit (downstream). It is now easier to quantitate and compare the observations from . With the dry wall test condition, there is 15–20% aerosol mass loss within physical model for both with and without mouth hold. With the wet wall test condition, a t-test was performed and a p-value of 0.03 shows that there is a statistical significant increase in the aerosol mass between the entrance (upstream) and exit (downstream) of the physical model, which corresponds to hygroscopic growth of the droplets as the aerosol transits through the mouth-throat region. In the humid environment of the wet wall condition, it is expected that the hygroscopic e-liquid mixture will absorb water. With mouth hold, aerosol mass increases since more time is allowed for hygroscopic growth.
Figure 6. Mass Change through the model for e-liquid #3 for the 4 conditions studied.
3.2. Chemical analysis
Chemical analysis of the aerosol exiting (downstream) shows that nearly 100% of the glycerol in e-liquid #3 mixture travels through the hollow physical model, while only approximately 60–80% of the propylene glycol and approximately 45–70% of the nicotine travels through the model. Thus, propylene glycol and nicotine have high deposition efficiencies within the model than glycerin.
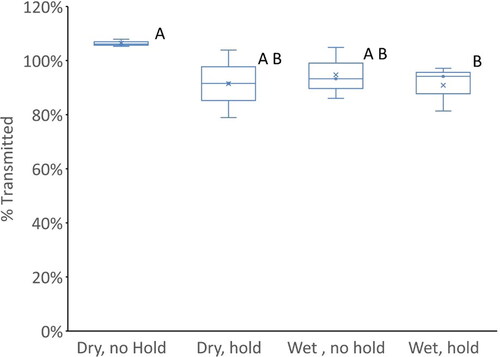
Looking at the delivery of GLY as shown in , it is apparent that nearly all the GLY is retained in the particles and transmitted through the model. A more detailed look at the transmission of GLY at tested conditions is shown in using a typical Box and Whisker plot. Statistically significant groupings established with 2 sample t-tests are represented by the letters A and B. It is evident that only the wet with mouth hold condition is statistically different from the dry with no mouth hold condition. However, the dry with mouth hold and both wet with and without mouth hold conditions have mean transmissions below 95% and are not statistically different from each other. This suggests while in the dry with no hold condition, the deposition may be minimal, it may increase with mouth hold. Mouth hold may influence deposition by increasing the time for sedimentation or increasing impaction due to rapid accelerations when inhalation starts at the end of the hold period. For wet conditions, hygroscopic growth results in larger particles that are more likely to deposit by either impaction or sedimentation. That the wet with mouth hold condition is the one that is furthest from the dry condition fits with these mechanisms, since it is the one condition where both mechanisms apply.
Figure 7. Comparison of the aerosol composition changes for the 4 conditions studied.
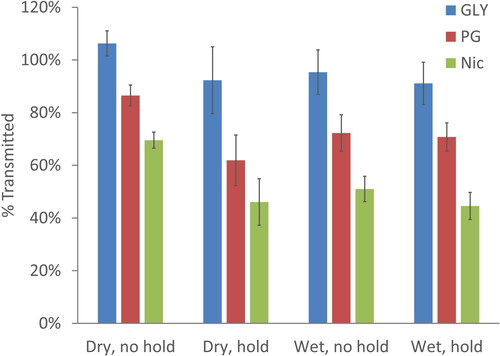
Figure 8. Box and Whisker plot comparing glycerol transmitted through the model at 4 different conditions. The letters represent statically similar groupings based on 2 sample t-tests.
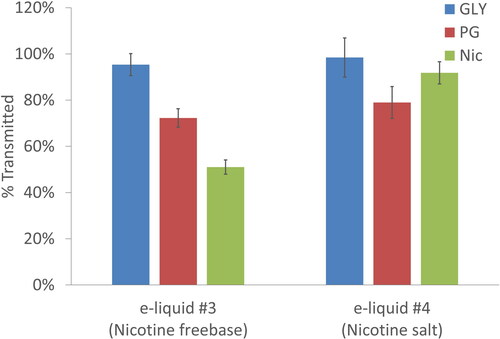
compares the results for a free base nicotine e-liquid formulation (e-liquid #3) with the results for the nicotine salt solution (e-liquid #4) for the wet wall (without mouth hold) condition. Although, glycerol and propylene glycol in e-liquid formulation #4 behave similar to what was observed in e-liquid formulation #3, nicotine mass loss was statistically less (t-test p-value ≪ 0.001) for e-liquid #4 with nicotine salt solution. This suggests that as expected, protonating the nicotine by the formation of a nicotine salt reduces nicotine volatility and it’s evaporation rate. Less volatile nicotine remaining in liquid form is thus able to transit further down airways.
Figure 9. Comparison of the transmission of PG, GLY & nicotine through the mouth/throat model for e-liquid #3 (nicotine freebase) and e-liquid #4 (nicotine salt).
4. Discussion
Four different conditions were studied with the mouth/throat model. As presented in these included dry wall, dry wall with mouth hold, wet wall and wet wall with mouth hold. While the wet wall and wet wall with mouth hold conditions come closest to replicating the humid conditions for inhalation of e-cigarette aerosol there is value in examining all four of the conditions to understand the dynamics of the aerosol during inhalation. The comparison of wet and dry conditions allows for the investigation of deposition and evaporation with and without hygroscopic growth. Addition of mouth hold allows for the study of time dependent role of these processes. One limitation of the current physical model is that it is a fixed wall with an initial volume of “clean” air that the incoming aerosol will mix with. A real mouth would be mostly void of initial air volume as it would expand from near zero volume to final volume as it expands during inhalation. The effect of aerosol mixing with clean air is something that was not considered in the current study.
4.1. Deposition
It is difficult to distinguish the mechanisms to account for the loss in mass from aerosol of semi-volatile components such as those studied in this report. The primary mechanisms are likely to be deposition and evaporation. Typically, for studying the deposition of semi-volatile aerosols a tracer compound is used. A tracer compound is a nonvolatile or low volatility component of the aerosol which if lost from the aerosol could only have been removed by physical deposition of the particles. GLY is the least volatile component of the aerosols studied in these experiments. The partial pressure of GLY at 37 °C is less than 0.01 Pa, therefore GLY is a reasonable tracer for deposition. Nearly 100% transmission of GLY suggests that particle deposition is not an important mechanism for aerosol mass loss in the mouth and throat, which is a reasonable conclusion as e-cigarette aerosols have been shown to have mass median aerodynamic diameters on the order of 1 micron, well within the respirable range (Oldham et al. Citation2018; Kane and Li Citation2021). With mouth hold or under the wet wall conditions, deposition of GLY was observed to be higher to a small degree. These marginal increase in deposition could result from an increase in time for deposition with the mouth hold condition (with adding mouth hold) or deposition of larger particles due to hygroscopic growth in the wet wall condition.
Results showed that aerosol mass generated by the ENDS is lower for GLY (∼2.6 mg/puff) than for PG (∼3.2 mg/puff) e-liquid formulation. Since the same power is used to vaporize both liquids, it is hypothesized that more energy is required to vaporize the less volatile GLY compared to PG. Measuring what is deposited in the mouth/throat model could be of interest in establishing a mass balance. This could be accomplished by extracting the gauze from the inside of the mouth/throat model and conducting a chemical analysis of the extraction solution. However, this analysis was not conducted so while a mass balance is assumed it has not been confirmed.
4.2. Evaporation
Having established that aerosol mass loss due to particle deposition is minimal, one can deduce that observed losses of PG and nicotine are due to their evaporation and deposition in the vapor phase. Differential loss in PG and Nicotine shown in is suggestive of evaporation. PG is about 500 times more volatile then GLY, so it is expected to be lost at a higher rate than GLY. PG and nicotine are relatively close in vapor pressure (with PG being the more volatile of the two) however, nicotine is lost at higher rates than PG. This is likely due to the evaporation rate of nicotine in the solution being higher than expected for an ideal solution. summarizes the losses of PG and nicotine for all four studied conditions based on the averages presented in .
Table 3. Evaporative losses for PG and Nicotine for all four study conditions.
From results in , it is apparent that, evaporation, in the presence of hygroscopic growth leads to results that are not easily predictable. For example, the evaporation of PG increases from 13.5% for the dry condition with no mouth hold to 30.4% for the dry condition with mouth hold, however in wet conditions the increased evaporation with mouth hold is not observed. In the dry conditions, increased evaporation may be expected given the additional time for evaporation. The evaporation process itself will quickly result in an equilibrium with the local environment. However, since the gauze walls serve as a sink for the vapor phase components, evaporation will continue while the aerosol remains in the mouth/throat model. A similar behavior is not observed in wet conditions is likely due to the dilution of PG by water condensing on the particles that lowers its volatility. With nicotine a similar trend is observed, evaporation increases with mouth hold in the dry conditions, but not in the wet conditions. Nicotine is known to not form an ideal solution with water (Banyasz, Citation1999). This again suggests the importance of the interaction of semi-volatile aerosol components and the dependence of their evaporation rates on the composition of the particles at any given time.
4.3. Hygroscopic growth
Once the losses due to deposition and evaporation have been determined it is possible to determine the fraction of water that the particles have absorbed. Using the gravimetric measurements for the given conditions and assuming mass balance, one arrives at the equation.
where mx refers to the mass corresponding to mechanism x and the subscripts are as follows. E is for the aerosol mass emitted from the e-cigarette, referred to as the entrance (upstream) aerosol, T is the aerosol transmitted through the model exit (downstream), D refers to the aerosol lost in the model via particle deposition, V is the aerosol lost as vapor by evaporation and W is for the water gained by the aerosol via hygroscopic growth.
The calculations were conducted in terms of the percent of the aerosol mass emitted from the e-cigarette, based on the average values for the tested condition (). In the dry conditions there was a 7.5% water loss from the particles, however, in the wet conditions the particles more than double their mass as the aerosol was transported through the model. It is worth noting that preliminary experiments demonstrated that with wet conditions there was no measurable mass change of the Cambridge filter pad at the exit (downstream) of the model block after collections made without aerosol. This suggests that all the mass increase in condition with mouth hold was due to increase in water content of the aerosol in particulate phase. This is because the particles have not reached equilibrium with the environment. At a relative humidity of 95% the water content of the PG/GLY mixture is expected to be on the order of 600% water at equilibrium (Bell and Labuza Citation2000).
Table 4. Calculation of mass water uptake by the aerosol for the 4 study conditions.
The water uptake quickly doubles the mass of the aerosol as it passes through the wet mouth/throat model with no mouth hold but increases its mass by only an additional 45% during the 3 s mouth hold, which suggests that the aerosol may be depleting the nearly saturated environment as it passes through the physical model and the mouth hold provides additional time for water to evaporate from the wet wall of the physical model and be absorbed into the environment. At 95% relative humidity the mass of water in the vapor phase within the 69 ml physical model is ∼9 μg, whereas the mass increase of the aerosol due to the water was on the order of mg. This suggest that even in wet condition without mouth hold there is considerable transfer of water from the walls of the physical model into the particles. With this simple system and gravimetric analysis, the importance of hygroscopic growth for these ENDS aerosols is obvious, however it is difficult to make any assessment about the relative growth rates or the presence of evaporation.
4.4. Estimation of size change
The particle size distribution is an important aerosol property. It is particularly important to understanding the deposition of particles as they are transported through the respiratory tract. In that light, several attempts have been made to measure the particle size at the exit (downstream) of the model. These include using optical measurements such as the SprayTech and a multiwavelength light scatter method described by Dunkhorst et al. (Citation2018). These methods turned out not to be suitable, due to a number of reasons, such as the aerosol being at the limit of the operational size range of the SprayTech and the condensation in the optical chamber of the Dunkhorst device. Since measurements could not be made, the particle size changes can be estimated from available data. If the initial size and concentration of the aerosol are known, then the final size of the aerosol can be determined by assuming the number concentration of the particles remains constant and the diameter only changes by mass loss or increase of the particles due to evaporation or hygroscopic growth. In this case the final particle size can be determined from equation,
where, Dfinal is the diameter of the particles at the exit (downstream) of the mouth/throat model,
is the density of the particle and m_pfinal is the mass per particle at the exit (downstream) of the model. m_pfinal can be found from the aerosol mass at the exit (downstream) of the model (mfinal), the number concentration of the original aerosol ([N]) and the puff volume (V)
While the particle size of the emitted ENDS aerosol was not measured for this project the literature contains several reports for particle size distributions from similar e-cigarette devices. Oldham et al. (Citation2018) and Kane and Li (Citation2021) measured the size distributions for aerosols from devices similar to those used here and puffed with similar conditions to those used in the model. Oldham et al. (Citation2018) reported Mass Median Aerodynamic Diameter (MMADs) and Geometric Standard Deviation (GSDs) in the range of 0.9–1.2 μm and 1.7–2.2 respectively. For this analysis an MMAD of 1.0 μm and GSD of 1.8 were chosen as typical of the range of expected values. Assuming a log normal size distribution these values can be used to calculate the count median diameter and diameter of average mass using the appropriate Hatch-Choate conversions (Hinds Citation1999, 97–104). The number concentration is then calculated from the diameter of average mass and the entrance aerosol mass. The count median diameter and number concentration are then used in the above equations to calculate Dfinal, which is the diameter of average mass at the exit (downstream) of the mouth/throat model. The MMAD can be determined from the diameter of average mass and GSD by again using the appropriate Hatch-Choate conversions. shows the results of the particle size analysis.
Table 5. Calculated exit (downstream) particle size inputs and results. Calculated diameters maybe underestimated due to omission of consideration of coagulation.
The particle size remains essentially unchanged for the dry conditions, with a 3% reduction in diameter for the dry conditions with mouth hold. However, for the wet conditions (both without and with mouth hold) substantial growth in the particle diameter is observed. It is not surprising to see growth of these hygroscopic aerosols in a humid environment. However, the model is helpful in determining the amount and rate at which the aerosols grow. This is difficult to predict theoretically, because it depends on the rate at which the vapor is transferred from the walls, the rate of accommodation of water by the particles, and the distribution of the water vapor through the mouth all of which may vary over time due to changes in the local environment. While it is possible to model these processes, complications arise due to different length and time scales required for testing. Although, these models can be developed, it is necessary to validate them by testing against a well-controlled system, such as mouth/throat model described here.
4.5. Link to deposition modeling
As mentioned above, much of the value of physical models such as those described here comes from using it to complement computation models to understand and validate interpretation of the complicated aerosol dynamics. Results from this experimental study were compared to the computational modeling results that were generated for this physical model. A Eulerian aerosol deposition model was developed for the geometry studied here by Pourhashem et al. (Citation2020). The details and assumptions of the model can be found in Pourhashem et al. (Citation2020). The model accounts for all primary phenomena that influence the dynamics of a phase changing aerosol including particle-air interface mass transfer for water and other constituents in the aerosol. The particles were assumed to be in thermodynamic equilibrium with the humid environment in the oral cavity, meaning that the time needed for the constituents to cross the particle-air interface is much smaller than the flow time. This assumption has greatly simplified the computational work and found to be a valid assumption due to high mass and heat transfer coefficients at submicron particle surface.
The computation model was run for one case and results are shown in , along with experimental data. The case included the mass of constituents collected at the exit (downstream) after a 3s puff, followed by 8s washout with ambient air. Compared to the physical model, the Eulerian model overestimates the deposition of GLY and underestimates the loss of nicotine. The model, however, validates the assumption made earlier that GLY can be used as a tracer compound for particle deposition by showing that vapor phase loss of GLY is minimal. Modeling results also indicate most of the PG and nicotine loss from the aerosol is due to vapor phase deposition on the surfaces, with particle deposition being only a small fraction. The differences between the computational model predictions and the measured data may be attributed to several factors. The computational model assumes zero concentration of constituent on the surface as a boundary condition. This assumption does not allow for the re-evaporation of constituents from the surface during the washout time, which is captured in the experiment. Another source of discrepancy is the vapor-particle partitioning (or the activity coefficient), of the individual constituents. Since vapor phase absorption is the major contributor to total deposition, the computational model could result in a better match with experiment by correction of the activity coefficients.
Table 6. Comparison of the physical mouth/throat models results to the predictions of Eulerian model of the system for the wet condition (no mouth hold).
5. Conclusions
This report presents a physical model of the respiratory tract with a realistic geometry to study complex aerosol dynamics at near physiological conditions. The model is based on the geometry of a human mouth and throat. It is maintained at body temperature in a temperature-controlled chamber and has walls that can be wetted to simulate the humid conditions of the respiratory tract. A method has been developed to study the aerosol dynamics that occur within the respiratory tract, including deposition, evaporation, and hygroscopic growth by comparing different model conditions. The method has been applied to study the dynamics of multi-component aerosols produced by ENDS. Transport of these aerosols through the mouth and throat is important to the vaping experience.
With the current model set up it was apparent that particle deposition in the mouth and throat region was low, however there was significant mass loss from the aerosol by evaporation of PG and nicotine. These results were confirmed by a Eulerian model of aerosol transport through the same airway geometry published separately (Pourhashem et al. Citation2020). The physical model also showed the importance of hygroscopic growth. While transiting through the mouth and throat the ENDS aerosol more than doubled its mass in the humidified conditions. The aerosol did not reach equilibrium with the initial water concentration in the model (>95%), but it did take up more water initially determined to be in the vapor phase. This shows the importance of water transport from the walls of the respiratory tract. Furthermore, it was calculated that the water uptake increased the particle diameter by approximately 30–40%, which would need to be accounted from in deposition simulations within the lungs. The model results also showed that >40% of the nicotine is lost to evaporation while transiting through the mouth and throat region. This indicated that the nicotine evaporation rate deviated from that of an ideal solution and suggested it was less soluble in the aerosol droplets as they gained water. It was shown that nicotine evaporation rate could be lowered by adding an acid mixture to the e-liquid formulation. This resulted in a protonated form of nicotine with a lower activity.
Several improvements to the current model and method are possible. While the current model has been limited to the mouth and throat region it is possible to extend this method further into the respiratory tract, similar to what has been done by Nordlund et al. (Citation2017) and Asgari, et al. (Citation2019). The method is easily adapted to other aerosol sources and respiratory tract geometries. Additional analytical measurements could be made, for example, the interior of the model could be analyzed to determine what was deposited directly rather than inferring it. Physical models can provide useful insight into the evolution of complex aerosol systems within the respiratory tract, when complemented by computational models.
Disclosure statement
The authors declare that they have no known competing financial interests or personal relationships that could have appeared to influence the work reported in this paper.
References
- Asgari, M., F. Lucci, J. Bialek, B. Dunan, G. Andreatta, R. Smajda, S. Lani, N. Blondiaux, S. Majeed, S. Steiner, et al. 2019. Development of a realistic human respiratory tract cast representing physiological thermal conditions. Aerosol Sci. Technol. 53 (8):860–870. doi: 10.1080/02786826.2019.1612839.
- Asgharian, B., O. T. Price, C. U. Yurteri, C. Dickens, and J. McAughey. 2014. Component-specific, cigarette particle deposition modeling in the human respiratory tract. Inhal. Toxicol. 26 (1):36–47. doi: 10.3109/08958378.2013.851305.
- Asgharian, B., A. A. Rostami, O. T. Price, and Y. B. Pithawalla. 2018a. Regional deposition of inhaled aerosol constituents from Electronic Nicotine Delivery Systems (ENDS) in the respiratory tract. J. Aerosol Sci. 126:7–20. doi: 10.1016/j.jaerosci.2018.08.006.
- Asgharian, B., O. T. Price, A. A. Rostami, and Y. B. Pithawalla. 2018b. Deposition of inhaled electronic cigarette aerosol in the human oral cavity. J. Aerosol Sci. 116:34–47. doi: 10.1016/j.jaerosci.2017.11.014.
- Banyasz, J. L. III 1999. The physical chemistry of nicotine, analytical determination of nicotine and related compounds and their metabolites, ed. J. W. Gorrod, and P. Jacob, 149–190. New York: Elsevier.
- Beeckmans, J. M. 1965. The deposition of aerosols in the respiratory tract: I. Mathematical analysis and comparison with experimental data. Can. J. Physiol. Pharmacol. 43 (1):157–172. doi: 10.1139/y65-015.
- Bell, L. N., and T. P. Labuza. 2000. Moisture sorption: Practical aspects of isotherm measurement and use, 2nd ed., 117. St. Paul, MN: American Association of Cereal Chemists.
- Bergström, M., A. Nordberg, E. Lunell, G. Antoni, and B. Långström. 1995. Regional deposition of inhaled 11C‐nicotine vapor in the human airway as visualized by positron emission tomography. Clin. Pharmacol. Ther. 57 (3):309–317. doi: 10.1016/0009-9236(95)90156-6.
- Broday, D. M., and R. Robinson. 2003. Application of cloud dynamics to dosimetry of cigarette smoke particles in the lungs. Aerosol Sci. Technol. 37 (6):510–27. doi: 10.1080/02786820300969.
- Dunkhorst, W., P. Lipowicz, W. Li, C. Hux, Q. Wang, and W. Koch. 2018. In-situ characterization of e-cigarette aerosols by 90°-light scattering of polarized light. Aerosol Sci. Technol. 52 (7):717–724. doi: 10.1080/02786826.2018.1464646.
- Cheng, Y. S., Y. Zhou, and B. T. Chen. 1999. Particle deposition in a cast of human oral airways. Aerosol Sci. Technol. 31 (4):286–300. doi: 10.1080/027868299304165.
- Cheng, Y. S., Y. Yamada, H. C. Yeh, and D. L. Swift. 1988. Diffusional deposition of ultrafine aerosols in a human nasal cast. J. Aerosol Sci. 19 (6):741–751. doi: 10.1016/0021-8502(88)90009-2.
- Davies, C. N. 1961. A formalized anatomy of the human respiratory tract. Inhaled Particles Vapours (1): 82–87.
- Feng, S., S. E. Plunkett, K. Lam, S. Kapur, R. Muhammad, Y. Jin, M. Zimmermann, P. Mendes, R. Kinser, and H. J. Roethig. 2007. A new method for estimating the retention of selected smoke constituents in the respiratory tract of smokers during cigarette smoking. Inhal. Toxicol. 19 (2):169–179. doi: 10.1080/08958370601052022.
- Fuoco, F. C., G. Buonanno, L. Stabile, and P. Vigo. 2014. Influential parameters on particle concentration and size distribution in the mainstream of e-cigarettes. Environ. Pollut. 184:523–529. Epub 2013 Oct 27. PMID: 24172659. doi: 10.1016/j.envpol.2013.10.010.
- Gholap, V. V., L. Kosmider, L. Golshahi, and M. S. Halquist. 2020. Nicotine forms: Why and how do they matter in nicotine delivery from electronic cigarettes? Expert Opin. Drug Deliv. 17 (12):1727–1736. Epub 2020 Sep 17. PMID: 32842785; PMCID: PMC9361466. doi: 10.1080/17425247.2020.1814736.
- Gradon, L., and C. P. Yu. 1989. Diffusional particle deposition in the human nose and mouth. Aerosol Sci. Technol. 11 (3):213–220. doi: 10.1080/02786828908959314.
- Guilmette, R. A., Y. S. Cheng, H. C. Yeh, and D. L. Swift. 1994. Deposition of 0.005-12 micrometer monodisperse particles in a computer-milled, MRI-based nasal airway replica. Inhal. Toxicol. 6 (sup1):395–399. doi: 10.1080/10917691.1994.12290217.
- Horsfield, K., G. Dart, D. E. Olson, G. F. Filley, and G. Cumming. 1971. Models of the human bronchial tree. J. Appl. Physiol. 31 (2):207–217. doi: 10.1152/jappl.1971.31.2.207.
- Hinds, W. C. 1999. Aerosol technology: Properties, behavior, and measurement of airborne particles. 2nd ed. New York: Wiley.
- Hofmann, W. 2011. Modelling inhaled particle deposition in the human lung—A review. J. Aerosol Sci. 42 (10):693–724. doi: 10.1016/j.jaerosci.2011.05.007.
- Ingebrethsen, B. J., S. L. Alderman, and B. Ademe. 2011. Coagulation of mainstream cigarette smoke in the mouth during puffing and inhalation. Aerosol Sci. Technol. 45 (12):1422–1428. doi: 10.1080/02786826.2011.596863.
- Kane, D. B., B. Asgharian, O. T. Price, A. Rostami, and M. J. Oldham. 2010. Effect of smoking parameters on the particle size distribution and predicted airway deposition of mainstream cigarette smoke. Inhal. Toxicol. 22 (3):199–209. doi: 10.3109/08958370903161224.
- Kane, D. B., and W. Li. 2021. Particle size measurement of electronic cigarette aerosol with a cascade impactor. Aerosol Sci. Technol. 55 (2):205–214. doi: 10.1080/02786826.2020.1849536.
- Koblinger, L., and W. Hofmann. 1990. Monte Carlo modeling of aerosol deposition in human lungs. Part I: Simulation of particle transport in a stochastic lung structure. J. Aerosol Sci. 21 (5):661–674. doi: 10.1016/0021-8502(90)90121-D.
- Leventhal, A. M., D. R. Madden, N. Peraza, S. J. Schiff, L. Lebovitz, L. Whitted, J. Barrington-Trimis, T. B. Mason, M. K. Anderson, A. P. Tackett, et al. 2021. Effect of exposure to e-cigarettes with salt vs free-base nicotine on the appeal and sensory experience of vaping: A randomized clinical trial. JAMA Netw. Open. 4 (1):e2032757. doi: 10.1001/jamanetworkopen.2020.32757.
- Li, A., and G. Ahmadi. 1995. Computer simulation of particle deposition in the upper tracheobronchial tree. Aerosol Sci. Technol. 23 (2):201–223. doi: 10.1080/02786829508965304.
- Worth Longest, P., and J. Xi. 2008. Condensational growth may contribute to the enhanced deposition of cigarette smoke particles in the upper respiratory tract. Aerosol Sci. Technol. 42 (8):579–602. doi: 10.1080/02786820802232964.
- Mansour, E., R. Vishinkin, S. Rihet, W. Saliba, F. Fish, P. Sarfati, and H. Haick. 2020. Measurement of temperature and relative humidity in exhaled breath. Sens. Actuators B. 304:127371. ISSN 0925-4005, doi: 10.1016/j.snb.2019.127371.
- Muller, W. J., G. D. Hess, and P. W. Scherer. 1990. A model of cigarette smoke particle deposition. Am. Ind. Hyg. Assoc. J. 51 (5):245–256. doi: 10.1080/15298669091369600.
- Nordlund, M., M. Belka, A. K. Kuczaj, F. Lizal, J. Jedelsky, J. Elcner, M. Jicha, Y. Sauser, S. Le Bouhellec, S. Cosandey, et al. 2017. Multicomponent aerosol particle deposition in a realistic cast of the human upper respiratory tract. Inhal. Toxicol. 29 (3):113–125. doi: 10.1080/08958378.2017.1315196.
- Oldham, M. J., K. A. Wagner, I. G. Gilman, J. B. Beach, J. Liu, A. A. Rostami, and M. A. Sarkar. 2017. Development/verification of methods for measurement of exhaled breath and environmental e-vapor product aerosol. Regul. Toxicol. Pharmacol. 85:55–63. doi: 10.1016/j.yrtph.2017.01.006.
- Oldham, M. J., J. Zhang, M. J. Rusyniak, D. B. Kane, and W. P. Gardner. 2018. Particle size distribution of selected electronic nicotine delivery system products. Food Chem. Toxicol. 113:236–240. doi: 10.1016/j.fct.2018.01.045.
- Pattle, R. E. 1961. The retention of gases and particles in the human nose. Inhaled Particles Vap. 1:302–309.
- Pourhashem, H., M. P. Owen, N. D. Castro, and A. A. Rostami. 2020. Eulerian modeling of aerosol transport and deposition in respiratory tract under thermodynamic equilibrium condition. J. Aerosol Sci. 141:105501. doi: 10.1016/j.jaerosci.2019.105501.
- Robinson, R. J., and C. P. Yu. 2001. Deposition of cigarette smoke particles in the human respiratory tract. Aerosol Sci. Technol. 34 (2):202–215. doi: 10.1080/027868201300034844.
- Speizer, F. E., and N. R. Frank. 1966. The uptake and release of SO2 by the human nose. Arch. Environ. Health. 12 (6):725–728. doi: 10.1080/00039896.1966.10664471.
- Schiffelers, M. J. W., B. J. Blaauboer, C. F. Hendriksen, and W. E. Bakker. 2012. Regulatory acceptance and use of 3R models: A multilevel perspective. ALTEX-Alternat. Anim. Exp. 29 (3):287–300. doi: 10.14573/altex.2012.3.287.
- Taulbee, D. B., and C. P. Yu. 1975. A theory of aerosol deposition in the human respiratory tract. J. Appl. Physiol. 38 (1):77–85. doi: 10.1152/jappl.1975.38.1.77.
- Weibel, E. R. 1965/1963. Morphometry of the human lung. Heidelberg, Germany; New York: Springer-Verlag.