
 ?Mathematical formulae have been encoded as MathML and are displayed in this HTML version using MathJax in order to improve their display. Uncheck the box to turn MathJax off. This feature requires Javascript. Click on a formula to zoom.
Abstract
Transmission of an airborne disease can occur when an individual exhales respiratory particles that contain infectious pathogens. Surgical face masks are often used to reduce the amount of respiratory aerosol emitted into the environment by an individual while also lowering the concentration of particles the individual inhales. Respiratory aerosol generation is activity-dependent with high person-to-person variability. Moreover, mask fit differs among people. Here, we measure the efficacy of surgical masks (EN14683 Type IIR) in reducing both aerosol (0.3 − 20 µm diameter) and droplet (20 − 1000 µm diameter) emission during breathing, speaking and five speech and language therapy tasks performed by a human cohort. When participants wore a surgical face mask, measured particle number concentrations at the front of the mask were always lower than that for breathing without mitigation in place. For breathing and speaking, the through-mask filtration efficiencies were 80% and 87%, respectively, while for voice therapy tasks the through-mask filtration efficiencies ranged from 89% (“Hey!”) to 95% (/a::/). Size-dependent through-mask filtration efficiencies were high (80 – 95%) for particles 0.5 − 2 µm diameter, with masks filtering a greater fraction of larger particle sizes. For particle sizes >4 µm diameter, filtration efficiencies of surgical face masks for all tested respiratory tasks were ∼100%. Surgical face masks significantly reduced the number of particles emitted from all respiratory activities. These results have implications for developing effective mitigations for disease transmission through inhalation.
GRAPHICAL ABSTRACT
EDITOR:
Introduction
Respiratory particles are generated during activities including breathing, vocalizing, sneezing, and coughing. These particles span a wide size range, from <300 nm to >100 µm diameter (Archer et al. Citation2022; Gregson et al. Citation2021b; Harrison et al. Citation2023; Johnson et al. Citation2011; Morawska et al. Citation2009; Pöhlker et al. Citation2023). The amount of respiratory particles exhaled can vary by orders of magnitude across the human population and between activities. Size distributions, respiratory plume velocities, and particle concentrations generated depend on both the respiratory activity and (for vocalizing) its loudness (Asadi et al. Citation2019; Gregson et al. Citation2021b). Respiratory particles may carry and transmit infectious pathogens, leading to the spread of diseases by inhalation (Jones and Brosseau Citation2015), and the wearing of face masks is considered an important non-pharmaceutical intervention to reduce infection rates (Cox et al. Citation2023). Surgical face masks are often used to reduce the amount of respiratory particles emitted into the environment by an individual (Asadi et al. Citation2020; Cappa et al. Citation2021a) while also lowering the concentration of particles the individual inhales (Lee, Grinshpun, and Reponen Citation2008).
Many studies have explored the filtration efficacy of the filter medium (Chen and Willeke Citation1992; Drewnick et al. Citation2021; Lindsley et al. Citation2021; Pushpawela et al. Citation2022). However, establishing an overall filtration efficiency for a given type of face covering requires not only material filtration tests, but also evaluation of the mask fit, which determines the particle leakage around the edges (Freitag, Howell, and Jim Citation2022). Leakage is influenced by several factors, including the mask’s design, its resistance to airflow during inhalation or exhalation, and the mask’s size in relation to the wearer’s head (Schmitt and Wang Citation2022). For exhalation, the overall mask efficacy is difficult to establish because respiratory particle generation is activity-dependent and has high inter-participant variability. In addition, mask fit can vary from person to person (Asadi et al. Citation2020; Cappa et al. Citation2021a).
Mask filtration efficiency is likely to vary with respiratory activity. For instance, vocalizing generates larger particles that are expelled at a faster rate than those generated by breathing (Harrison et al. Citation2023; Johnson et al. Citation2011). Consequently, a higher fraction of particles may be filtered out by impaction onto the mask. The likelihood of such particles being filtered increases for larger particles, as these are less likely to penetrate through the mask (Schmitt and Wang Citation2022). However, with aggressive expiratory activities, the airflow, and the particles it carries, are quickly expelled by the mouth or nose. This results in high flowrates and increased pressure in the area between the mask and the wearer’s head, which may alter how the airstreams passing through the filtering part of the mask and the gaps interact (Schmitt and Wang Citation2022).
This contribution assesses the efficacy of surgical masks (EN14683 Type IIR) in reducing respiratory particle (0.3 – 1000 µm diameter) emission during breathing, speaking and five speech and language therapy tasks performed by 15 healthy individuals. These seven respiratory activities were selected from a range of tasks studied in previous work on aerosol generation from speech and language therapy activities (Saccente-Kennedy et al. Citation2022) to represent activities with different particle size distributions, particle concentrations, and flow rates. This work builds on a limited number of previous studies with human subjects that have examined the filtration efficiencies for particle size distributions from breathing and speaking (Asadi et al. Citation2020; Cappa et al. Citation2021a). In addition, measurements are performed in ultraclean orthopedic operating theaters ensuring that the attenuated particle signal measured can be unambiguously attributed to particles originating in the respiratory tract. We demonstrate that surgical face masks effectively reduce the quantity of particles released throughout all investigated activities, with efficiency varying with the task. Performing this study in a human cohort allows exploration of both through-mask efficiency and the impact of variability in mask fitting for filtering respiratory particles.
Materials and methods
Human participants
The Public Health England Research Ethics and Governance of Public Health Practice Group (PHE REGG) approved this study (R&D reference 429). Written informed consent was obtained from all participants. We recruited 15 healthy adults (8 males and 7 females), ranging in age from 29 to 63 (mean: 44.7, median: 45.0, SD: 10.6). 13 of these volunteers previously participated in our study on aerosol generation from Speech and Language Therapy (SLT-1) exercises (Saccente-Kennedy et al. Citation2022). There were also 2 additional volunteers who did not participate in the original SLT-1 study. These 15 participants are referred to as Speech and Language Therapy 2 (SLT-2) participants. Of the 15 participants, 9 were speech-language pathologists with at least one year of experience and 6 were nonprofessionals.
All participants completed a prescreening questionnaire (including age, gender, weight, height, and ethnicity) and were prescreened to ensure they were healthy, which was defined as free from cardiac, metabolic, or respiratory disease, including severe asthma and COVID-19 symptoms. All participants tested negative for COVID-19 with a lateral flow test immediately before their participation in this study.
Experimental setup
Aerosol measurements (0.3–20 µm diameter)
The experimental setup () was similar to that used in our previous studies of respiratory aerosol generation (Archer et al. Citation2022; Gregson et al. Citation2021a; Gregson et al. Citation2021b; McCarthy et al. Citation2021; Orton et al. Citation2022; Saccente-Kennedy et al. Citation2022). All measurements were carried out in a laminar flow operating theater with an ultra-clean ventilation system, which reduced the preexisting background particle number concentration in the 0.3 − 20 µm diameter size range to 0 cm−3. The extremely low background aerosol concentration allowed quantification of the small amounts of respiratory particulate matter produced from the studied activities and enabled confident attribution of detected aerosol to the participant, with aerosol concentrations returning to 0 cm−3 between activities and repetitions (). A reduction in background to zero is essential for measuring respiratory aerosol and is even more stringent when an attenuation in exhaled aerosol is to be measured. Temperature and relative humidity in the laminar flow operating theater were typically 20 °C and 45%, respectively.
Figure 1. (a) Illustration of the experimental setup for aerosol measurements and the sampling position of the participant, sampling funnels, and the tubing connected to aerosol instrumentation. (b) Continuous time series for one participant completing selected activities, i.e., speaking and humming, without and with a mask (three repetitions of each) showing particle number concentration (cm−3) measured at the front with an APS (top panel) and an OPS (middle panel) as well as on the side of the mask with an OPS (bottom panel).

Measurements were performed with an Aerodynamic Particle Sizer (APS, TSI 3321, TSI, MN, USA; particle diameters 0.5 − 20 µm) and an Optical Particle Sizer (OPS, TSI 3330, TSI, MN, USA; particle diameters 0.3 − 10 µm) sampling from custom 3D-printed funnels made of polylactic acid (1.75 mm filament) by a RAISE3D Pro2 Printer (3DGBIRE). Each funnel was 150 mm wide, 90 mm deep with ports at the neck for sampling aerosol into the APS or OPS instruments. All tubing was conductive silicone, 1 m in length (TSI 3001788, 4.83-mm inner diameter, 9.53-mm outer diameter). Care was taken to ensure the conductive tubing had minimal bends, always maintaining a ratio of the radius of curvature (rc) to the inner tube radius (rt) greater than 50. We use the terms “aerosol” or “particle” to refer to measurements using the APS and OPS instruments because the examined size range is ≪100 µm diameter and their phase is not definitively known.
The experimental protocol, shown in Table S1 and explained in detail below, was based on our previous study investigating respiratory aerosol generation from speech and language therapy exercises (Saccente-Kennedy et al. Citation2022) in which participants were instructed to perform specific tasks into a sampling funnel for a set time. We note that we previously measured absolute particle fluxes using cardiopulmonary exercise testing (CPET) masks as well as using up to four APS instruments (Archer et al. Citation2022; Gregson et al. Citation2021a; Orton et al. Citation2022). However, it was not feasible to apply these approaches in this work (e.g. it is not possible to perform CPET measurements on participants wearing surgical face masks). Minute ventilation rates for common activities like breathing and speaking are already well-known, so absolute fluxes can be estimated by scaling the data.
In this study, seated participants first performed all tasks into a funnel placed in front of their face while not wearing a surgical face mask. This sampling funnel was connected to an APS and an OPS instrument, recording aerosol concentrations concurrently. Then, participants repeated the same set of activities while wearing a fluid resistant surgical face mask with elastic ear loops (EN14683 Type IIR). While masked, an additional sampling funnel was placed on the side of the participant’s face. The additional sampling funnel was connected to an OPS instrument, which allowed assessment of particle leakage out of the side of the surgical face mask. In between activities, participants were regularly instructed to check for an adequate fit both at the sides and at the nasal bridge of the mask. The total accumulated amount of time each participant wore a surgical mask while performing all tasks was roughly 5 mins (excluding breaks).
At the beginning of each activity or repetition, participants moved forward to the funnel (). Between activities and repetitions, participants were instructed to move their head away from the sampling funnel(s) for 20 s to ensure the measured aerosol concentration reduced to background levels (0 cm−3). In between activities, participants were instructed to take a sip of water.
Seven activities were examined:
Breathing: For each repetition, a participant breathed for 15 s, inhaling through the nose, and exhaling through the mouth. A total of three repetitions were performed.
Speaking: Participants spoke the words of the “Happy Birthday” song to “dear Susan” for 15 s at 70 – 80 dBA (measured using a RS PRO RS-8852 Sound Level Meter, accuracy: ± 1.4 dB, dynamic range 30 - 130 dB, resolution 0.1 dB). Three repetitions were performed.
Speech and Language Therapy Exercises (/ȝ/ pulses, /a::/, /m::/ and tongue trills): Participants performed a series of tasks including /ȝ/ pulses, sustained phonation of /a::/ and /m::/, and voiced tongue trills. Each task had a duration of 15 s, and three repetitions were performed for each activity.
“Hey!” (/heɪ/): Participants were instructed to shout the word “Hey!” 5 times in succession. This task was repeated three times (for a total of 15 repetitions).
Respiratory droplet measurements (>20 µm diameter)
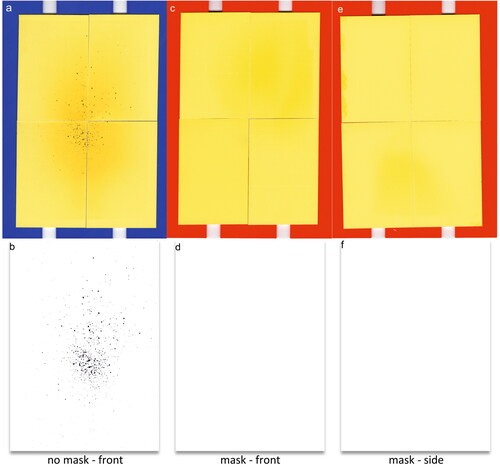
Larger respiratory droplets (>20 µm diameter) were measured from speaking and tongue trilling using the water-sensitive paper droplet deposition analysis (WSP-DDA) approach, as previously described (Harrison et al. Citation2023). Because this technique only measures liquid particles, we refer to all particles measured by this approach as droplets. Participants were instructed to perform a respiratory exercise for 60 s while facing four sheets of WSP (Pentair Hypro, 51 mm × 76 mm each arranged vertically into 2 × 2 rectangles). To ensure the WSP would capture the entire respiratory jet when participants were facing the WSP, the setup was placed 10 cm from the participant’s mouth. For masked activities, the WSP was also placed at the side of the participant’s mouth with the edge of the WSP setup 10 cm from the participant’s mouth. The gaps between the side of the face and mask were roughly aligned with the center of the WSP (so that any droplet leakage from the side of the mask could be investigated). shows the images of WSP after a participant performed unmasked () and masked (front: , side: ) tongue trills for 60 s. Respiratory droplets impacting the bromophenol coating on the WSP cause the color to change from yellow to blue. After sampling droplets, the cards were scanned at high resolution (Epson V39, 2400 dpi), binarized to black and white (), and processed using the Fiji package embedded within ImageJ software (Schindelin et al. Citation2012). Harrison et al. provides a full description of the measurement, calibration of the spot diameter to droplet diameter, and data analysis procedure (Harrison et al. Citation2023).
Figure 2. (a) Image of WSP, placed in front of the participant’s face, after experiment without a mask; (b) binarized image of (a), showing the detected respiratory droplets via image processing; (c), (e) images of WSP after experiments with a mask in front and on the side of participant’s face, respectively; (d), (f) binarized images of (c) and (e), respectively.
Calculation of through-mask particle filtration efficiency
The mean through-mask particle filtration efficiency () and pooled-participant mean through mask particle filtration efficiency (
) for a task t while wearing a surgical face mask were calculated in the following manner.
The mean particle filtration efficiency () for a task t is calculated by comparing the mean particle number concentration measured in front of the face for person p while performing mitigated (
) and unmitigated (
) task t:
(1)
(1)
Values for the mean through-mask particle filtration efficiency were calculated for each participant for each task, and the distribution of these values was examined at the cohort level.
The pooled-participant mean through-mask particle filtration efficiency () for a task t is a value calculated by comparing a mean of the particle number concentration measured in front of the face from all participants with the mitigation in place (
) and a mean of particle number concentration from all participants without the mitigation in place (
):
(2)
(2)
This aggregation across participants for a given task allowed improved quantification in filtration statistics, as it mitigates some of the substantial variations in measured number concentrations that can arise when measuring the very small amounts of respiratory aerosol generated in these tasks.
Data and statistical analysis
Both APS and OPS data were post-processed using custom-written LabVIEW software (Gregson et al. Citation2021b; McCarthy et al. Citation2021; Saccente-Kennedy et al. Citation2022). For the statistical analysis, variables were aggregated to the individual level due to different sampling regimes across studies. Arithmetic means were calculated for each participant, and geometric means were calculated for each activity (concentrations and size distributions). Paired t-tests were utilized with normally distributed data, and Wilcoxon Signed Rank Tests were utilized with data which were not normally distributed, to investigate pairwise comparisons for each task. For comparisons of the same activities between SLT-1 and SLT-2 studies (, Table S2, i.e., to compare the aerosol exhaled by individuals on two separate occasions), 13 individual participants taking part in both studies were included in the tests (12 performing all 7 tasks, and 1 performing only 5 tasks). Spearman’s rank correlation was computed to assess the relationship between SLT-1 and SLT-2 data (). Similarly, for comparisons of different activities to unmasked breathing and unmasked speaking within the same SLT-2 study (, Table S5, i.e., to compare all activities to a particular reference activity), individual participants taking part in both activities were included in the tests (14 performing all 7 tasks, and 1 performing only 5 tasks). Table S2, Table S5 and Table S7 use the same indexes to reflect the statistical significance of the difference between measurements: *** indicates p ≤ 0.001 (high statistical significance), ** indicates p ≤ 0.01 (moderate statistical significance), * indicates p ≤ 0.05 (low statistical significance), ns indicates p > 0.05 (no statistical significance).
Figure 3. Comparison between SLT-1 (Saccente-Kennedy et al. Citation2022) (non-shaded boxes, left of each pair) and SLT-2 (shaded boxes, right of each pair) cohorts. Number (a) and mass (b) concentrations of respirable particles generated from breathing, speaking “Happy Birthday”, and different speech and language therapy exercises measured by APS.
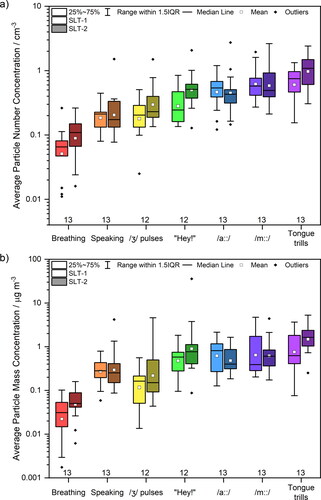
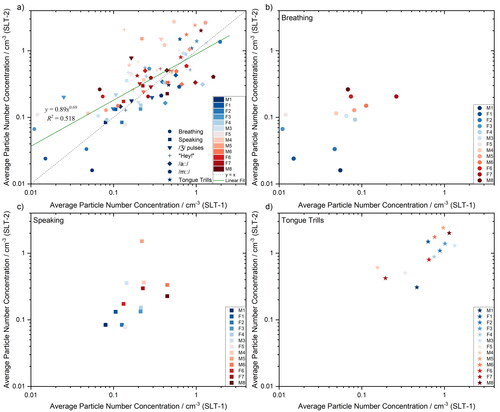
Figure 4. Comparison between average particle number concentrations measured by APS for SLT-1 (x-axis, (Saccente-Kennedy et al. Citation2022)) and SLT-2 (y-axis) studies. Data compared for each individual performing all 7 tasks (a), breathing (b), speaking (c) and tongue trills (d). Spearman’s rank correlation was computed to assess the relationship between SLT-1 and SLT-2 data: There was a positive correlation r(13) = .600* for breathing, .700** for speaking, and .736** for tongue trills (** indicates p≤0.01, * indicates p≤0.05). Other activities had no statistical correlation (p>0.05).
Results and discussion
Respiratory aerosol generation in a returning cohort
In this study, respiratory aerosol was measured from a cohort of 15 healthy adults performing a range of speech and language therapy activities without and while wearing surgical face masks. 13 members of this cohort had previously participated in a study on aerosol generation from speech and language therapy exercises (Saccente-Kennedy et al. Citation2022). We first explore the variation in aerosol generation across this group of returning SLT participants (SLT-2) relative to their first measurement session about 6 months prior (SLT-1). The activities investigated include breathing, speaking, and a set of speech and language therapy exercises: /a::/, /m::/, tongue trills, /ȝ/ pulses, and shouting “Hey!”. Only 12 of the 13 SLT-2 participants performed the /ȝ/ pulses and shouting “Hey!” activities.
compares particle number () and mass (, assuming particle density equivalent to water) concentrations for the SLT-1 (Saccente-Kennedy et al. Citation2022) and SLT-2 measurement sessions, measured using an APS. The data presented in are summarized in detail in Table S2, along with p-values from paired t-tests comparing the same activity during the SLT-1 and the SLT-2 measurement. All components of the box plots were calculated based on the logarithmically transformed data, owing to the lognormal nature of the data, but for clarity the plotted and tabular values reported are converted back to values in units of concentration.
The average particle number and mass concentrations generated by breathing (pnumber = 0.051, pmass = 0.053), speaking (0.614, 0.750), /ȝ/ pulses (0.046, 0.142), “Hey!” (0.041, 0.188), /a::/ (0.889, 0.415), /m::/ (0.771, 0.831) and tongue trills (0.003, 0.035) are broadly consistent across the two measurement events with the same cohort. For most activities, the two measurements are statistically indistinguishable (p > 0.05); /ȝ/ pulses (number), “Hey!” (number), and tongue trills (mass) have a low statistically significant difference (0.01<p ≤ 0.05); for tongue trills (number) the difference is more statistically significant (0.001<p ≤ 0.01).
compares individual mean particle number concentrations during the SLT-1 and SLT-2 measurement sessions for all tasks. The color scale (from blue to red) ranks the individuals according to the concentration of aerosol they generated when breathing in the SLT-2 study (from lowest emitter to the highest emitter). From , an individual who may be identified as a high emitter when breathing is not necessarily a high emitter across all speech and language therapy exercises. These results are in agreement with our previous studies comparing breathing and speaking (Gregson et al. Citation2021b). However, for the limited cohort size reported here, high emitters identified when breathing during SLT-1 are broadly identifiable as high emitters (p < 0.05) in the SLT-2 study, as shown in . Finally, speaking and tongue trills presented in , respectively, show high correlation significance (p < 0.01) across both measurement sessions.
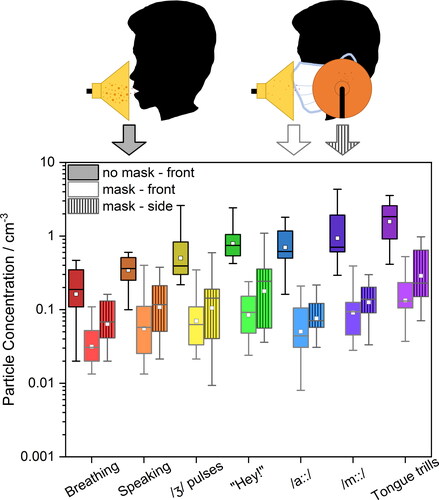
Figure 5. Number concentrations of respirable particles generated from breathing, speaking “Happy Birthday” and different voice therapy tasks measured by (a) APS and (b) OPS in front of the participant without a mask (dark grey), in front of the participant with the mask (light grey) and on the side of the mask (grey). Each color of the scattered diamond shapes represents individual participant.
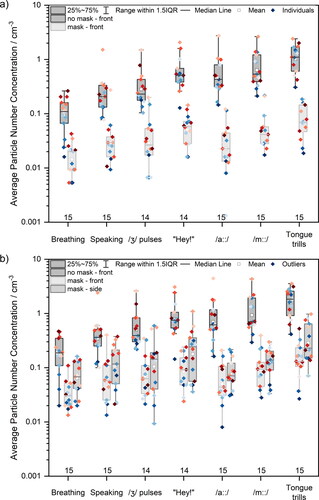
Efficacy of surgical face masks for filtering particles <20 µm diameter
The effect of surgical face masks on reducing detected particle number concentrations for all seven studied activities is shown in . reports the results of the APS measurements taken in front of the participant while not wearing (dark grey box) and wearing (light grey box) a surgical face mask. reports the results from OPS measurements both in front of the participant without a mask (dark grey box) and with a mask (light grey box) as well as at the side of the mask (medium grey box). Data points represent the average values for individual participants. The data point color scale represents the ranking of participants’ emission during breathing measured by APS (from blue to red, low to high concentration). The data presented in are summarized in Table S3, with statistical analyses presented in Table S5, whereas the data presented in are summarized in Table S4.
Consistent with previous studies, breathing generated the fewest particles (Archer et al. Citation2022; Gregson et al. Citation2021a; Gregson et al. Citation2021b; McCarthy et al. Citation2021; Saccente-Kennedy et al. Citation2022). Moreover, a participant’s emission while breathing does not correlate with that participant’s emission performing other activities, consistent with our previous observations (Gregson et al. Citation2021b). In other words, a high emitter during breathing is not necessarily a high emitter during speaking. When masked, the detected particle number concentration is approximately an order of magnitude lower than that for the same activity while unmasked. In fact, fewer particles were detected in front of the participant’s face for all activities while masked compared to unmasked breathing, with masked activities producing lower detected particle number concentrations that were between 0.16 to 0.74 times that of unmasked breathing (in the 0.5 − 20 µm diameter size range, APS measurement). In other words, for every 100 particles exhaled during breathing without a mask, between 16 and 74 particles would be measured for a masked participant performing different activities. In the 0.3 – 10 µm diameter size range (i.e., OPS size range), the detected particle number concentrations from mask-front and mask-side were between 0.19 to 0.82 times, and between 0.39 to 1.8 times that of unmasked breathing, respectively.
At the side of the mask, detected particle number concentrations were between 0.11 to 0.39 times those measured for unmasked performance of the same activity. However, detected particle number concentrations at the side of the mask were between 1.4 to 2.2 times higher than those measured at the front of the mask, a consequence of leakage through the open side of the mask (Cappa et al. Citation2021a). An additional observation from is that the ordering of particle emission across participants is not conserved while masked (i.e., the highest emitter while unmasked may not necessarily be the highest emitter while masked), likely a consequence of how well the surgical face mask fits the participant.
As previously observed by other groups in experimental settings (Asadi et al. Citation2020; Cappa et al. Citation2021a; Cappa et al. Citation2021b; Çelik and Eren Citation2022; Kerl et al. Citation2022; Konda et al. Citation2020; Lee, Grinshpun, and Reponen Citation2008; Milton et al. Citation2013; Shah et al. Citation2021; Zangmeister et al. Citation2020) and when applying different theoretical models (Rios de Anda et al. Citation2022; Robinson et al. Citation2022; Robinson et al. Citation2021), the particle concentration in air that passes through the mask is reduced substantially relative to no mitigation being in place. Based on the data presented in , it is possible to calculate through-mask particle filtration efficiency for each studied activity measured by APS in front of the participant’s face. shows the calculated mean (black squares) and pooled-participant means (purple squares) through-mask particle filtration efficiency for all seven activities (The corresponding data are provided in Table S6.) Overall, surgical face masks reduced the detected particle number concentration, but the extent of reduction varies with activity. The median through-mask filtration efficiency for breathing is 80%, whereas the median through-mask filtration efficiency for sustained /a::/ is 95%. Our results when speaking (87%) are consistent with previous experimental studies of surgical mask efficiencies (90%) (Asadi et al. Citation2020). There is substantial scatter for some activities (i.e., certain individuals exhibiting low through-mask filtration efficiencies for specific tasks), which may be due to small fluctuations in already low number of particles detected for particular activity.
Figure 6. (a) Through-mask particle filtration efficiency of breathing, speaking “Happy Birthday” and different voice therapy exercises calculated from APS data. Each color of the scattered diamond shapes represents an individual participant. (b) Correlation between particle number concentrations detected in front of the participant during masked and unmasked voice therapy tasks. The linear fit equation and R2 are shown. Standard deviation formula was used to calculate the error bars.
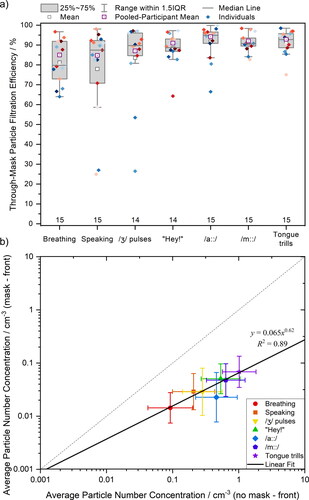
In , we report the average number concentration for each activity measured in front of the participant’s face when masked compared to the same activity while unmasked. If the face mask had no effect on particle emission, all data would fall onto the 1:1 line. Instead, all data fall below the 1:1 line, confirming that fewer particles are detected from masked individuals than unmasked. Broadly speaking, activities that generate a higher particle number concentration exhibit higher through-mask filtration efficiencies, which is demonstrated by the slope of the fit line <1 in . The reason for this observation is because these activities generate larger particles, which are more efficiently removed, as will be discussed in the next section.
Size-dependent particle filtration efficiency
To evaluate why through-mask filtration efficiency is task specific, it is useful to examine the size distribution of aerosol generated by each activity. displays mean aerosol size distributions for all seven tasks while unmasked and while masked. shows measurements taken with an APS in front of the participant’s face, whereas shows measurements taken with an OPS both in front of the participant’s face and to the side (see ). The red traces represent breathing, whereas black and grey traces represent the other six activities. The dashed horizontal blue line indicates the concentration associated with approximately 10 particles detected per total time of the measurement (varied from 210 up to 680 s). This value has been chosen based on the number of particles needed to quantify the number concentration (Gregson et al. Citation2021a). Data falling below this limit represent detection of particles too infrequent to be meaningfully interpreted, as Poisson (shot-) noise will dominate the arrival statistics, leading to large uncertainty in the mean concentration (Damit, Wu, and Cheng Citation2014; Gregson et al. Citation2021a; Larsen Citation2007). This correction has only been applied for unmasked activities in order to reduce the shot-noise; all particles detected during masked activities are included in the analysis.
Figure 7. Comparison of mean particle size distributions generated when breathing, speaking, and performing different voice therapy exercises measured by (a) APS and (b) OPS in front of the participant without a mask (black solid line), in front of the participant with the mask (light grey solid line) and on the side of the mask (grey dashed line, OPS only). (c) Size-dependent through-mask particle filtration efficiency for breathing, speaking, and different voice therapy exercises calculated from APS data.
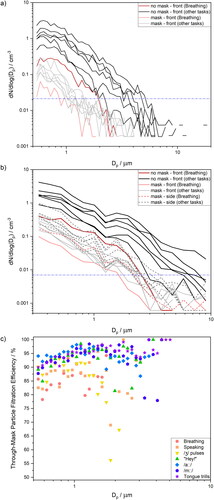
corroborate our interpretations of the effect of masks on detected particle number concentration. The concentrations associated with the size distributions for masked activities (including measurement at the side of the mask) are consistently lower than those for unmasked activities. Comparing across different activities, breathing aerosol (red traces) is unimodal (bronchiolar mode), with particle concentration dropping steeply at particle sizes above ∼2 µm due to the lack of a laryngeal mode associated with vocalization or an oral mode associated with oral articulation (Archer et al. Citation2022; Asadi et al. Citation2019; Gregson et al. Citation2021b; Johnson et al. Citation2011; Pöhlker et al. Citation2023; Saccente-Kennedy et al. Citation2022). By contrast, activities requiring vocalization or enhanced oral articulation (i.e., all black traces) generally extend to larger particle sizes (e.g. >4 µm). However, when masked, all size distributions appear to overlap, with the maximum in the size distribution shifted to smaller sizes than that those for the same activities performed unmasked. This observation is consistent with the expectation that masks are more efficient at filtering larger particles.
Size-dependent through-mask particle filtration efficiencies for each activity were calculated from the APS-measured aerosol size distributions and are shown in . These efficiencies were calculated for all bin sizes by comparing the particle number concentration from all participants with and without mitigation in place. As mentioned earlier, the cutoff correction of <10 particles per bin size was only applied for unmasked activities. Values for size bins where <10 particles were detected in the unmasked activity are not shown in . For the activities generally producing fewer particles (breathing, speaking, /ȝ/ pulses), and for the size bins with relatively fewer particles (≥2 µm), the Poisson noise is still apparent. However, the through-mask filtration efficiency increases with increasing particle size (in the 0.5 − 20 µm diameter size range) which is the most pronounced for activities that produce the highest number of particles (/a::/, /m::/, tongue trills). For those activities, the through-mask particle filtration efficiency ≥1 µm diameter is around 95%. Below 1 µm diameter, through-mask filtration efficiencies progressively reduce to ∼80–90% at 0.5 µm diameter. These size-dependent through-mask filtration efficiencies mean that laryngeal and oral mode aerosol are filtered at extremely high efficiency (approaching 100%), which is especially important if the load of viruses or bacteria scale with particle mass (Robinson et al. Citation2022). This size dependence in filtration efficiency is expected based on Stokes’ law, as smaller particles can more easily follow gas streamlines and escape the mask, whereas larger particles cannot and therefore are more likely to be lost by impaction.
The size-dependent through-mask filtration efficiency explains the observations in of task-dependent filtration efficiencies. Tongue trills generate an extremely broad size distribution extending out to large sizes (Saccente-Kennedy et al. Citation2022). (Tongue trills are the black line at highest concentration in .) /a::/ and /m::/ are both loud vocalizations, so the laryngeal mode is particularly enhanced for these activities, as the magnitude of the laryngeal mode scales with the loudness of the vocalization (Gregson et al. Citation2021b). Therefore, these activities generate many larger particles, which are most efficiently filtered by the surgical face mask. By contrast, breathing does not generate these larger particles; face coverings will less efficiently filter these smaller particles, resulting in a lower through-mask filtration efficiency for breathing. (Note that the through-mask filtration efficiency is still high at ∼80%.) Overall, face coverings modify the emitted particle number concentration across the full size distribution for any activity to one that is generally consistent with (but lower in concentration than) that of breathing.
These observations are consistent with existing literature on the filtration efficiency of face coverings. As previously observed by other groups in experimental settings (Asadi et al. Citation2020; Cappa et al. Citation2021a; Cappa et al. Citation2021b; Çelik and Eren Citation2022; Kerl et al. Citation2022; Konda et al. Citation2020; Lee, Grinshpun, and Reponen Citation2008; Milton et al. Citation2013; Shah et al. Citation2021; Zangmeister et al. Citation2020) and when applying different theoretical models (Rios de Anda et al. Citation2022; Robinson et al. Citation2022; Robinson et al. Citation2021), emitted aerosol concentrations are reduced substantially after passing through a mask relative to the no mitigation scenario. Although some theoretical studies predict the particle filtration efficiency will drop below 50% for particles below 0.6 µm (Robinson et al. Citation2022), we find that through-mask particle filtration efficiencies <1 µm diameter are generally ≥78%.
Efficacy of surgical face masks for filtering droplets >20 µm diameter
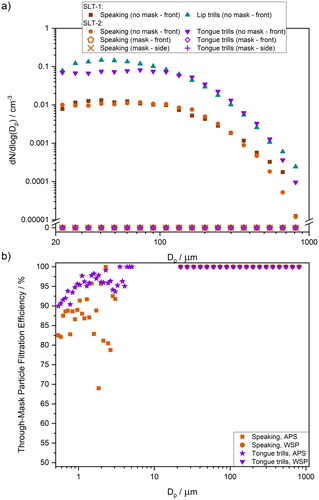
The total number of droplets expired per minute was measured using a previously-described WSP approach (Harrison et al. Citation2023). shows box and whisker plots summarizing results for speaking and lip trills for SLT-1 studies (Harrison et al. Citation2023) and speaking and tongue trills for SLT-2 studies. Consistent with the aerosol measurement protocol, droplet measurements were conducted in front of the participant’s face when the participant was not wearing a mask, and both in front and on the side of the participant’s face when the participant was wearing a mask. The data presented in are summarized in Table S7, along with p-values from paired t-tests comparing speaking activity during the SLT-1 and the SLT-2 droplet measurement.
Figure 8. Number exhalation rates measured by WSP approach for speaking (orange), lip trills (turquoise) and tongue trills (purple), in front of the participant’s face without a mask, with a mask and on at the side of the participant’s face with a mask. SLT-1 data taken from Harrison et al. (Citation2023).
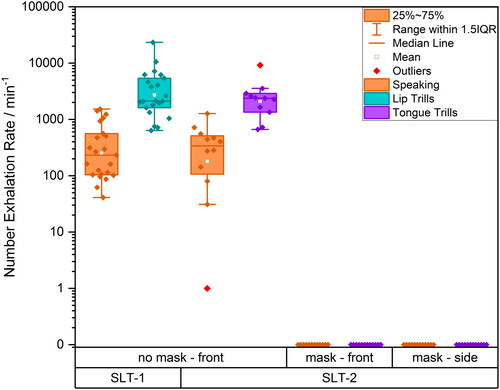
Consistent with our previous droplet measurements (Harrison et al. Citation2023) and with particle measurements (Saccente-Kennedy et al. Citation2022), the number of droplets detected for tongue trills is larger than for speaking. Droplet emission rates for specific activities are consistent across both SLT-1 and SLT-2 cohorts (p = 0.2). However, when the participants wore surgical face masks, no droplets were detected either in front or to the side of the mask, corresponding to a 100% mask filtration efficiency for droplets (>20 µm) for both activities.
Mean droplet size distributions are shown in . The comparison shows data for unmasked activities, including speaking and lip trills for SLT-1 studies (Harrison et al. Citation2023) and speaking and tongue trills for SLT-2 studies. For this study, tongue trills were selected instead of lip trills as they are easier to perform while wearing a mask. The droplet size distribution for speaking is consistent with previous measurements by our group (Harrison et al. Citation2023). Due to the size of the oscillating structures, tongue trills generate slightly fewer droplets than the lip trills, consistent with previous particle measurements (Saccente-Kennedy et al. Citation2022). When participants wore surgical face masks, no droplets were detected at any size. shows the size-dependent filtration efficiency for speaking and tongue trills, combining through-mask filtration efficiencies across the entire measured particle size range. The main conclusion is that while the filtration efficiency of surgical masks depends on the activity, it rises with increasing particle size (for particles >0.5 µm diameter) and approaches 100% for particles with a diameter of ∼4 µm and above.
Figure 9. (a) Comparison of mean size distributions of number concentration for speaking SLT-1 (brown), speaking SLT-2 (orange), lip trills SLT-1 (turquoise) and tongue trills SLT-2 (purple) in front of the participant’s face without mitigation in place and with mitigation, both in front and on the side of the mask. SLT-1 data taken from Harrison et al. (Citation2023). (b) Comparison of size-dependent through-mask filtration efficiency for particles (measured by APS) and droplets (measured by WSP) for speaking (orange) and tongue trills (purple).
Conclusisons
This study explores respiratory particle generation during breathing, speaking, and a selection of voice therapy tasks used in the treatment of voice disorders in a cohort of individuals over two measurement sessions (SLT-1 and SLT-2). The voice therapy tasks were chosen to represent activities with different particle size distributions, particle concentrations, and expected exhalation flow rates. During the second measurement session (SLT-2), particle generation was measured with and without mitigation (surgical face mask) in place. The wide range of studied tasks provides a unique comparison of through-mask particle filtration efficiency based on the nature of aerosol generation (i.e., voiced vs. unvoiced, significant vs. little oral articulation) as well as the particle number and size distribution.
Particle generation among the group of participants was broadly consistent across both measurement periods for the studied activities, with participants generating similar amounts of particles for similar activities.
The overall through-mask efficiency of surgical masks for reducing respiratory particle emission was also quantified. For breathing and speaking, the median filtration efficiencies were 80% and 87%, respectively. The measured through-mask filtration efficiency for speaking is consistent with existing literature quantifying surgical mask efficiencies (Asadi et al. Citation2020; Cappa et al. Citation2021a). The median through-mask filtration efficiency for voice therapy tasks was higher than that for breathing and speaking, with values ranging from 89% (“Hey!”) to 95% (/a::/). Without mitigation, these voice therapy tasks produce 2.5 – 10 times more particles compared to breathing (Saccente-Kennedy et al. Citation2022). However, when the participant wore a face mask, the particle number concentration measured at the front of the mask was always less than that for breathing with no mitigation in place. This is a significant observation, as it suggests face coverings reduce the amount of emitted respiratory particles to levels below that associated with breathing. The detected particle number concentrations at the side of the mask were between 1.4 to 2.2 times higher than those measured at the front of the mask, a consequence of leakage through the open side of the mask (Cappa et al. Citation2021a). The activity-dependence of filtration efficiency is a consequence of the size-dependence of particle filtration by surgical face masks. Through-mask filtration efficiencies were high (80 – 95%) for particles 0.5 − 2 µm diameter, with masks filtering a greater fraction of particles of larger sizes. For particle sizes >4 µm diameter, through-mask filtration efficiencies were ∼100%.
These results have important implications in terms of healthcare policy. This study demonstrates that despite the potential for leakage around the edges of the surgical face mask, these masks substantially mitigate the amount of respiratory aerosol emitted by the wearer to levels below that of breathing without a face mask (Pan et al. Citation2021). Surgical face masks also completely filter out larger (>20 µm diameter) respiratory droplets. Consequently, wearing surgical face masks may reduce the potential for disease transmission through the inhalation route.
Supplemental Material
Download PDF (241.4 KB)Acknowledgements
We thank all our volunteer participants for their contribution to this study.
Disclosure statement
No potential conflict of interest was reported by the author(s).
Data availability statement
Data underlying the figures are publicly available in the BioStudies database (https://www.ebi.ac.uk/biostudies/) under accession ID S-BSST1187.
The analyzed data are provided in Supplemental Information available online.
Additional information
Funding
References
- Archer, J., L. P. McCarthy, H. E. Symons, N. A. Watson, C. M. Orton, W. J. Browne, J. Harrison, B. Moseley, K. E. J. Philip, J. D. Calder, et al. 2022. Comparing aerosol number and mass exhalation rates from children and adults during breathing, speaking and singing. Interface Focus. 12 (2):20210078. doi: 10.1098/rsfs.2021.0078.
- Asadi, S., C. D. Cappa, S. Barreda, A. S. Wexler, N. M. Bouvier, and W. D. Ristenpart. 2020. Efficacy of masks and face coverings in controlling outward aerosol particle emission from expiratory activities. Sci. Rep. 10 (1):15665. doi: 10.1038/s41598-020-72798-7.
- Asadi, S., A. S. Wexler, C. D. Cappa, S. Barreda, N. M. Bouvier, and W. D. Ristenpart. 2019. Aerosol emission and superemission during human speech increase with voice loudness. Sci. Rep. 9 (1):2348. doi: 10.1038/s41598-019-38808-z.
- Cappa, C. D., S. Asadi, S. Barreda, A. S. Wexler, N. M. Bouvier, and W. D. Ristenpart. 2021a. Expiratory aerosol particle escape from surgical masks due to imperfect sealing. Sci. Rep. 11 (1):12110. doi: 10.1038/s41598-021-91487-7.
- Cappa, C. D., W. D. Ristenpart, S. Barreda, N. M. Bouvier, E. Levintal, A. S. Wexler, and S. A. Roman, The San Francisco Opera Costume Department. 2021b. A highly efficient cloth facemask design. Aerosol Sci. Technol. 56 (1):12–28. doi: 10.1080/02786826.2021.1962795.
- Çelik, Ü., and H. Eren. 2022. An approach to compare performance of surgical masks for fighting against the COVID-19 pandemic. Aerosol Sci. Technol. 56 (5):434–45. doi: 10.1080/02786826.2022.2039589.
- Chen, C.-C., and K. Willeke. 1992. Aerosol penetration through surgical masks. Am. J. Infect. Control. 20 (4):177–84. doi: 10.1016/S0196-6553(05)80143-9.
- Cox, J., B. Christensen, N. Burton, K. H. Dunn, M. Finnegan, A. Ruess, and C. Estill. 2023. Transmission of SARS-CoV-2 in the workplace: Key findings from a rapid review of the literature. Aerosol Sci. Technol. 57 (3):233–54. doi: 10.1080/02786826.2023.2166394.
- Damit, B., C.-Y. Wu, and M.-D. Cheng. 2014. On the validity of the Poisson assumption in sampling nanometer-sized aerosols. Aerosol Sci. Technol. 48 (5):562–70. doi: 10.1080/02786826.2014.899682.
- Drewnick, F., J. Pikmann, F. Fachinger, L. Moormann, F. Sprang, and S. Borrmann. 2021. Aerosol filtration efficiency of household materials for homemade face masks: Influence of material properties, particle size, particle electrical charge, face velocity, and leaks. Aerosol Sci. Technol. 55 (1):63–79. doi: 10.1080/02786826.2020.1817846.
- Freitag, S., S. G. Howell, and K. T. C. Jim. 2022. Estimating the reduction in SARS-CoV-2 viral load by common face masks with a simple leak model. Aerosol Sci. Technol. 56 (7):573–91. doi: 10.1080/02786826.2022.2053656.
- Gregson, F. K. A., S. Sheikh, J. Archer, H. E. Symons, J. S. Walker, A. E. Haddrell, C. M. Orton, F. W. Hamilton, J. M. Brown, B. R. Bzdek, et al. 2021a. Analytical challenges when sampling and characterising exhaled aerosol. Aerosol Sci. Technol. 56 (2):160–75. doi: 10.1080/02786826.2021.1990207.
- Gregson, F. K. A., N. A. Watson, C. M. Orton, A. E. Haddrell, L. P. McCarthy, T. J. R. Finnie, N. Gent, G. C. Donaldson, P. L. Shah, J. D. Calder, et al. 2021b. Comparing aerosol concentrations and particle size distributions generated by singing, speaking and breathing. Aerosol Sci. Technol. 55 (6):681–91. doi: 10.1080/02786826.2021.1883544.
- Harrison, J., B. Saccente-Kennedy, C. M. Orton, L. P. McCarthy, J. Archer, H. E. Symons, A. Szczepanska, N. A. Watson, W. J. Browne, B. Moseley, et al. 2023. Emission rates, size distributions, and generation mechanism of oral respiratory droplets. Aerosol Sci. Technol. 57 (3):187–99. doi: 10.1080/02786826.2022.2158778.
- Johnson, G. R., L. Morawska, Z. D. Ristovski, M. Hargreaves, K. Mengersen, C. Y. H. Chao, M. P. Wan, Y. Li, X. Xie, D. Katoshevski, et al. 2011. Modality of human expired aerosol size distributions. J. Aerosol Sci. 42 (12):839–51. doi: 10.1016/j.jaerosci.2011.07.009.
- Jones, R. M., and L. M. Brosseau. 2015. Aerosol transmission of infectious disease. J. Occup. Environ. Med. 57 (5):501–8. doi: 10.1097/JOM.0000000000000448.
- Kerl, J., A. W. Gena, H. Alsaad, C. Voelker, and D. Dellweg. 2022. Influence of wearing masks on exhaled air aerodynamics. J. Med. Eng. Technol. 46 (3):231–42. doi: 10.1080/03091902.2022.2026507.
- Konda, A., A. Prakash, G. A. Moss, M. Schmoldt, G. D. Grant, and S. Guha. 2020. Aerosol filtration efficiency of common fabrics used in respiratory cloth masks. ACS Nano. 14 (5):6339–47. doi: 10.1021/acsnano.0c03252.
- Larsen, M. L. 2007. Spatial distributions of aerosol particles: Investigation of the Poisson assumption. J. Aerosol Sci. 38 (8):807–22. doi: 10.1016/j.jaerosci.2007.06.007.
- Lee, S. A., S. A. Grinshpun, and T. Reponen. 2008. Respiratory performance offered by N95 respirators and surgical masks: Human subject evaluation with nacl aerosol representing bacterial and viral particle size range. Ann. Occup. Hyg. 52 (3):177–85. doi: 10.1093/annhyg/men005.
- Lindsley, W. G., F. M. Blachere, D. H. Beezhold, B. F. Law, R. C. Derk, J. M. Hettick, K. Woodfork, W. T. Goldsmith, J. R. Harris, M. G. Duling, et al. 2021. A comparison of performance metrics for cloth masks as source control devices for simulated cough and exhalation aerosols. Aerosol Sci. Technol. 55 (10):1125–42. doi: 10.1080/02786826.2021.1933377.
- McCarthy, L. P., C. M. Orton, N. A. Watson, F. K. A. Gregson, A. E. Haddrell, W. J. Browne, J. D. Calder, D. Costello, J. P. Reid, P. L. Shah, et al. 2021. Aerosol and droplet generation from performing with woodwind and brass instruments. Aerosol Sci. Technol. 55 (11):1277–87. doi: 10.1080/02786826.2021.1947470.
- Milton, D. K., M. P. Fabian, B. J. Cowling, M. L. Grantham, and J. J. McDevitt. 2013. Influenza virus aerosols in human exhaled breath: Particle size, culturability, and effect of surgical masks. PLoS Pathog. 9 (3):e1003205. doi: 10.1371/journal.ppat.1003205.
- Morawska, L., G. R. Johnson, Z. D. Ristovski, M. Hargreaves, K. Mengersen, S. Corbett, C. Y. H. Chao, Y. Li, and D. Katoshevski. 2009. Size distribution and sites of origin of droplets expelled from the human respiratory tract during expiratory activities. J. Aerosol Sci. 40 (3):256–69. doi: 10.1016/j.jaerosci.2008.11.002.
- Orton, C. M., H. E. Symons, B. Moseley, J. Archer, N. A. Watson, K. E. J. Philip, S. Sheikh, B. Saccente-Kennedy, D. Costello, W. J. Browne, et al. 2022. A comparison of respiratory particle emission rates at rest and while speaking or exercising. Commun Med 2 (1):44. doi: 10.1038/s43856-022-00103-w.
- Pan, J., C. Harb, W. Leng, and L. C. Marr. 2021. Inward and outward effectiveness of cloth masks, a surgical mask, and a face shield. Aerosol Sci. Technol. 55 (6):718–33. doi: 10.1080/02786826.2021.1890687.
- Pöhlker, M. L., C. Pöhlker, O. O. Krüger, J.-D. Förster, T. Berkemeier, W. Elbert, J. Fröhlich-Nowoisky, U. Pöschl, G. Bagheri, E. Bodenschatz, J. A. Huffman, S. Scheithauer, E. Mikhailov. 2023. Respiratory aerosols and droplets in the transmission of infectious diseases. Rev. Mod. Phys. 95 (4):045001. doi: 10.1103/RevModPhys.95.045001.
- Pushpawela, B., S. Amanatidis, Y. Huang, and R. C. Flagan. 2022. Variability of the penetration of particles through facemasks. Aerosol Sci. Technol. 56 (2):186–203. doi: 10.1080/02786826.2021.2003291.
- Rios de Anda, I., J. W. Wilkins, J. F. Robinson, C. P. Royall, and R. P. Sear. 2022. Modeling the filtration efficiency of a woven fabric: The role of multiple lengthscales. Phys Fluids 34 (3):033301. doi: 10.1063/5.0074229.
- Robinson, J. F., I. Rios de Anda, F. J. Moore, F. K. A. Gregson, J. P. Reid, L. Husain, R. P. Sear, and C. P. Royall. 2022. How effective are face coverings in reducing transmission of COVID-19? Aerosol Sci. Technol. 56 (6):473–87. doi: 10.1080/02786826.2022.2042467.
- Robinson, J. F., I. Rios de Anda, F. J. Moore, J. P. Reid, R. P. Sear, and C. P. Royall. 2021. Efficacy of face coverings in reducing transmission of COVID-19: Calculations based on models of droplet capture. Phys Fluids 33 (4):043112. doi: 10.1063/5.0047622.
- Saccente-Kennedy, B., J. Archer, H. E. Symons, N. A. Watson, C. M. Orton, W. J. Browne, J. Harrison, J. D. Calder, P. L. Shah, D. Costello, et al. 2022. Quantification of respirable aerosol particles from speech and language therapy exercises. J. Voice. doi: 10.1016/j.jvoice.2022.07.006.
- Schindelin, J., I. Arganda-Carreras, E. Frise, V. Kaynig, M. Longair, T. Pietzsch, S. Preibisch, C. Rueden, S. Saalfeld, B. Schmid, et al. 2012. Fiji: An open-source platform for biological-image analysis. Nat. Methods. 9 (7):676–82. doi: 10.1038/nmeth.2019.
- Schmitt, J., and J. Wang. 2022. A critical review on the role of leakages in the facemask protection against SARS-CoV-2 infection with consideration of vaccination and virus variants. Indoor Air. 32 (10):e13127. doi: 10.1111/ina.13127.
- Shah, Y., J. W. Kurelek, S. D. Peterson, and S. Yarusevych. 2021. Experimental investigation of indoor aerosol dispersion and accumulation in the context of COVID-19: Effects of masks and ventilation. Phys Fluids 33 (7):073315. doi: 10.1063/5.0057100.
- Zangmeister, C. D., J. G. Radney, E. P. Vicenzi, and J. L. Weaver. 2020. Filtration efficiencies of nanoscale aerosol by cloth mask materials used to slow the spread of SARS-CoV-2. ACS Nano. 14 (7):9188–200. doi: 10.1021/acsnano.0c05025.